
|
|||||
|
 | |
| |
| |
| |
| |
| |
|
Gene: DNAH5 |
Gene summary for DNAH5 |
| Gene information | Species | Human | Gene symbol | DNAH5 | Gene ID | 1767 |
| Gene name | dynein axonemal heavy chain 5 | |
| Gene Alias | CILD3 | |
| Cytomap | 5p15.2 | |
| Gene Type | protein-coding | GO ID | GO:0000003 | UniProtAcc | Q8TE73 |
Top |
Malignant transformation analysis |
| Identification of the aberrant gene expression in precancerous and cancerous lesions by comparing the gene expression of stem-like cells in diseased tissues with normal stem cells |
| Entrez ID | Symbol | Replicates | Species | Organ | Tissue | Adj P-value | Log2FC | Malignancy |
| 1767 | DNAH5 | C04 | Human | Oral cavity | OSCC | 2.09e-35 | 1.82e+00 | 0.2633 |
| 1767 | DNAH5 | C21 | Human | Oral cavity | OSCC | 7.14e-04 | 1.57e-01 | 0.2678 |
| 1767 | DNAH5 | SYSMH2 | Human | Oral cavity | OSCC | 4.32e-07 | 6.58e-01 | 0.2326 |
| 1767 | DNAH5 | SYSMH3 | Human | Oral cavity | OSCC | 5.39e-16 | 7.09e-01 | 0.2442 |
| 1767 | DNAH5 | SYSMH5 | Human | Oral cavity | OSCC | 1.09e-26 | 1.05e+00 | 0.0647 |
| 1767 | DNAH5 | HTA12-25-1 | Human | Pancreas | PDAC | 2.50e-03 | 4.72e-01 | 0.313 |
| 1767 | DNAH5 | HTA12-26-1 | Human | Pancreas | PDAC | 4.34e-14 | 7.27e-01 | 0.3728 |
| 1767 | DNAH5 | HTA12-29-1 | Human | Pancreas | PDAC | 6.09e-12 | 3.98e-01 | 0.3722 |
| 1767 | DNAH5 | HTA12-32-1 | Human | Pancreas | PDAC | 1.20e-02 | 7.98e-01 | 0.3624 |
| Page: 1 |
| Tissue | Expression Dynamics | Abbreviation |
| Oral Cavity | 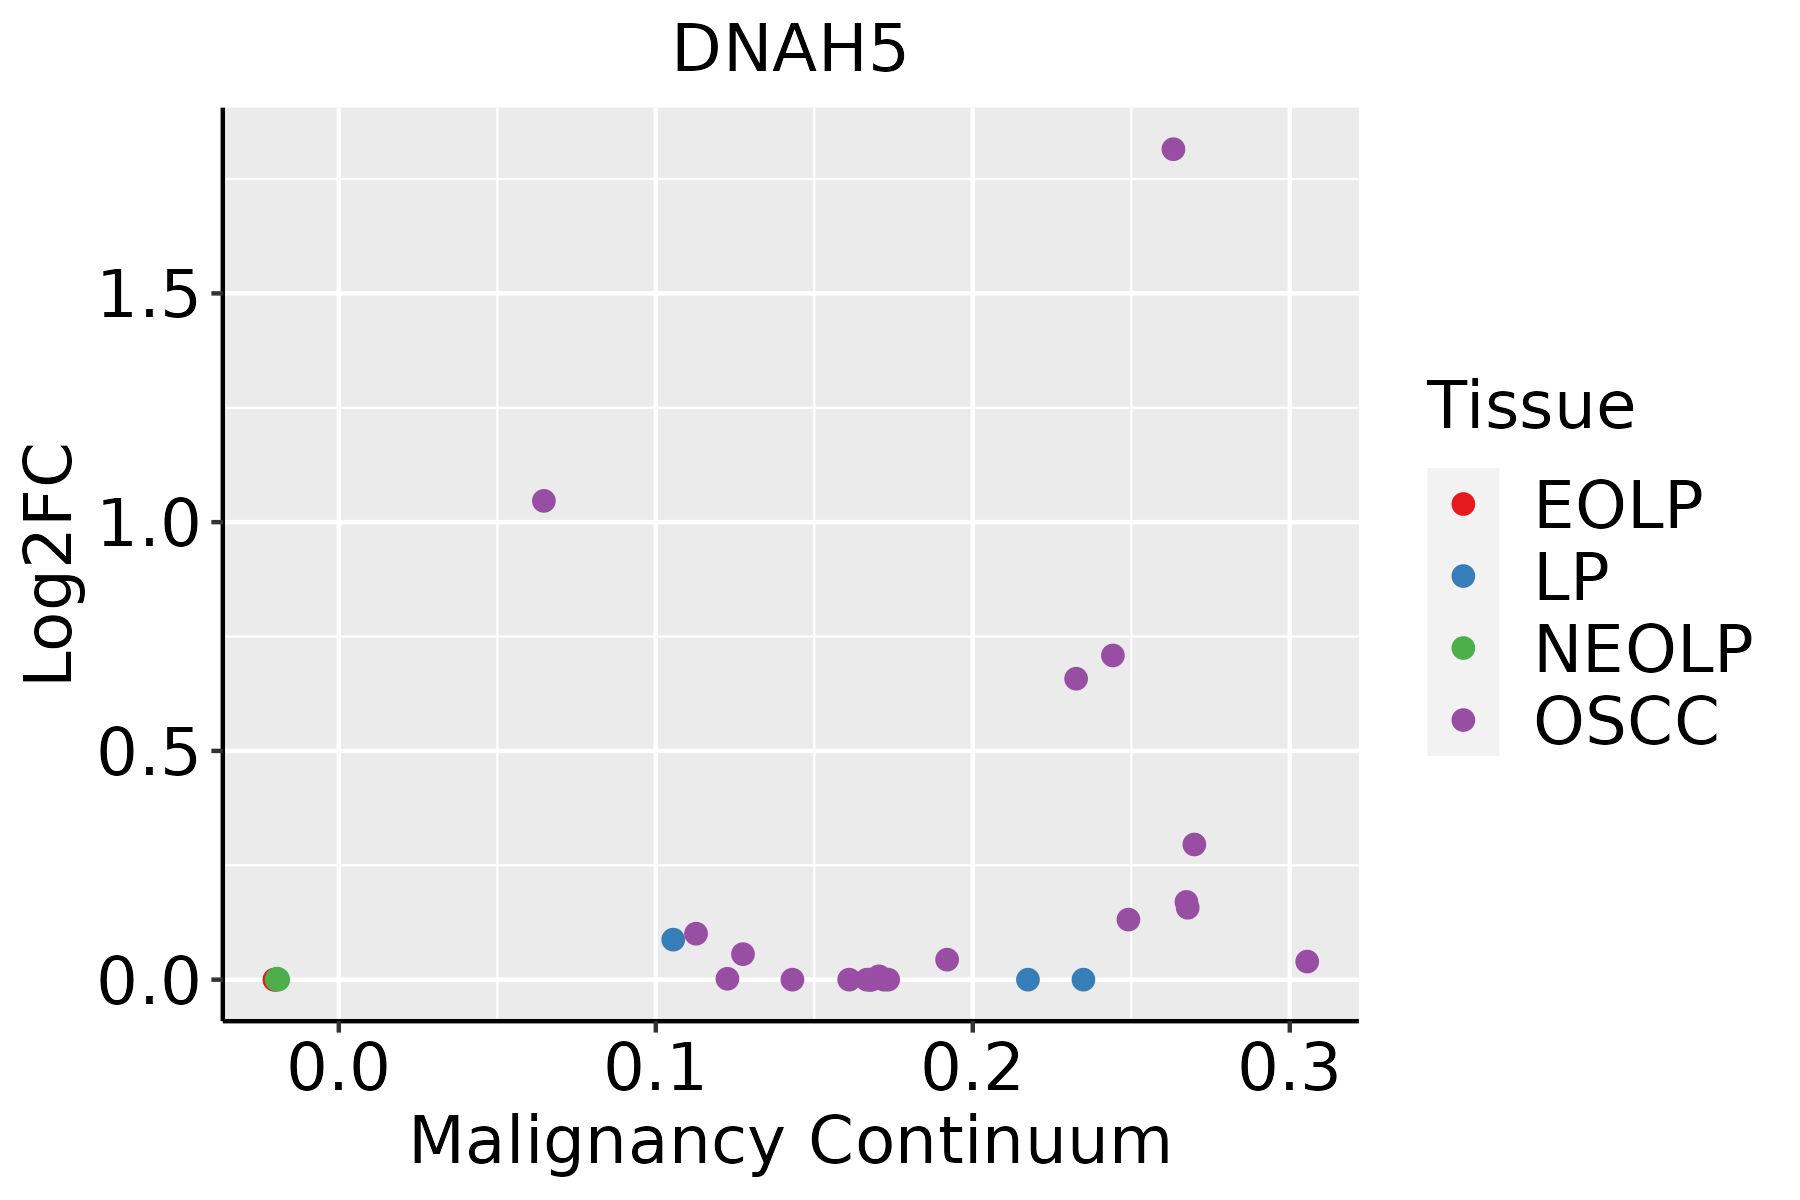 | EOLP: Erosive Oral lichen planus |
| LP: leukoplakia | ||
| NEOLP: Non-erosive oral lichen planus | ||
| OSCC: Oral squamous cell carcinoma |
| ∗log2FC in expression of this searched gene in stem-like cells from each diseased tissue sample relative to stem-like cells in normal samples in each tissue plotted against the malignancy continuum. Samples are colored based on if they are from different disease stage. |
Top |
Malignant transformation related pathway analysis |
| Find out the enriched GO biological processes and KEGG pathways involved in transition from healthy to precancer to cancer |
| Tissue | Disease Stage | Enriched GO biological Processes |
| Colorectum | AD |  |
| Colorectum | SER |  |
| Colorectum | MSS |  |
| Colorectum | MSI-H |  |
| Colorectum | FAP |  |
| ∗Top 15 enriched GO BP terms are showed in the bar plot of each disease state in each tissue. Each row represents a significant GO biological process which is colored according to the -log10(p.adjust). |
| Page: 1 2 3 4 5 6 7 8 9 |
| GO ID | Tissue | Disease Stage | Description | Gene Ratio | Bg Ratio | pvalue | p.adjust | Count |
| GO:00991113 | Oral cavity | OSCC | microtubule-based transport | 96/7305 | 190/18723 | 7.92e-04 | 4.27e-03 | 96 |
| GO:0021591 | Oral cavity | OSCC | ventricular system development | 18/7305 | 29/18723 | 1.00e-02 | 3.49e-02 | 18 |
| Page: 1 |
| Pathway ID | Tissue | Disease Stage | Description | Gene Ratio | Bg Ratio | pvalue | p.adjust | qvalue | Count |
| hsa0501428 | Oral cavity | OSCC | Amyotrophic lateral sclerosis | 246/3704 | 364/8465 | 6.65e-21 | 1.11e-18 | 5.67e-19 | 246 |
| hsa0501628 | Oral cavity | OSCC | Huntington disease | 204/3704 | 306/8465 | 1.70e-16 | 7.13e-15 | 3.63e-15 | 204 |
| hsa0502228 | Oral cavity | OSCC | Pathways of neurodegeneration - multiple diseases | 292/3704 | 476/8465 | 1.60e-15 | 4.47e-14 | 2.28e-14 | 292 |
| hsa05014112 | Oral cavity | OSCC | Amyotrophic lateral sclerosis | 246/3704 | 364/8465 | 6.65e-21 | 1.11e-18 | 5.67e-19 | 246 |
| hsa05016112 | Oral cavity | OSCC | Huntington disease | 204/3704 | 306/8465 | 1.70e-16 | 7.13e-15 | 3.63e-15 | 204 |
| hsa05022112 | Oral cavity | OSCC | Pathways of neurodegeneration - multiple diseases | 292/3704 | 476/8465 | 1.60e-15 | 4.47e-14 | 2.28e-14 | 292 |
| Page: 1 |
Top |
Cell-cell communication analysis |
| Identification of potential cell-cell interactions between two cell types and their ligand-receptor pairs for different disease states |
| Ligand | Receptor | LRpair | Pathway | Tissue | Disease Stage |
| Page: 1 |
Top |
Single-cell gene regulatory network inference analysis |
| Find out the significant the regulons (TFs) and the target genes of each regulon across cell types for different disease states |
| TF | Cell Type | Tissue | Disease Stage | Target Gene | RSS | Regulon Activity |
| ∗The dot plots of a searched regulon are shown for all cell subpopulations in each disease state of each tissue based on the regulon specific score inferred using pySCENIC and by calculating the average expression. |
| Page: 1 |
Top |
Somatic mutation of malignant transformation related genes |
| Annotation of somatic variants for genes involved in malignant transformation |
| Hugo Symbol | Variant Class | Variant Classification | dbSNP RS | HGVSc | HGVSp | HGVSp Short | SWISSPROT | BIOTYPE | SIFT | PolyPhen | Tumor Sample Barcode | Tissue | Histology | Sex | Age | Stage | Therapy Types | Drugs | Outcome |
| DNAH5 | SNV | Missense_Mutation | c.4218N>T | p.Lys1406Asn | p.K1406N | Q8TE73 | protein_coding | deleterious(0.02) | probably_damaging(0.965) | TCGA-A1-A0SN-01 | Breast | breast invasive carcinoma | Female | <65 | I/II | Chemotherapy | ac | SD | |
| DNAH5 | SNV | Missense_Mutation | c.3920N>T | p.Glu1307Val | p.E1307V | Q8TE73 | protein_coding | tolerated(0.06) | benign(0.007) | TCGA-A1-A0SO-01 | Breast | breast invasive carcinoma | Female | >=65 | I/II | Chemotherapy | SD | ||
| DNAH5 | SNV | Missense_Mutation | c.5639C>T | p.Ser1880Phe | p.S1880F | Q8TE73 | protein_coding | deleterious(0.01) | possibly_damaging(0.497) | TCGA-A2-A0EQ-01 | Breast | breast invasive carcinoma | Female | <65 | I/II | Chemotherapy | adriamycin | SD | |
| DNAH5 | SNV | Missense_Mutation | c.10927N>G | p.Leu3643Val | p.L3643V | Q8TE73 | protein_coding | deleterious(0.01) | possibly_damaging(0.842) | TCGA-A2-A0SY-01 | Breast | breast invasive carcinoma | Female | <65 | III/IV | Hormone Therapy | arimidex | SD | |
| DNAH5 | SNV | Missense_Mutation | c.8384N>A | p.Arg2795Gln | p.R2795Q | Q8TE73 | protein_coding | deleterious(0) | probably_damaging(1) | TCGA-A2-A0YD-01 | Breast | breast invasive carcinoma | Female | <65 | I/II | Chemotherapy | cytoxan | SD | |
| DNAH5 | SNV | Missense_Mutation | rs759136593 | c.13580N>A | p.Ala4527Asp | p.A4527D | Q8TE73 | protein_coding | tolerated(0.42) | benign(0.012) | TCGA-A2-A25A-01 | Breast | breast invasive carcinoma | Female | <65 | I/II | Unspecific | Cytoxan | SD |
| DNAH5 | SNV | Missense_Mutation | c.13682T>A | p.Phe4561Tyr | p.F4561Y | Q8TE73 | protein_coding | tolerated(0.46) | benign(0.107) | TCGA-A2-A25B-01 | Breast | breast invasive carcinoma | Female | <65 | I/II | Chemotherapy | taxotere | PD | |
| DNAH5 | SNV | Missense_Mutation | rs199916139 | c.13570N>A | p.Asp4524Asn | p.D4524N | Q8TE73 | protein_coding | deleterious(0.01) | probably_damaging(0.948) | TCGA-AN-A046-01 | Breast | breast invasive carcinoma | Female | >=65 | I/II | Unknown | Unknown | SD |
| DNAH5 | SNV | Missense_Mutation | c.1504N>A | p.Glu502Lys | p.E502K | Q8TE73 | protein_coding | deleterious(0) | possibly_damaging(0.728) | TCGA-AN-A046-01 | Breast | breast invasive carcinoma | Female | >=65 | I/II | Unknown | Unknown | SD | |
| DNAH5 | SNV | Missense_Mutation | c.878N>T | p.Arg293Ile | p.R293I | Q8TE73 | protein_coding | deleterious(0.03) | probably_damaging(0.976) | TCGA-AN-A046-01 | Breast | breast invasive carcinoma | Female | >=65 | I/II | Unknown | Unknown | SD |
| Page: 1 2 3 4 5 6 7 8 9 10 11 12 13 14 15 16 17 18 19 20 21 22 23 24 25 26 27 28 29 30 31 32 33 34 35 36 37 38 39 40 41 42 43 44 45 46 47 48 49 50 51 52 53 54 55 56 57 58 59 60 61 62 63 64 65 66 67 68 69 70 71 72 73 74 75 76 77 78 79 80 81 82 83 |
Top |
Related drugs of malignant transformation related genes |
| Identification of chemicals and drugs interact with genes involved in malignant transfromation |
| (DGIdb 4.0) |
| Entrez ID | Symbol | Category | Interaction Types | Drug Claim Name | Drug Name | PMIDs |
| Page: 1 |

Copyright 2023-Present -The University of Texas Health Science Center at Houston |