
|
|||||
|
 | |
| |
| |
| |
| |
| |
|
Gene: DNAAF4 |
Gene summary for DNAAF4 |
| Gene information | Species | Human | Gene symbol | DNAAF4 | Gene ID | 161582 |
| Gene name | dynein axonemal assembly factor 4 | |
| Gene Alias | CILD25 | |
| Cytomap | 15q21.3 | |
| Gene Type | protein-coding | GO ID | GO:0000226 | UniProtAcc | Q8WXU2 |
Top |
Malignant transformation analysis |
| Identification of the aberrant gene expression in precancerous and cancerous lesions by comparing the gene expression of stem-like cells in diseased tissues with normal stem cells |
| Entrez ID | Symbol | Replicates | Species | Organ | Tissue | Adj P-value | Log2FC | Malignancy |
| 161582 | DNAAF4 | RNA-P24T2-P24T2-2 | Human | Lung | IAC | 2.30e-04 | 1.00e+00 | 0.0057 |
| 161582 | DNAAF4 | RNA-P6T1-P6T1-4 | Human | Lung | MIAC | 2.24e-04 | 6.52e-01 | -0.0263 |
| 161582 | DNAAF4 | RNA-P6T2-P6T2-1 | Human | Lung | IAC | 1.51e-02 | 1.80e-01 | -0.0166 |
| 161582 | DNAAF4 | RNA-P6T2-P6T2-2 | Human | Lung | IAC | 1.06e-02 | 1.73e-01 | -0.0132 |
| 161582 | DNAAF4 | RNA-P6T2-P6T2-3 | Human | Lung | IAC | 4.32e-03 | 1.96e-01 | -0.013 |
| 161582 | DNAAF4 | PTC01 | Human | Thyroid | PTC | 2.61e-10 | 2.04e-01 | 0.1899 |
| 161582 | DNAAF4 | PTC03 | Human | Thyroid | PTC | 9.50e-07 | 2.71e-01 | 0.1784 |
| 161582 | DNAAF4 | PTC04 | Human | Thyroid | PTC | 5.96e-08 | 1.48e-01 | 0.1927 |
| 161582 | DNAAF4 | PTC05 | Human | Thyroid | PTC | 6.87e-11 | 3.66e-01 | 0.2065 |
| 161582 | DNAAF4 | PTC06 | Human | Thyroid | PTC | 1.13e-17 | 4.23e-01 | 0.2057 |
| 161582 | DNAAF4 | PTC07 | Human | Thyroid | PTC | 6.99e-29 | 4.95e-01 | 0.2044 |
| 161582 | DNAAF4 | ATC11 | Human | Thyroid | ATC | 7.49e-03 | 2.55e-01 | 0.3386 |
| 161582 | DNAAF4 | ATC12 | Human | Thyroid | ATC | 5.14e-03 | 9.59e-02 | 0.34 |
| 161582 | DNAAF4 | ATC13 | Human | Thyroid | ATC | 1.28e-06 | 1.52e-01 | 0.34 |
| 161582 | DNAAF4 | ATC3 | Human | Thyroid | ATC | 6.22e-03 | 2.13e-01 | 0.338 |
| 161582 | DNAAF4 | ATC4 | Human | Thyroid | ATC | 1.21e-03 | 1.15e-01 | 0.34 |
| 161582 | DNAAF4 | ATC5 | Human | Thyroid | ATC | 1.28e-06 | 1.62e-01 | 0.34 |
| Page: 1 |
| Tissue | Expression Dynamics | Abbreviation |
| Lung | 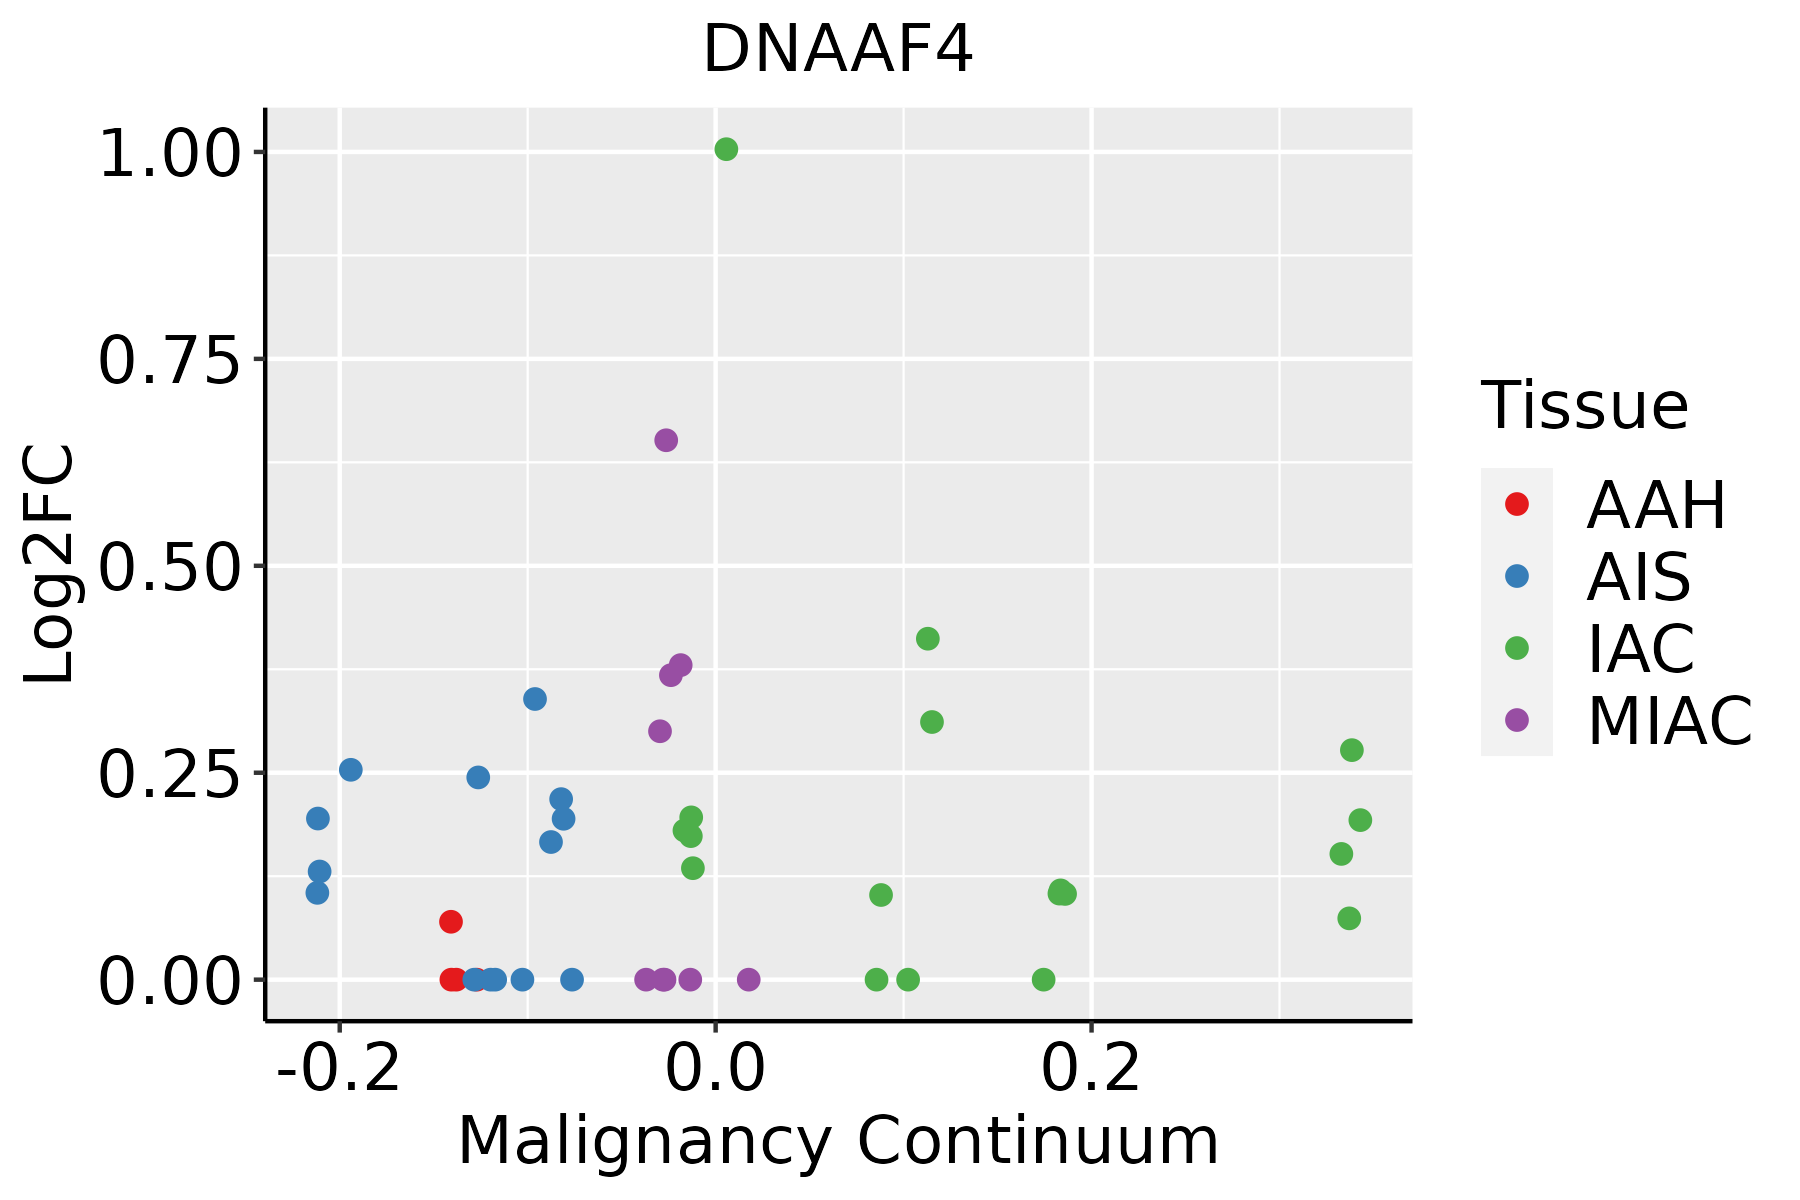 | AAH: Atypical adenomatous hyperplasia |
| AIS: Adenocarcinoma in situ | ||
| IAC: Invasive lung adenocarcinoma | ||
| MIA: Minimally invasive adenocarcinoma | ||
| Thyroid | 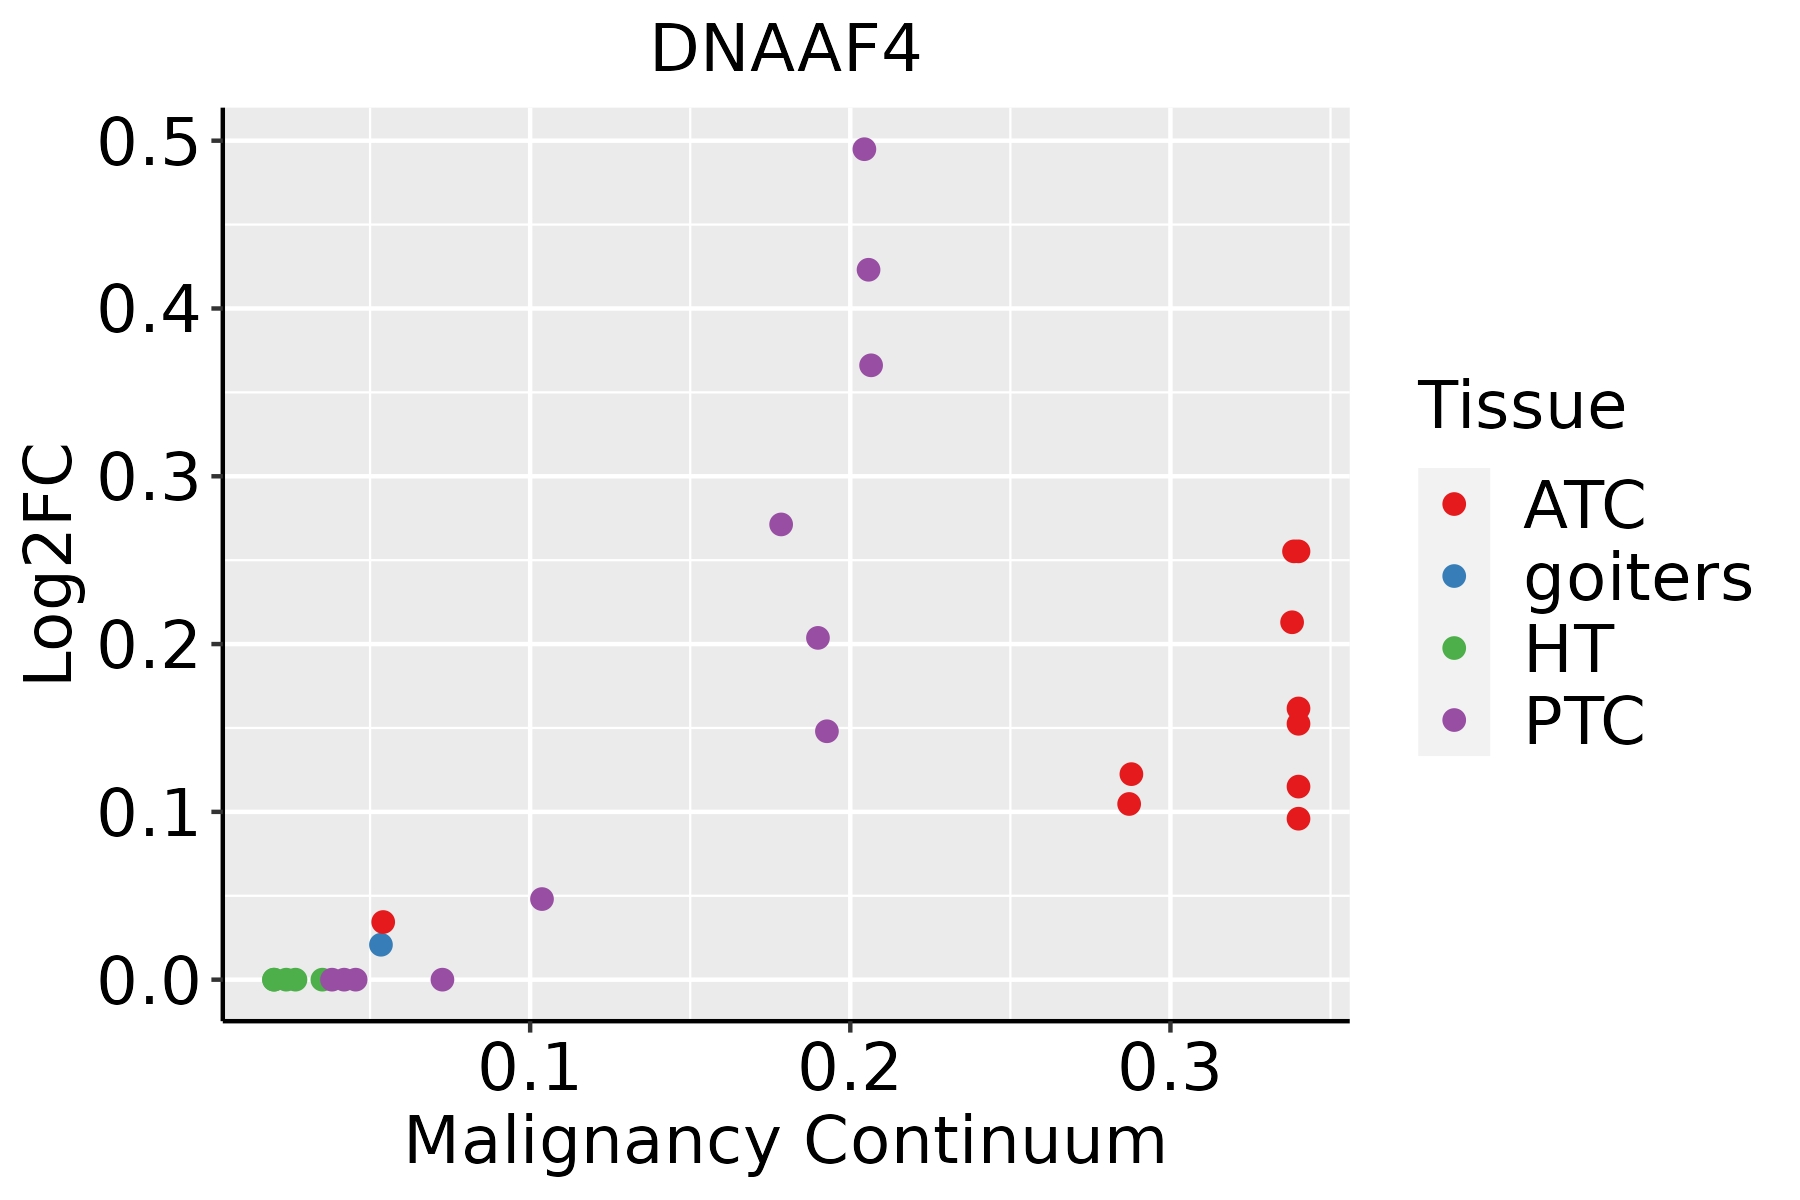 | ATC: Anaplastic thyroid cancer |
| HT: Hashimoto's thyroiditis | ||
| PTC: Papillary thyroid cancer |
| ∗log2FC in expression of this searched gene in stem-like cells from each diseased tissue sample relative to stem-like cells in normal samples in each tissue plotted against the malignancy continuum. Samples are colored based on if they are from different disease stage. |
Top |
Malignant transformation related pathway analysis |
| Find out the enriched GO biological processes and KEGG pathways involved in transition from healthy to precancer to cancer |
| Tissue | Disease Stage | Enriched GO biological Processes |
| Colorectum | AD |  |
| Colorectum | SER |  |
| Colorectum | MSS |  |
| Colorectum | MSI-H |  |
| Colorectum | FAP |  |
| ∗Top 15 enriched GO BP terms are showed in the bar plot of each disease state in each tissue. Each row represents a significant GO biological process which is colored according to the -log10(p.adjust). |
| Page: 1 2 3 4 5 6 7 8 9 |
| GO ID | Tissue | Disease Stage | Description | Gene Ratio | Bg Ratio | pvalue | p.adjust | Count |
| GO:00421768 | Lung | IAC | regulation of protein catabolic process | 97/2061 | 391/18723 | 6.32e-15 | 1.25e-11 | 97 |
| GO:19033628 | Lung | IAC | regulation of cellular protein catabolic process | 63/2061 | 255/18723 | 4.30e-10 | 9.45e-08 | 63 |
| GO:19030508 | Lung | IAC | regulation of proteolysis involved in cellular protein catabolic process | 52/2061 | 221/18723 | 7.90e-08 | 7.95e-06 | 52 |
| GO:00305227 | Lung | IAC | intracellular receptor signaling pathway | 59/2061 | 265/18723 | 8.88e-08 | 8.50e-06 | 59 |
| GO:00485458 | Lung | IAC | response to steroid hormone | 69/2061 | 339/18723 | 2.99e-07 | 2.34e-05 | 69 |
| GO:00713837 | Lung | IAC | cellular response to steroid hormone stimulus | 47/2061 | 204/18723 | 6.27e-07 | 3.72e-05 | 47 |
| GO:00104988 | Lung | IAC | proteasomal protein catabolic process | 90/2061 | 490/18723 | 6.69e-07 | 3.89e-05 | 90 |
| GO:00305186 | Lung | IAC | intracellular steroid hormone receptor signaling pathway | 30/2061 | 116/18723 | 5.77e-06 | 2.18e-04 | 30 |
| GO:00611368 | Lung | IAC | regulation of proteasomal protein catabolic process | 40/2061 | 187/18723 | 2.71e-05 | 7.24e-04 | 40 |
| GO:00434017 | Lung | IAC | steroid hormone mediated signaling pathway | 31/2061 | 136/18723 | 6.00e-05 | 1.31e-03 | 31 |
| GO:00331434 | Lung | IAC | regulation of intracellular steroid hormone receptor signaling pathway | 19/2061 | 74/18723 | 3.15e-04 | 4.98e-03 | 19 |
| GO:0001764 | Lung | IAC | neuron migration | 31/2061 | 156/18723 | 7.89e-04 | 1.02e-02 | 31 |
| GO:00097557 | Lung | IAC | hormone-mediated signaling pathway | 36/2061 | 190/18723 | 7.95e-04 | 1.02e-02 | 36 |
| GO:0099111 | Lung | IAC | microtubule-based transport | 35/2061 | 190/18723 | 1.55e-03 | 1.64e-02 | 35 |
| GO:0060271 | Lung | IAC | cilium assembly | 55/2061 | 337/18723 | 1.84e-03 | 1.88e-02 | 55 |
| GO:0044782 | Lung | IAC | cilium organization | 58/2061 | 368/18723 | 3.15e-03 | 2.75e-02 | 58 |
| GO:00305204 | Lung | IAC | intracellular estrogen receptor signaling pathway | 13/2061 | 54/18723 | 4.89e-03 | 3.78e-02 | 13 |
| GO:004217633 | Lung | MIAC | regulation of protein catabolic process | 47/967 | 391/18723 | 6.27e-08 | 2.15e-05 | 47 |
| GO:190336233 | Lung | MIAC | regulation of cellular protein catabolic process | 34/967 | 255/18723 | 3.83e-07 | 6.52e-05 | 34 |
| GO:190305033 | Lung | MIAC | regulation of proteolysis involved in cellular protein catabolic process | 28/967 | 221/18723 | 1.07e-05 | 8.86e-04 | 28 |
| Page: 1 2 3 |
| Pathway ID | Tissue | Disease Stage | Description | Gene Ratio | Bg Ratio | pvalue | p.adjust | qvalue | Count |
| Page: 1 |
Top |
Cell-cell communication analysis |
| Identification of potential cell-cell interactions between two cell types and their ligand-receptor pairs for different disease states |
| Ligand | Receptor | LRpair | Pathway | Tissue | Disease Stage |
| Page: 1 |
Top |
Single-cell gene regulatory network inference analysis |
| Find out the significant the regulons (TFs) and the target genes of each regulon across cell types for different disease states |
| TF | Cell Type | Tissue | Disease Stage | Target Gene | RSS | Regulon Activity |
| ∗The dot plots of a searched regulon are shown for all cell subpopulations in each disease state of each tissue based on the regulon specific score inferred using pySCENIC and by calculating the average expression. |
| Page: 1 |
Top |
Somatic mutation of malignant transformation related genes |
| Annotation of somatic variants for genes involved in malignant transformation |
| Hugo Symbol | Variant Class | Variant Classification | dbSNP RS | HGVSc | HGVSp | HGVSp Short | SWISSPROT | BIOTYPE | SIFT | PolyPhen | Tumor Sample Barcode | Tissue | Histology | Sex | Age | Stage | Therapy Types | Drugs | Outcome |
| Page: 1 |
Top |
Related drugs of malignant transformation related genes |
| Identification of chemicals and drugs interact with genes involved in malignant transfromation |
| (DGIdb 4.0) |
| Entrez ID | Symbol | Category | Interaction Types | Drug Claim Name | Drug Name | PMIDs |
| Page: 1 |

Copyright 2023-Present -The University of Texas Health Science Center at Houston |