
|
|||||
|
 | |
| |
| |
| |
| |
| |
|
Gene: DNAAF2 |
Gene summary for DNAAF2 |
| Gene information | Species | Human | Gene symbol | DNAAF2 | Gene ID | 55172 |
| Gene name | dynein axonemal assembly factor 2 | |
| Gene Alias | C14orf104 | |
| Cytomap | 14q21.3 | |
| Gene Type | protein-coding | GO ID | GO:0000226 | UniProtAcc | Q9NVR5 |
Top |
Malignant transformation analysis |
| Identification of the aberrant gene expression in precancerous and cancerous lesions by comparing the gene expression of stem-like cells in diseased tissues with normal stem cells |
| Entrez ID | Symbol | Replicates | Species | Organ | Tissue | Adj P-value | Log2FC | Malignancy |
| 55172 | DNAAF2 | LZE2T | Human | Esophagus | ESCC | 7.45e-04 | 5.92e-01 | 0.082 |
| 55172 | DNAAF2 | LZE4T | Human | Esophagus | ESCC | 3.31e-11 | 3.54e-01 | 0.0811 |
| 55172 | DNAAF2 | LZE7T | Human | Esophagus | ESCC | 2.25e-06 | 2.48e-01 | 0.0667 |
| 55172 | DNAAF2 | LZE20T | Human | Esophagus | ESCC | 4.19e-06 | 2.09e-01 | 0.0662 |
| 55172 | DNAAF2 | LZE24T | Human | Esophagus | ESCC | 5.81e-08 | 4.31e-01 | 0.0596 |
| 55172 | DNAAF2 | LZE6T | Human | Esophagus | ESCC | 8.52e-06 | 2.37e-01 | 0.0845 |
| 55172 | DNAAF2 | P2T-E | Human | Esophagus | ESCC | 2.76e-33 | 6.32e-01 | 0.1177 |
| 55172 | DNAAF2 | P4T-E | Human | Esophagus | ESCC | 2.17e-38 | 9.73e-01 | 0.1323 |
| 55172 | DNAAF2 | P5T-E | Human | Esophagus | ESCC | 1.97e-33 | 8.18e-01 | 0.1327 |
| 55172 | DNAAF2 | P8T-E | Human | Esophagus | ESCC | 9.87e-14 | 2.86e-01 | 0.0889 |
| 55172 | DNAAF2 | P9T-E | Human | Esophagus | ESCC | 7.44e-09 | 3.43e-01 | 0.1131 |
| 55172 | DNAAF2 | P10T-E | Human | Esophagus | ESCC | 5.40e-37 | 7.45e-01 | 0.116 |
| 55172 | DNAAF2 | P11T-E | Human | Esophagus | ESCC | 4.05e-13 | 4.70e-01 | 0.1426 |
| 55172 | DNAAF2 | P12T-E | Human | Esophagus | ESCC | 2.95e-39 | 7.22e-01 | 0.1122 |
| 55172 | DNAAF2 | P15T-E | Human | Esophagus | ESCC | 4.75e-31 | 7.38e-01 | 0.1149 |
| 55172 | DNAAF2 | P16T-E | Human | Esophagus | ESCC | 1.22e-25 | 5.57e-01 | 0.1153 |
| 55172 | DNAAF2 | P17T-E | Human | Esophagus | ESCC | 4.05e-13 | 4.31e-01 | 0.1278 |
| 55172 | DNAAF2 | P19T-E | Human | Esophagus | ESCC | 5.97e-05 | 5.20e-01 | 0.1662 |
| 55172 | DNAAF2 | P20T-E | Human | Esophagus | ESCC | 4.37e-24 | 4.91e-01 | 0.1124 |
| 55172 | DNAAF2 | P21T-E | Human | Esophagus | ESCC | 2.88e-20 | 3.58e-01 | 0.1617 |
| Page: 1 2 3 4 5 |
| Tissue | Expression Dynamics | Abbreviation |
| Esophagus | 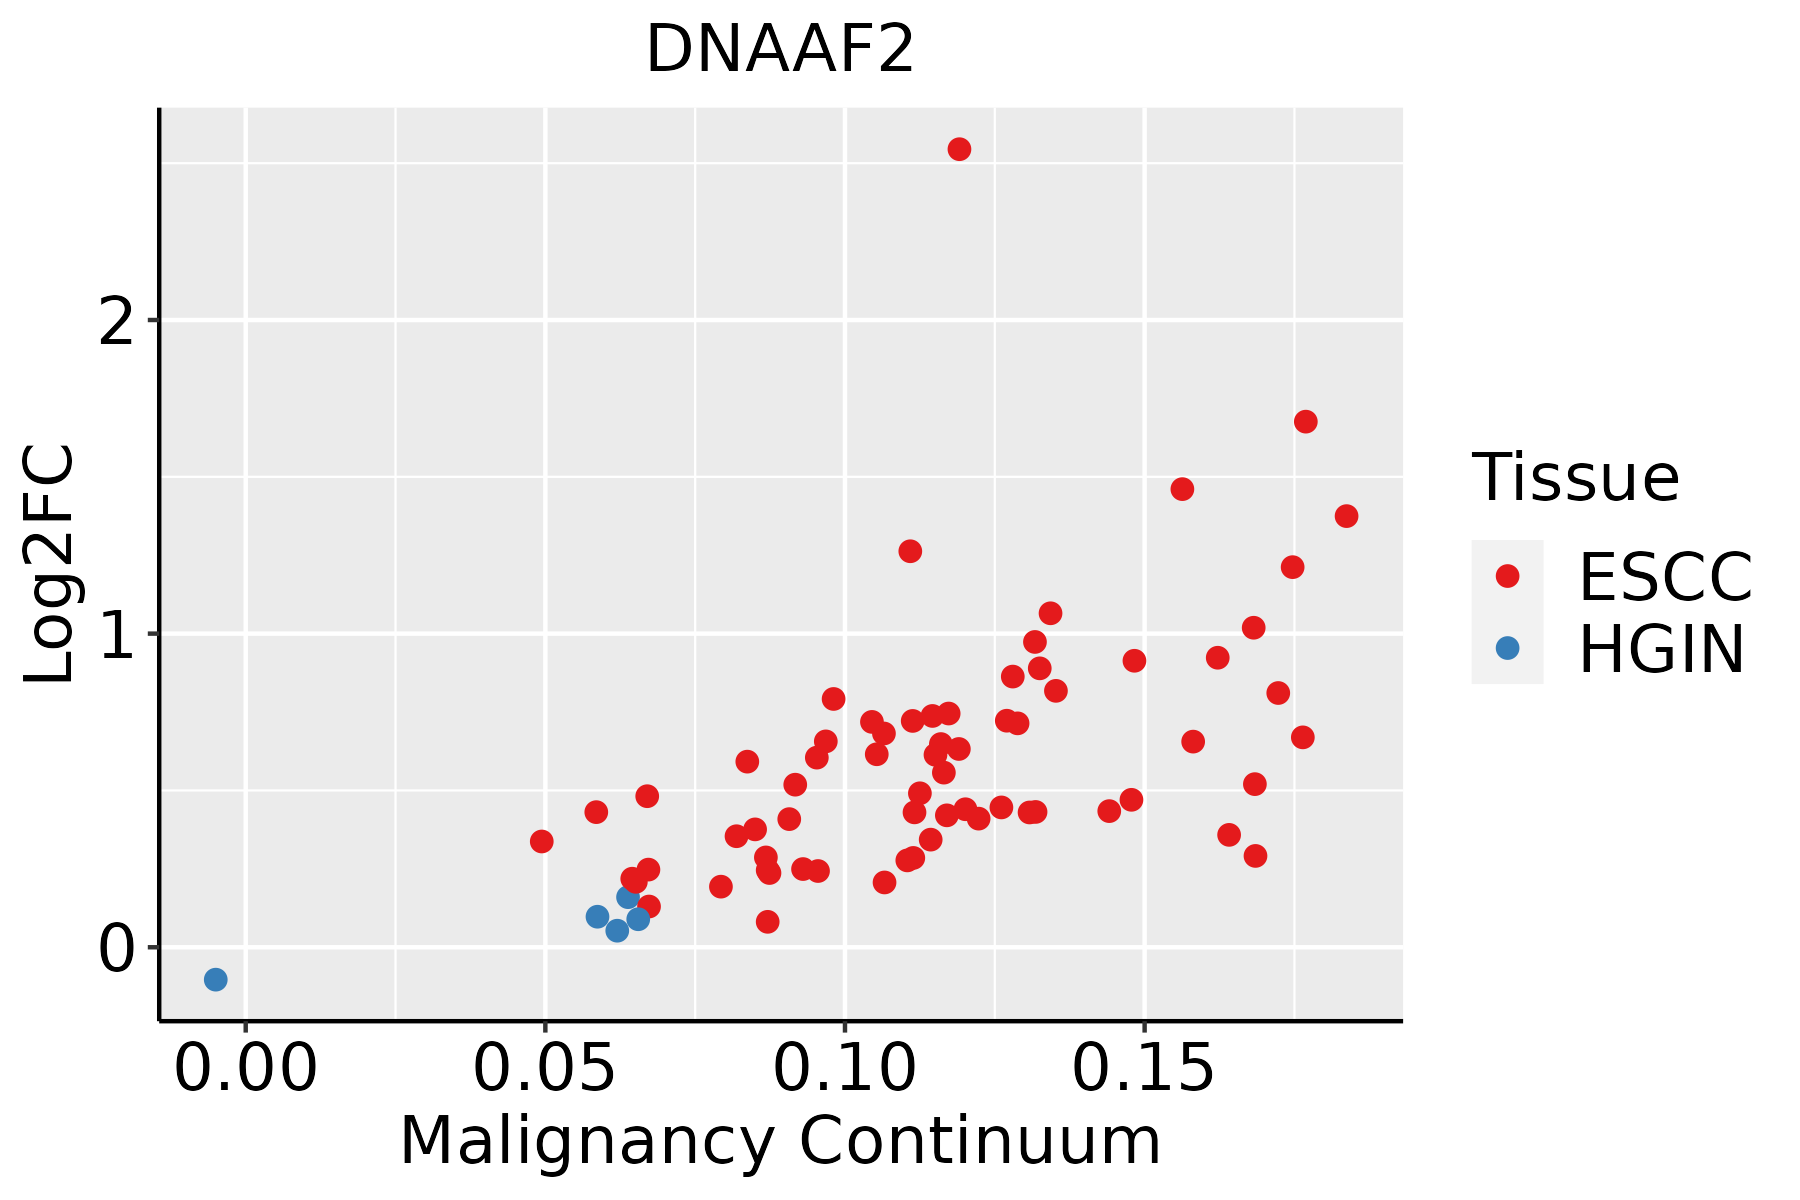 | ESCC: Esophageal squamous cell carcinoma |
| HGIN: High-grade intraepithelial neoplasias | ||
| LGIN: Low-grade intraepithelial neoplasias | ||
| Liver | 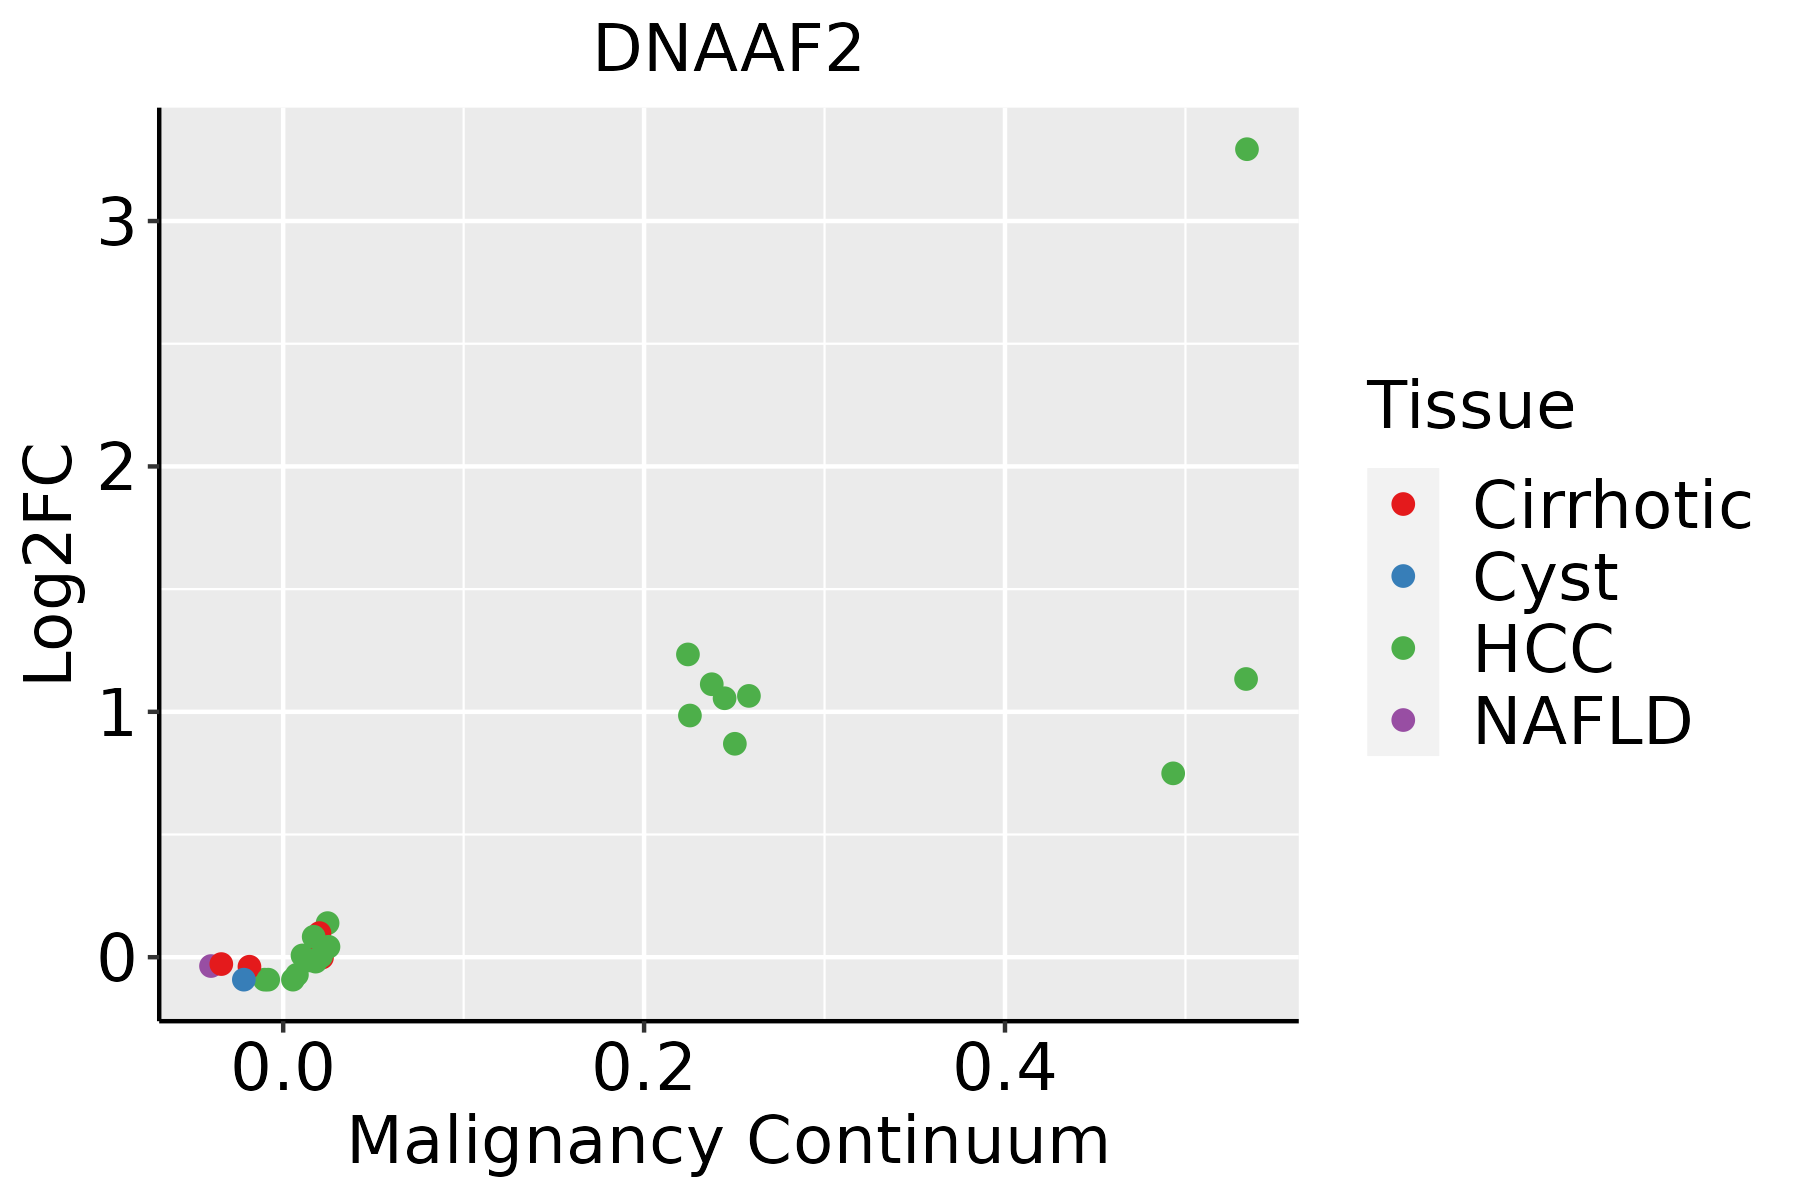 | HCC: Hepatocellular carcinoma |
| NAFLD: Non-alcoholic fatty liver disease | ||
| Oral Cavity | 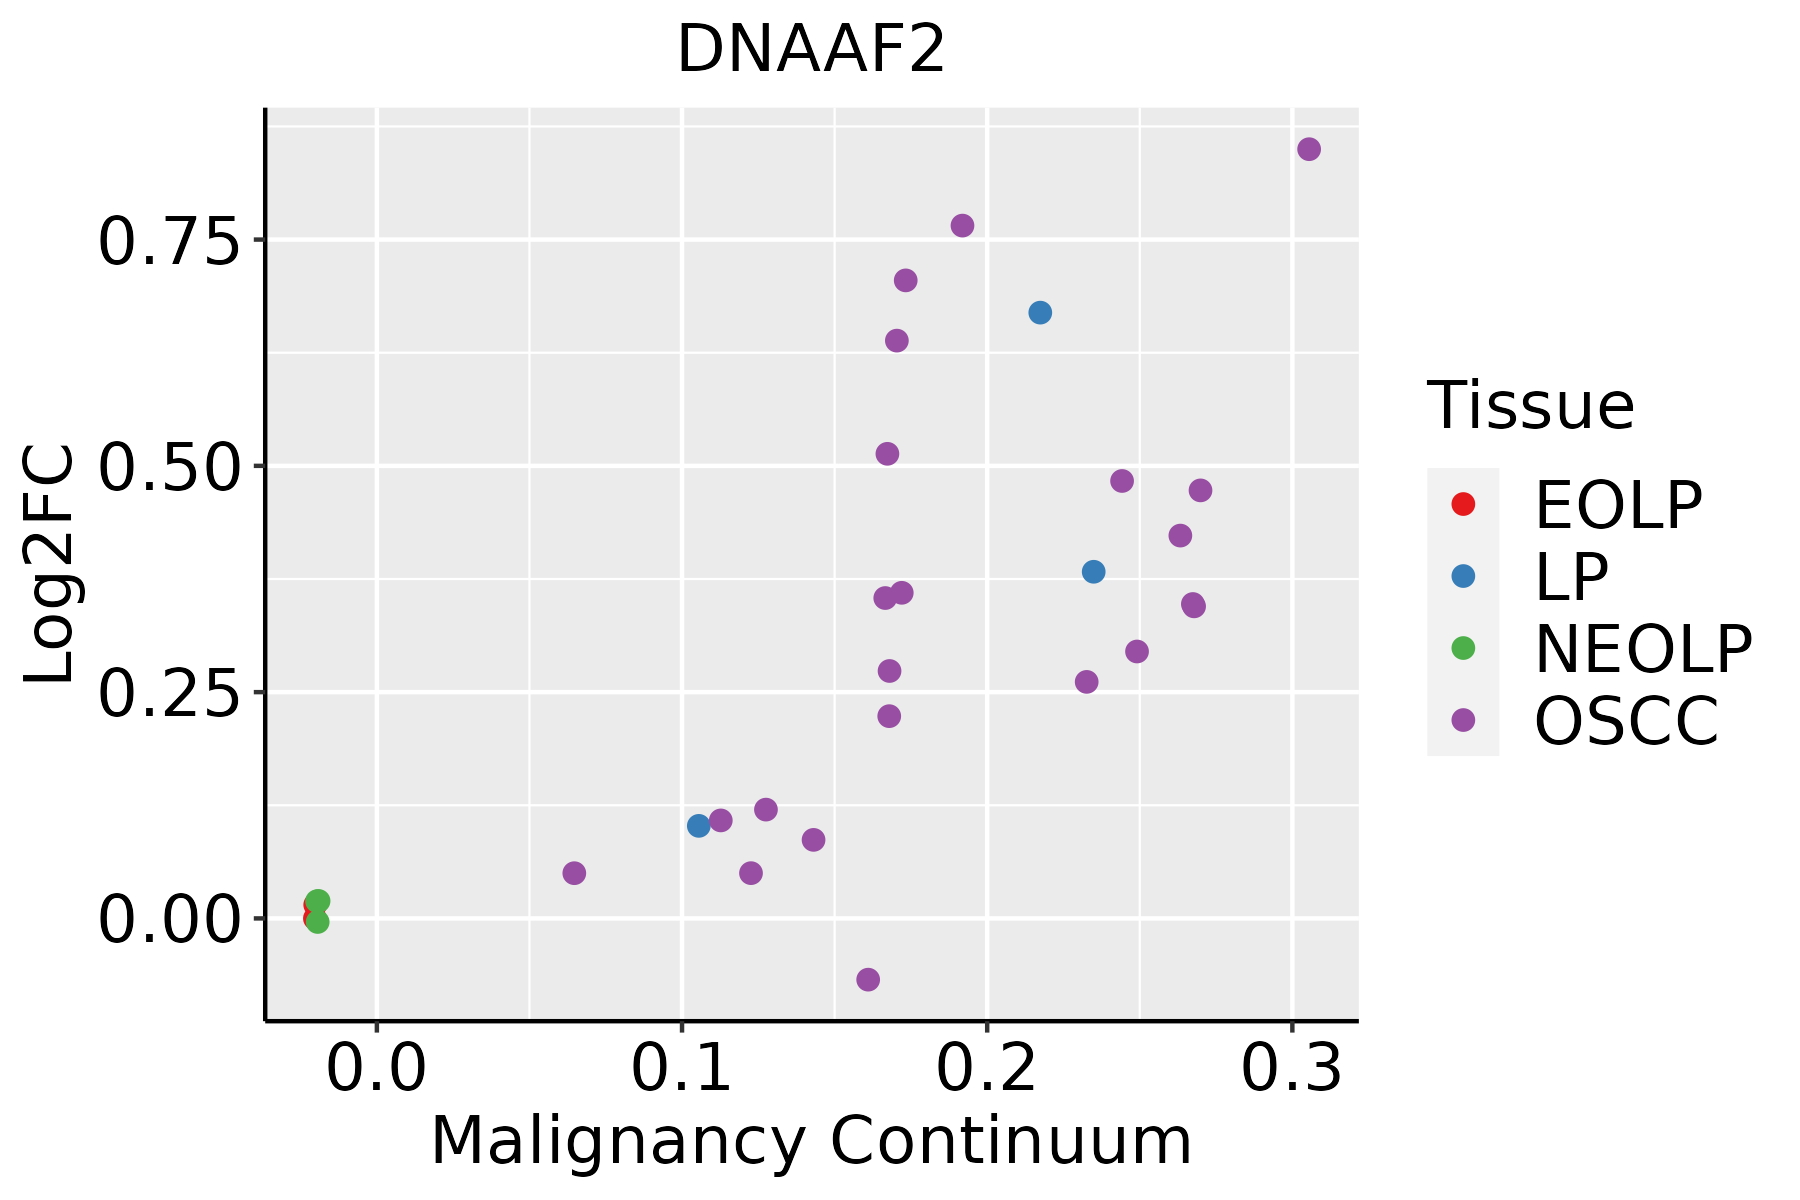 | EOLP: Erosive Oral lichen planus |
| LP: leukoplakia | ||
| NEOLP: Non-erosive oral lichen planus | ||
| OSCC: Oral squamous cell carcinoma | ||
| Skin | 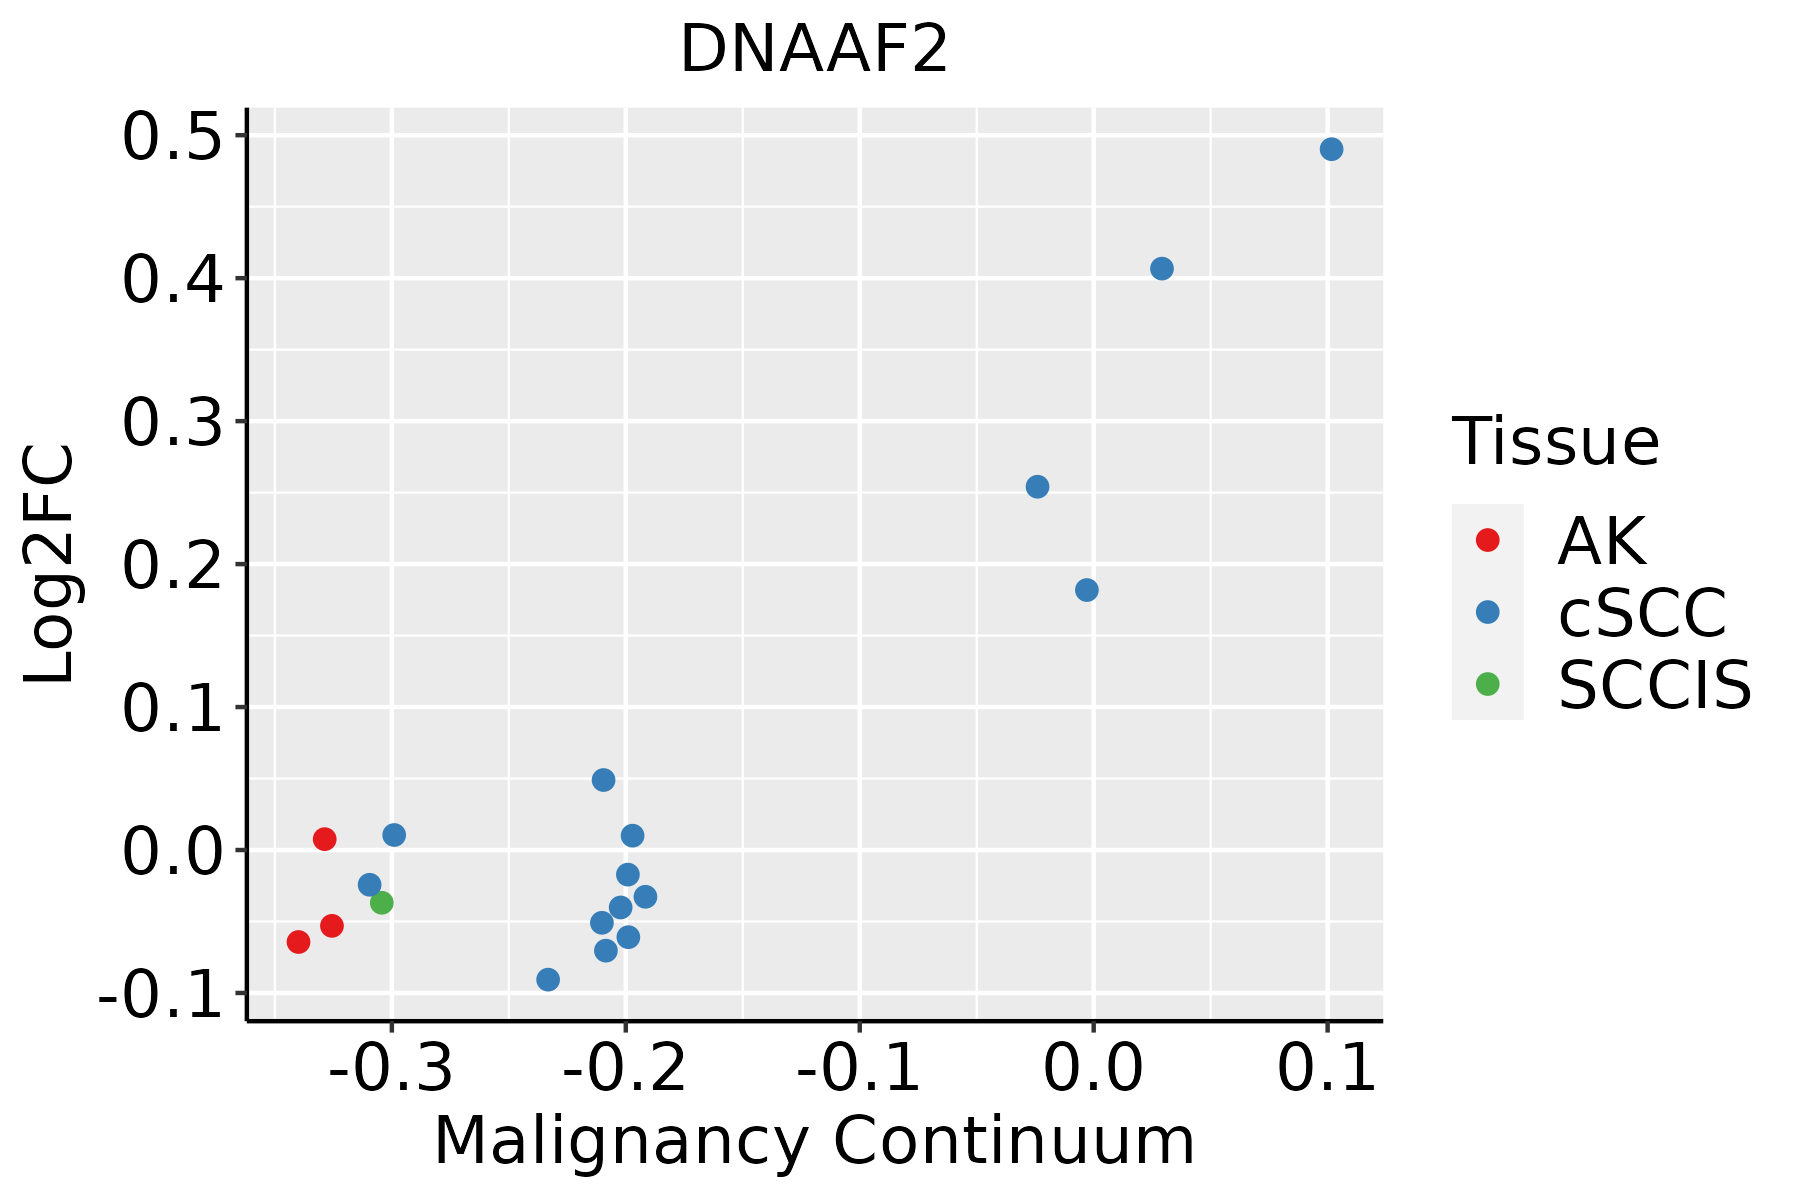 | AK: Actinic keratosis |
| cSCC: Cutaneous squamous cell carcinoma | ||
| SCCIS:squamous cell carcinoma in situ |
| ∗log2FC in expression of this searched gene in stem-like cells from each diseased tissue sample relative to stem-like cells in normal samples in each tissue plotted against the malignancy continuum. Samples are colored based on if they are from different disease stage. |
Top |
Malignant transformation related pathway analysis |
| Find out the enriched GO biological processes and KEGG pathways involved in transition from healthy to precancer to cancer |
| Tissue | Disease Stage | Enriched GO biological Processes |
| Colorectum | AD |  |
| Colorectum | SER |  |
| Colorectum | MSS |  |
| Colorectum | MSI-H |  |
| Colorectum | FAP |  |
| ∗Top 15 enriched GO BP terms are showed in the bar plot of each disease state in each tissue. Each row represents a significant GO biological process which is colored according to the -log10(p.adjust). |
| Page: 1 2 3 4 5 6 7 8 9 |
| GO ID | Tissue | Disease Stage | Description | Gene Ratio | Bg Ratio | pvalue | p.adjust | Count |
| GO:000170119 | Esophagus | ESCC | in utero embryonic development | 243/8552 | 367/18723 | 1.00e-15 | 6.86e-14 | 243 |
| GO:00991114 | Esophagus | ESCC | microtubule-based transport | 115/8552 | 190/18723 | 2.54e-05 | 2.15e-04 | 115 |
| GO:00325261 | Esophagus | ESCC | response to retinoic acid | 63/8552 | 107/18723 | 4.05e-03 | 1.62e-02 | 63 |
| GO:00017015 | Liver | Cirrhotic | in utero embryonic development | 134/4634 | 367/18723 | 2.78e-07 | 6.86e-06 | 134 |
| GO:000170111 | Liver | HCC | in utero embryonic development | 204/7958 | 367/18723 | 2.44e-07 | 4.30e-06 | 204 |
| GO:000170116 | Oral cavity | OSCC | in utero embryonic development | 207/7305 | 367/18723 | 7.92e-12 | 2.95e-10 | 207 |
| GO:00991113 | Oral cavity | OSCC | microtubule-based transport | 96/7305 | 190/18723 | 7.92e-04 | 4.27e-03 | 96 |
| GO:0032526 | Oral cavity | OSCC | response to retinoic acid | 54/7305 | 107/18723 | 1.04e-02 | 3.54e-02 | 54 |
| GO:000170117 | Oral cavity | LP | in utero embryonic development | 142/4623 | 367/18723 | 1.48e-09 | 6.75e-08 | 142 |
| GO:000170124 | Skin | cSCC | in utero embryonic development | 150/4864 | 367/18723 | 2.47e-10 | 1.04e-08 | 150 |
| Page: 1 |
| Pathway ID | Tissue | Disease Stage | Description | Gene Ratio | Bg Ratio | pvalue | p.adjust | qvalue | Count |
| Page: 1 |
Top |
Cell-cell communication analysis |
| Identification of potential cell-cell interactions between two cell types and their ligand-receptor pairs for different disease states |
| Ligand | Receptor | LRpair | Pathway | Tissue | Disease Stage |
| Page: 1 |
Top |
Single-cell gene regulatory network inference analysis |
| Find out the significant the regulons (TFs) and the target genes of each regulon across cell types for different disease states |
| TF | Cell Type | Tissue | Disease Stage | Target Gene | RSS | Regulon Activity |
| ∗The dot plots of a searched regulon are shown for all cell subpopulations in each disease state of each tissue based on the regulon specific score inferred using pySCENIC and by calculating the average expression. |
| Page: 1 |
Top |
Somatic mutation of malignant transformation related genes |
| Annotation of somatic variants for genes involved in malignant transformation |
| Hugo Symbol | Variant Class | Variant Classification | dbSNP RS | HGVSc | HGVSp | HGVSp Short | SWISSPROT | BIOTYPE | SIFT | PolyPhen | Tumor Sample Barcode | Tissue | Histology | Sex | Age | Stage | Therapy Types | Drugs | Outcome |
| DNAAF2 | SNV | Missense_Mutation | c.1993N>G | p.Gln665Glu | p.Q665E | Q9NVR5 | protein_coding | tolerated(0.29) | benign(0) | TCGA-C8-A26Y-01 | Breast | breast invasive carcinoma | Female | >=65 | I/II | Unknown | Unknown | SD | |
| DNAAF2 | insertion | Nonsense_Mutation | novel | c.1911_1912insTGCTAGGATTACAGGCATGAGCCACC | p.Val638CysfsTer2 | p.V638Cfs*2 | Q9NVR5 | protein_coding | TCGA-BH-A0EE-01 | Breast | breast invasive carcinoma | Female | >=65 | I/II | Chemotherapy | docetaxel | SD | ||
| DNAAF2 | SNV | Missense_Mutation | rs137853191 | c.23N>T | p.Ser8Leu | p.S8L | Q9NVR5 | protein_coding | deleterious(0) | probably_damaging(0.975) | TCGA-EK-A2PG-01 | Cervix | cervical & endocervical cancer | Female | >=65 | I/II | Unknown | Unknown | SD |
| DNAAF2 | SNV | Missense_Mutation | rs746751400 | c.1772N>T | p.Ser591Leu | p.S591L | Q9NVR5 | protein_coding | tolerated(0.22) | benign(0.006) | TCGA-JW-A5VL-01 | Cervix | cervical & endocervical cancer | Female | <65 | I/II | Unknown | Unknown | SD |
| DNAAF2 | SNV | Missense_Mutation | novel | c.2225N>C | p.Lys742Thr | p.K742T | Q9NVR5 | protein_coding | deleterious(0.01) | benign(0.138) | TCGA-AA-3984-01 | Colorectum | colon adenocarcinoma | Female | <65 | I/II | Unknown | Unknown | SD |
| DNAAF2 | SNV | Missense_Mutation | c.184G>A | p.Glu62Lys | p.E62K | Q9NVR5 | protein_coding | deleterious(0) | benign(0.444) | TCGA-AD-6895-01 | Colorectum | colon adenocarcinoma | Male | >=65 | III/IV | Unknown | Unknown | SD | |
| DNAAF2 | SNV | Missense_Mutation | c.1609N>G | p.Leu537Val | p.L537V | Q9NVR5 | protein_coding | tolerated(0.17) | benign(0.03) | TCGA-AD-6963-01 | Colorectum | colon adenocarcinoma | Male | <65 | I/II | Unknown | Unknown | SD | |
| DNAAF2 | SNV | Missense_Mutation | c.1472G>A | p.Ser491Asn | p.S491N | Q9NVR5 | protein_coding | tolerated(0.68) | benign(0) | TCGA-CM-5861-01 | Colorectum | colon adenocarcinoma | Female | <65 | I/II | Unknown | Unknown | PD | |
| DNAAF2 | SNV | Missense_Mutation | novel | c.2453N>C | p.Lys818Thr | p.K818T | Q9NVR5 | protein_coding | deleterious(0.01) | possibly_damaging(0.738) | TCGA-AG-3892-01 | Colorectum | rectum adenocarcinoma | Female | <65 | I/II | Unknown | Unknown | SD |
| DNAAF2 | SNV | Missense_Mutation | c.1685N>T | p.Ser562Phe | p.S562F | Q9NVR5 | protein_coding | tolerated(0.06) | benign(0.026) | TCGA-G5-6233-01 | Colorectum | rectum adenocarcinoma | Male | >=65 | III/IV | Chemotherapy | 5-fluorouracil | PD |
| Page: 1 2 3 4 5 |
Top |
Related drugs of malignant transformation related genes |
| Identification of chemicals and drugs interact with genes involved in malignant transfromation |
| (DGIdb 4.0) |
| Entrez ID | Symbol | Category | Interaction Types | Drug Claim Name | Drug Name | PMIDs |
| Page: 1 |

Copyright 2023-Present -The University of Texas Health Science Center at Houston |