
|
|||||
|
 | |
| |
| |
| |
| |
| |
|
Gene: DNAAF1 |
Gene summary for DNAAF1 |
| Gene information | Species | Human | Gene symbol | DNAAF1 | Gene ID | 123872 |
| Gene name | dynein axonemal assembly factor 1 | |
| Gene Alias | CILD13 | |
| Cytomap | 16q24.1 | |
| Gene Type | protein-coding | GO ID | GO:0000226 | UniProtAcc | Q8NEP3 |
Top |
Malignant transformation analysis |
| Identification of the aberrant gene expression in precancerous and cancerous lesions by comparing the gene expression of stem-like cells in diseased tissues with normal stem cells |
| Entrez ID | Symbol | Replicates | Species | Organ | Tissue | Adj P-value | Log2FC | Malignancy |
| 123872 | DNAAF1 | ctrl6 | Human | Breast | Precancer | 1.18e-13 | 8.76e-01 | -0.0061 |
| 123872 | DNAAF1 | brca10 | Human | Breast | Precancer | 4.42e-38 | 1.01e+00 | -0.0029 |
| 123872 | DNAAF1 | C09 | Human | Oral cavity | OSCC | 2.11e-13 | 3.82e-01 | 0.1431 |
| 123872 | DNAAF1 | LP15 | Human | Oral cavity | LP | 3.19e-08 | 5.59e-01 | 0.2174 |
| Page: 1 |
| Tissue | Expression Dynamics | Abbreviation |
| Breast | 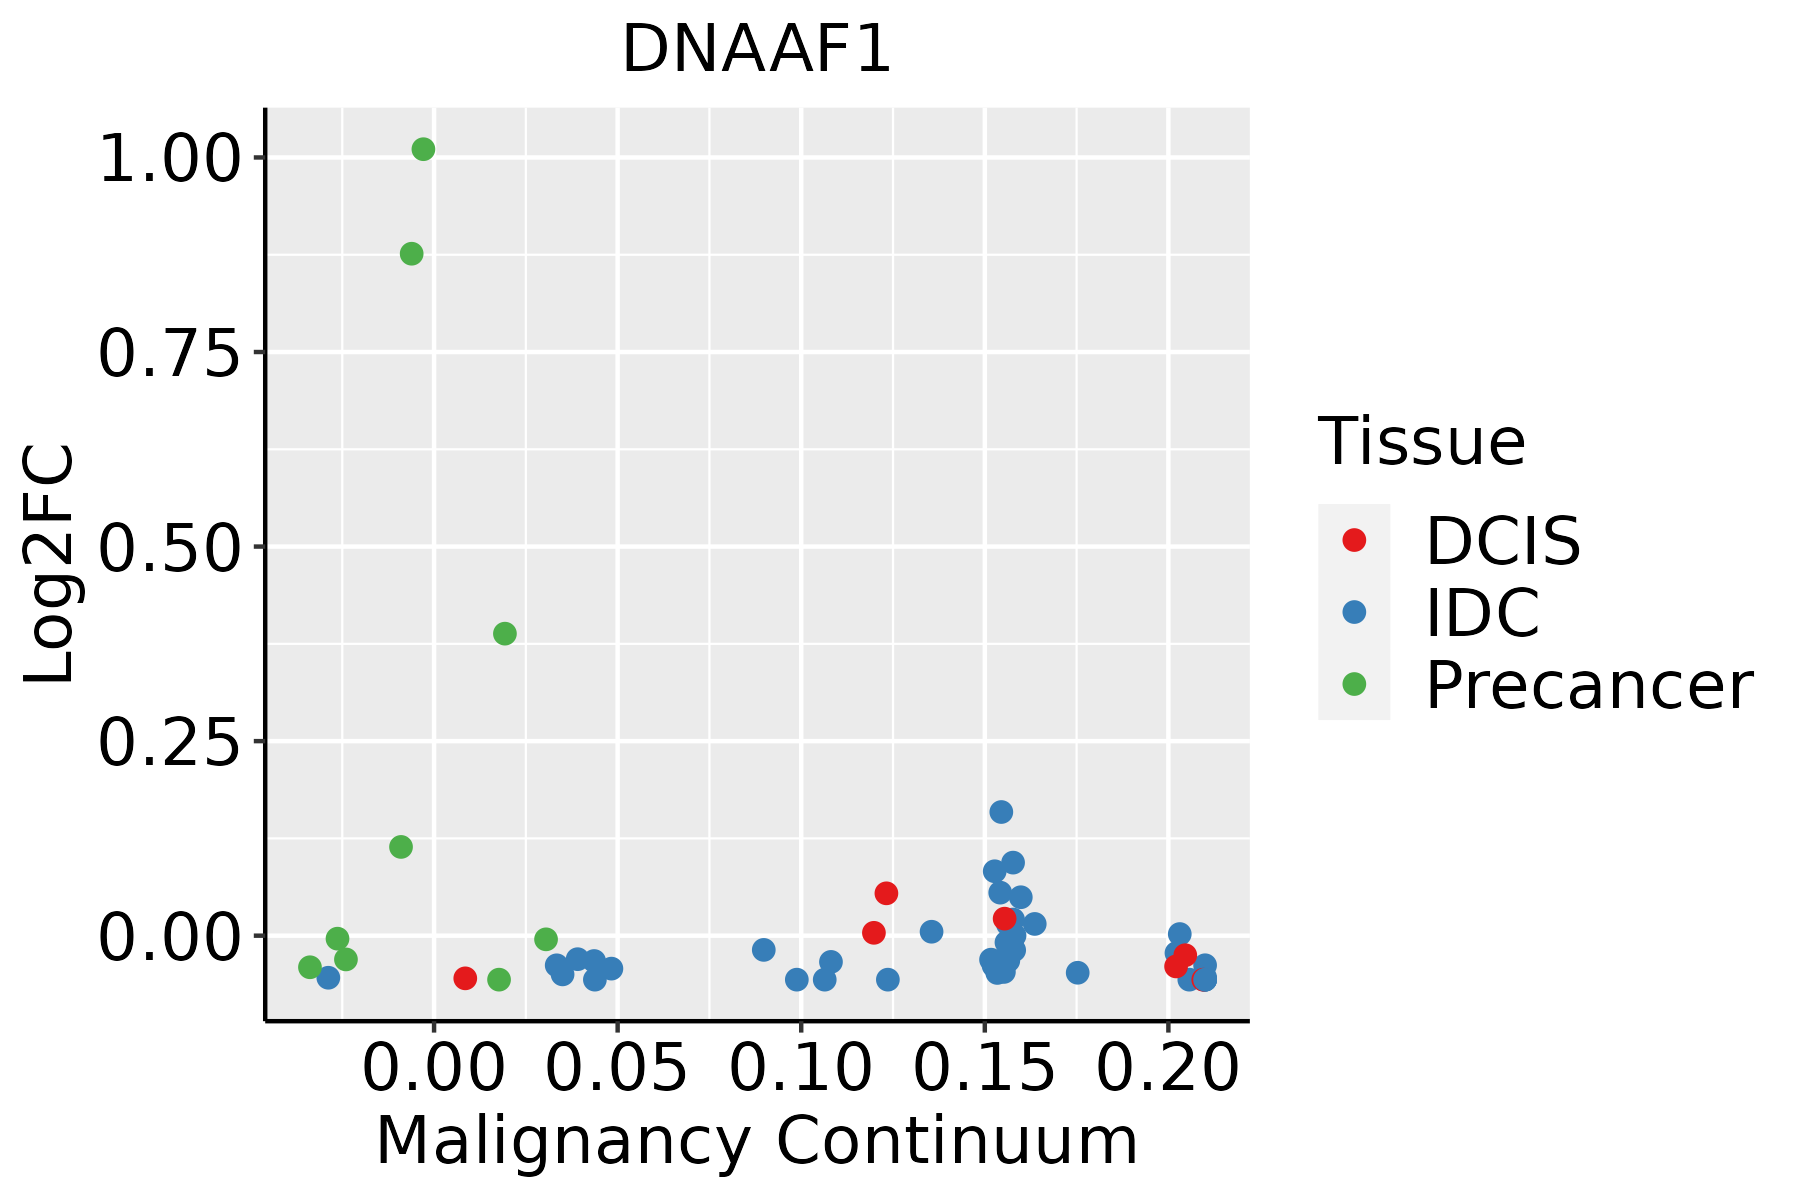 | IDC: Invasive ductal carcinoma |
| DCIS: Ductal carcinoma in situ | ||
| Precancer(BRCA1-mut): Precancerous lesion from BRCA1 mutation carriers | ||
| Oral Cavity | 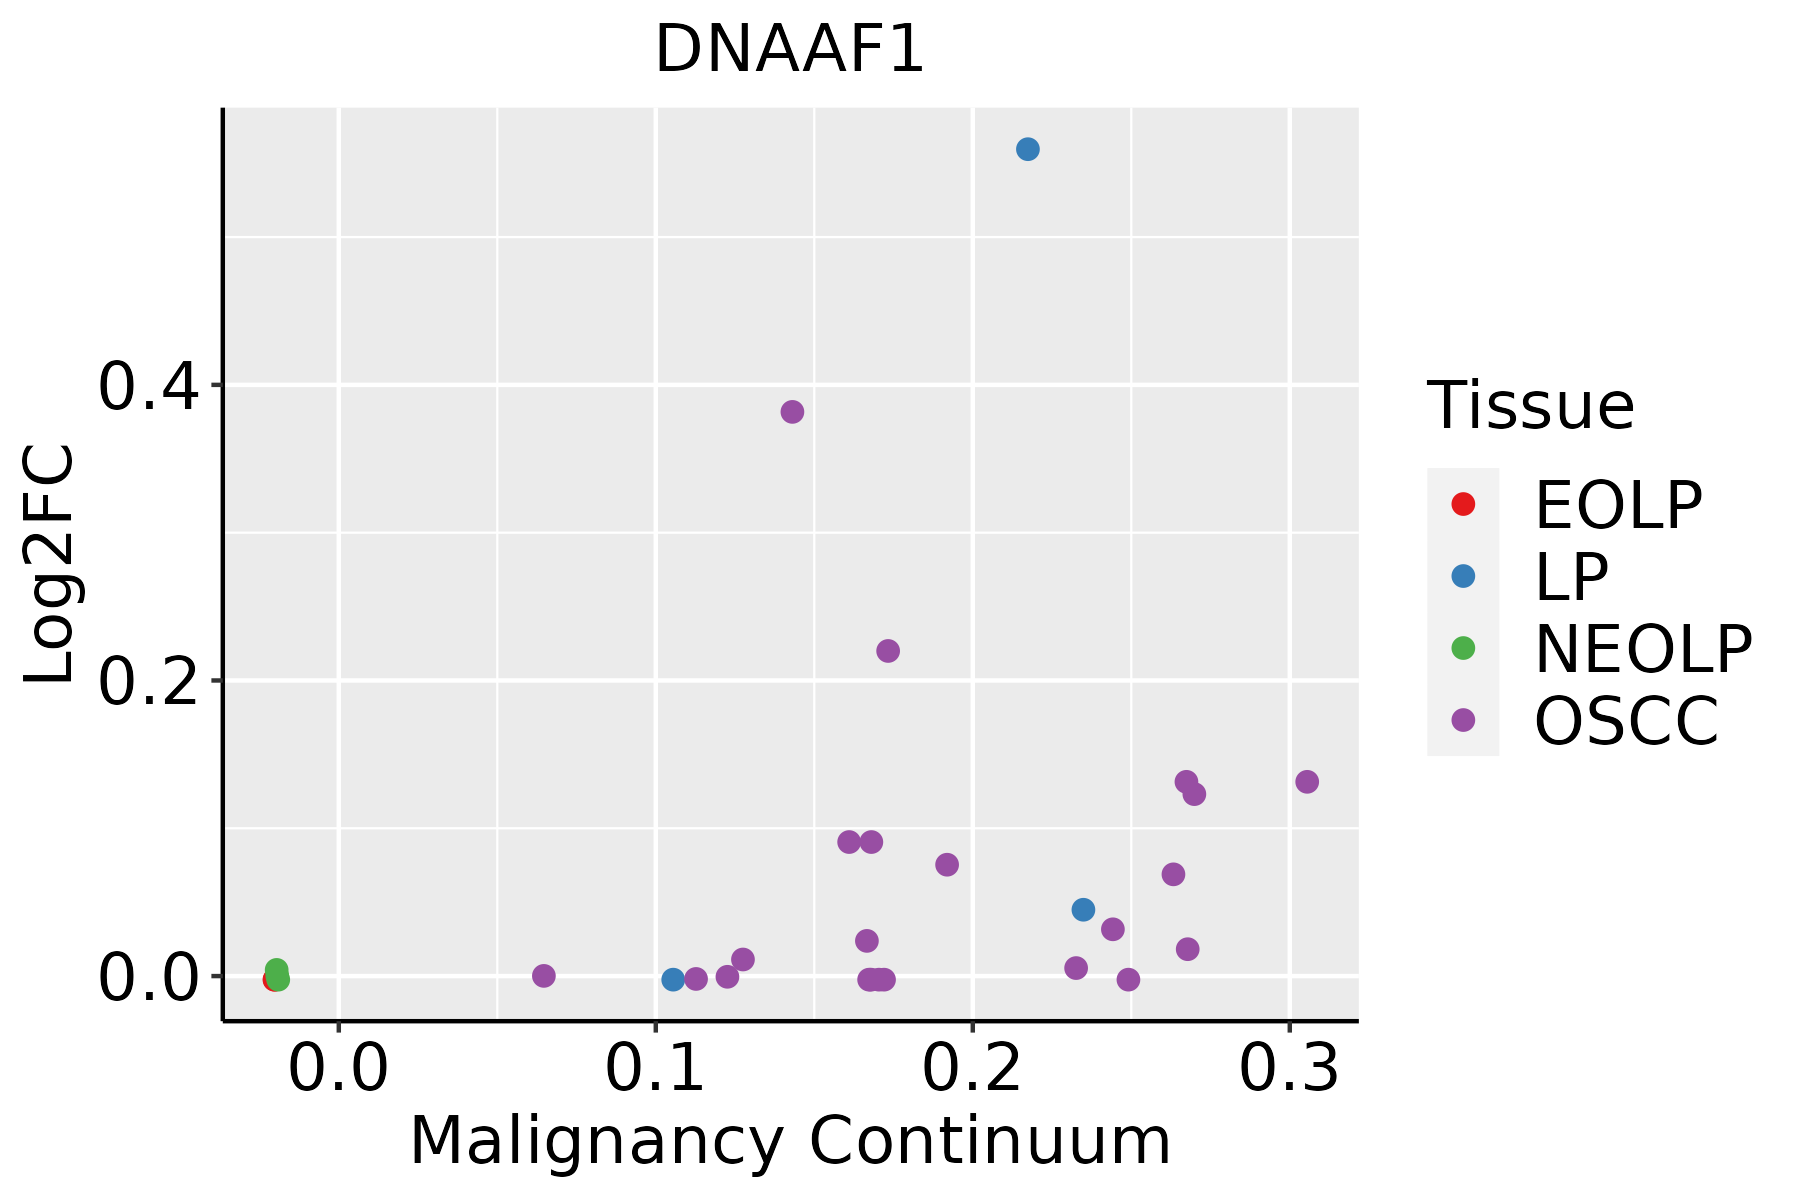 | EOLP: Erosive Oral lichen planus |
| LP: leukoplakia | ||
| NEOLP: Non-erosive oral lichen planus | ||
| OSCC: Oral squamous cell carcinoma |
| ∗log2FC in expression of this searched gene in stem-like cells from each diseased tissue sample relative to stem-like cells in normal samples in each tissue plotted against the malignancy continuum. Samples are colored based on if they are from different disease stage. |
Top |
Malignant transformation related pathway analysis |
| Find out the enriched GO biological processes and KEGG pathways involved in transition from healthy to precancer to cancer |
| Tissue | Disease Stage | Enriched GO biological Processes |
| Colorectum | AD |  |
| Colorectum | SER |  |
| Colorectum | MSS |  |
| Colorectum | MSI-H |  |
| Colorectum | FAP |  |
| ∗Top 15 enriched GO BP terms are showed in the bar plot of each disease state in each tissue. Each row represents a significant GO biological process which is colored according to the -log10(p.adjust). |
| Page: 1 2 3 4 5 6 7 8 9 |
| GO ID | Tissue | Disease Stage | Description | Gene Ratio | Bg Ratio | pvalue | p.adjust | Count |
| GO:00487329 | Breast | Precancer | gland development | 49/1080 | 436/18723 | 6.11e-06 | 1.73e-04 | 49 |
| GO:00018898 | Breast | Precancer | liver development | 21/1080 | 147/18723 | 1.08e-04 | 1.96e-03 | 21 |
| GO:00610088 | Breast | Precancer | hepaticobiliary system development | 21/1080 | 150/18723 | 1.45e-04 | 2.49e-03 | 21 |
| GO:00605625 | Breast | Precancer | epithelial tube morphogenesis | 31/1080 | 325/18723 | 4.21e-03 | 3.31e-02 | 31 |
| GO:004873220 | Oral cavity | OSCC | gland development | 226/7305 | 436/18723 | 2.78e-08 | 5.39e-07 | 226 |
| GO:000188918 | Oral cavity | OSCC | liver development | 87/7305 | 147/18723 | 5.54e-07 | 8.08e-06 | 87 |
| GO:006100818 | Oral cavity | OSCC | hepaticobiliary system development | 88/7305 | 150/18723 | 8.13e-07 | 1.12e-05 | 88 |
| GO:00303238 | Oral cavity | OSCC | respiratory tube development | 95/7305 | 181/18723 | 1.53e-04 | 1.07e-03 | 95 |
| GO:00303248 | Oral cavity | OSCC | lung development | 91/7305 | 177/18723 | 5.18e-04 | 3.01e-03 | 91 |
| GO:00991113 | Oral cavity | OSCC | microtubule-based transport | 96/7305 | 190/18723 | 7.92e-04 | 4.27e-03 | 96 |
| GO:00605416 | Oral cavity | OSCC | respiratory system development | 100/7305 | 203/18723 | 1.83e-03 | 8.60e-03 | 100 |
| GO:00328863 | Oral cavity | OSCC | regulation of microtubule-based process | 115/7305 | 240/18723 | 2.95e-03 | 1.28e-02 | 115 |
| GO:00605629 | Oral cavity | OSCC | epithelial tube morphogenesis | 149/7305 | 325/18723 | 6.73e-03 | 2.50e-02 | 149 |
| GO:000188919 | Oral cavity | LP | liver development | 62/4623 | 147/18723 | 2.32e-06 | 5.14e-05 | 62 |
| GO:0048732110 | Oral cavity | LP | gland development | 149/4623 | 436/18723 | 4.51e-06 | 9.17e-05 | 149 |
| GO:006100819 | Oral cavity | LP | hepaticobiliary system development | 62/4623 | 150/18723 | 5.13e-06 | 1.03e-04 | 62 |
| Page: 1 |
| Pathway ID | Tissue | Disease Stage | Description | Gene Ratio | Bg Ratio | pvalue | p.adjust | qvalue | Count |
| Page: 1 |
Top |
Cell-cell communication analysis |
| Identification of potential cell-cell interactions between two cell types and their ligand-receptor pairs for different disease states |
| Ligand | Receptor | LRpair | Pathway | Tissue | Disease Stage |
| Page: 1 |
Top |
Single-cell gene regulatory network inference analysis |
| Find out the significant the regulons (TFs) and the target genes of each regulon across cell types for different disease states |
| TF | Cell Type | Tissue | Disease Stage | Target Gene | RSS | Regulon Activity |
| ∗The dot plots of a searched regulon are shown for all cell subpopulations in each disease state of each tissue based on the regulon specific score inferred using pySCENIC and by calculating the average expression. |
| Page: 1 |
Top |
Somatic mutation of malignant transformation related genes |
| Annotation of somatic variants for genes involved in malignant transformation |
| Hugo Symbol | Variant Class | Variant Classification | dbSNP RS | HGVSc | HGVSp | HGVSp Short | SWISSPROT | BIOTYPE | SIFT | PolyPhen | Tumor Sample Barcode | Tissue | Histology | Sex | Age | Stage | Therapy Types | Drugs | Outcome |
| DNAAF1 | SNV | Missense_Mutation | novel | c.761G>A | p.Gly254Glu | p.G254E | Q8NEP3 | protein_coding | deleterious(0) | probably_damaging(0.996) | TCGA-AN-A046-01 | Breast | breast invasive carcinoma | Female | >=65 | I/II | Unknown | Unknown | SD |
| DNAAF1 | SNV | Missense_Mutation | novel | c.509A>G | p.Glu170Gly | p.E170G | Q8NEP3 | protein_coding | deleterious(0) | possibly_damaging(0.775) | TCGA-BH-A0DZ-01 | Breast | breast invasive carcinoma | Female | <65 | I/II | Chemotherapy | docetaxel | SD |
| DNAAF1 | SNV | Missense_Mutation | novel | c.617A>C | p.His206Pro | p.H206P | Q8NEP3 | protein_coding | deleterious(0.03) | possibly_damaging(0.674) | TCGA-LL-A441-01 | Breast | breast invasive carcinoma | Female | <65 | I/II | Chemotherapy | taxotere | CR |
| DNAAF1 | insertion | In_Frame_Ins | novel | c.1583_1584insCAGTGGCACAATCTCGGCTCATTGCAACCTCCCTCTCCCAGGTTC | p.Gly528_Thr529insSerGlyThrIleSerAlaHisCysAsnLeuProLeuProGlySer | p.G528_T529insSGTISAHCNLPLPGS | Q8NEP3 | protein_coding | TCGA-A2-A0D2-01 | Breast | breast invasive carcinoma | Female | <65 | I/II | Chemotherapy | adriamycin | SD | ||
| DNAAF1 | SNV | Missense_Mutation | rs574238677 | c.460C>T | p.Arg154Cys | p.R154C | Q8NEP3 | protein_coding | deleterious(0) | probably_damaging(0.997) | TCGA-2W-A8YY-01 | Cervix | cervical & endocervical cancer | Female | <65 | I/II | Chemotherapy | cisplatin | CR |
| DNAAF1 | SNV | Missense_Mutation | rs769351361 | c.1430N>T | p.Pro477Leu | p.P477L | Q8NEP3 | protein_coding | tolerated(0.43) | benign(0) | TCGA-FU-A3YQ-01 | Cervix | cervical & endocervical cancer | Female | <65 | I/II | Unknown | Unknown | SD |
| DNAAF1 | SNV | Missense_Mutation | c.1024N>C | p.Glu342Gln | p.E342Q | Q8NEP3 | protein_coding | tolerated(0.08) | benign(0.155) | TCGA-JW-A5VI-01 | Cervix | cervical & endocervical cancer | Female | <65 | I/II | Chemotherapy | topotecan | PD | |
| DNAAF1 | SNV | Missense_Mutation | rs745857720 | c.872C>T | p.Ala291Val | p.A291V | Q8NEP3 | protein_coding | deleterious(0) | possibly_damaging(0.766) | TCGA-VS-A950-01 | Cervix | cervical & endocervical cancer | Female | <65 | III/IV | Unknown | Unknown | SD |
| DNAAF1 | SNV | Missense_Mutation | c.400C>A | p.Leu134Ile | p.L134I | Q8NEP3 | protein_coding | deleterious(0) | possibly_damaging(0.747) | TCGA-AA-3977-01 | Colorectum | colon adenocarcinoma | Male | >=65 | I/II | Unknown | Unknown | SD | |
| DNAAF1 | SNV | Missense_Mutation | rs149659582 | c.2063N>T | p.Pro688Leu | p.P688L | Q8NEP3 | protein_coding | deleterious(0.01) | benign(0.003) | TCGA-AA-A004-01 | Colorectum | colon adenocarcinoma | Male | >=65 | I/II | Unknown | Unknown | SD |
| Page: 1 2 3 4 5 6 7 8 |
Top |
Related drugs of malignant transformation related genes |
| Identification of chemicals and drugs interact with genes involved in malignant transfromation |
| (DGIdb 4.0) |
| Entrez ID | Symbol | Category | Interaction Types | Drug Claim Name | Drug Name | PMIDs |
| Page: 1 |

Copyright 2023-Present -The University of Texas Health Science Center at Houston |