
|
|||||
|
 | |
| |
| |
| |
| |
| |
|
Gene: DMXL2 |
Gene summary for DMXL2 |
| Gene information | Species | Human | Gene symbol | DMXL2 | Gene ID | 23312 |
| Gene name | Dmx like 2 | |
| Gene Alias | DEE81 | |
| Cytomap | 15q21.2 | |
| Gene Type | protein-coding | GO ID | GO:0006873 | UniProtAcc | Q8TDJ6 |
Top |
Malignant transformation analysis |
| Identification of the aberrant gene expression in precancerous and cancerous lesions by comparing the gene expression of stem-like cells in diseased tissues with normal stem cells |
| Entrez ID | Symbol | Replicates | Species | Organ | Tissue | Adj P-value | Log2FC | Malignancy |
| 23312 | DMXL2 | HTA11_3410_2000001011 | Human | Colorectum | AD | 1.96e-16 | -5.42e-01 | 0.0155 |
| 23312 | DMXL2 | HTA11_3361_2000001011 | Human | Colorectum | AD | 2.71e-02 | -4.35e-01 | -0.1207 |
| 23312 | DMXL2 | HTA11_696_2000001011 | Human | Colorectum | AD | 1.40e-11 | -4.42e-01 | -0.1464 |
| 23312 | DMXL2 | HTA11_866_2000001011 | Human | Colorectum | AD | 5.88e-13 | -4.57e-01 | -0.1001 |
| 23312 | DMXL2 | HTA11_1391_2000001011 | Human | Colorectum | AD | 7.26e-04 | -3.98e-01 | -0.059 |
| 23312 | DMXL2 | HTA11_546_2000001011 | Human | Colorectum | AD | 3.90e-02 | -4.77e-01 | -0.0842 |
| 23312 | DMXL2 | HTA11_866_3004761011 | Human | Colorectum | AD | 3.81e-12 | -5.17e-01 | 0.096 |
| 23312 | DMXL2 | HTA11_8622_2000001021 | Human | Colorectum | SER | 7.40e-03 | -5.56e-01 | 0.0528 |
| 23312 | DMXL2 | HTA11_10711_2000001011 | Human | Colorectum | AD | 5.10e-11 | -5.70e-01 | 0.0338 |
| 23312 | DMXL2 | HTA11_7696_3000711011 | Human | Colorectum | AD | 1.30e-22 | -5.28e-01 | 0.0674 |
| 23312 | DMXL2 | HTA11_6818_2000001021 | Human | Colorectum | AD | 8.27e-05 | -5.13e-01 | 0.0588 |
| 23312 | DMXL2 | HTA11_99999970781_79442 | Human | Colorectum | MSS | 1.88e-08 | -3.73e-01 | 0.294 |
| 23312 | DMXL2 | HTA11_99999971662_82457 | Human | Colorectum | MSS | 1.49e-16 | -4.79e-01 | 0.3859 |
| 23312 | DMXL2 | HTA11_99999973899_84307 | Human | Colorectum | MSS | 3.04e-06 | -5.64e-01 | 0.2585 |
| 23312 | DMXL2 | HTA11_99999974143_84620 | Human | Colorectum | MSS | 1.10e-14 | -4.84e-01 | 0.3005 |
| 23312 | DMXL2 | F007 | Human | Colorectum | FAP | 2.53e-02 | -3.49e-01 | 0.1176 |
| 23312 | DMXL2 | A002-C-010 | Human | Colorectum | FAP | 4.45e-13 | -3.77e-01 | 0.242 |
| 23312 | DMXL2 | A015-C-203 | Human | Colorectum | FAP | 9.02e-20 | -2.97e-01 | -0.1294 |
| 23312 | DMXL2 | A015-C-204 | Human | Colorectum | FAP | 2.22e-03 | -2.29e-01 | -0.0228 |
| 23312 | DMXL2 | A002-C-201 | Human | Colorectum | FAP | 2.03e-08 | -2.53e-01 | 0.0324 |
| Page: 1 2 3 4 5 |
| Tissue | Expression Dynamics | Abbreviation |
| Colorectum (GSE201348) |  | FAP: Familial adenomatous polyposis |
| CRC: Colorectal cancer | ||
| Colorectum (HTA11) |  | AD: Adenomas |
| SER: Sessile serrated lesions | ||
| MSI-H: Microsatellite-high colorectal cancer | ||
| MSS: Microsatellite stable colorectal cancer | ||
| Esophagus | 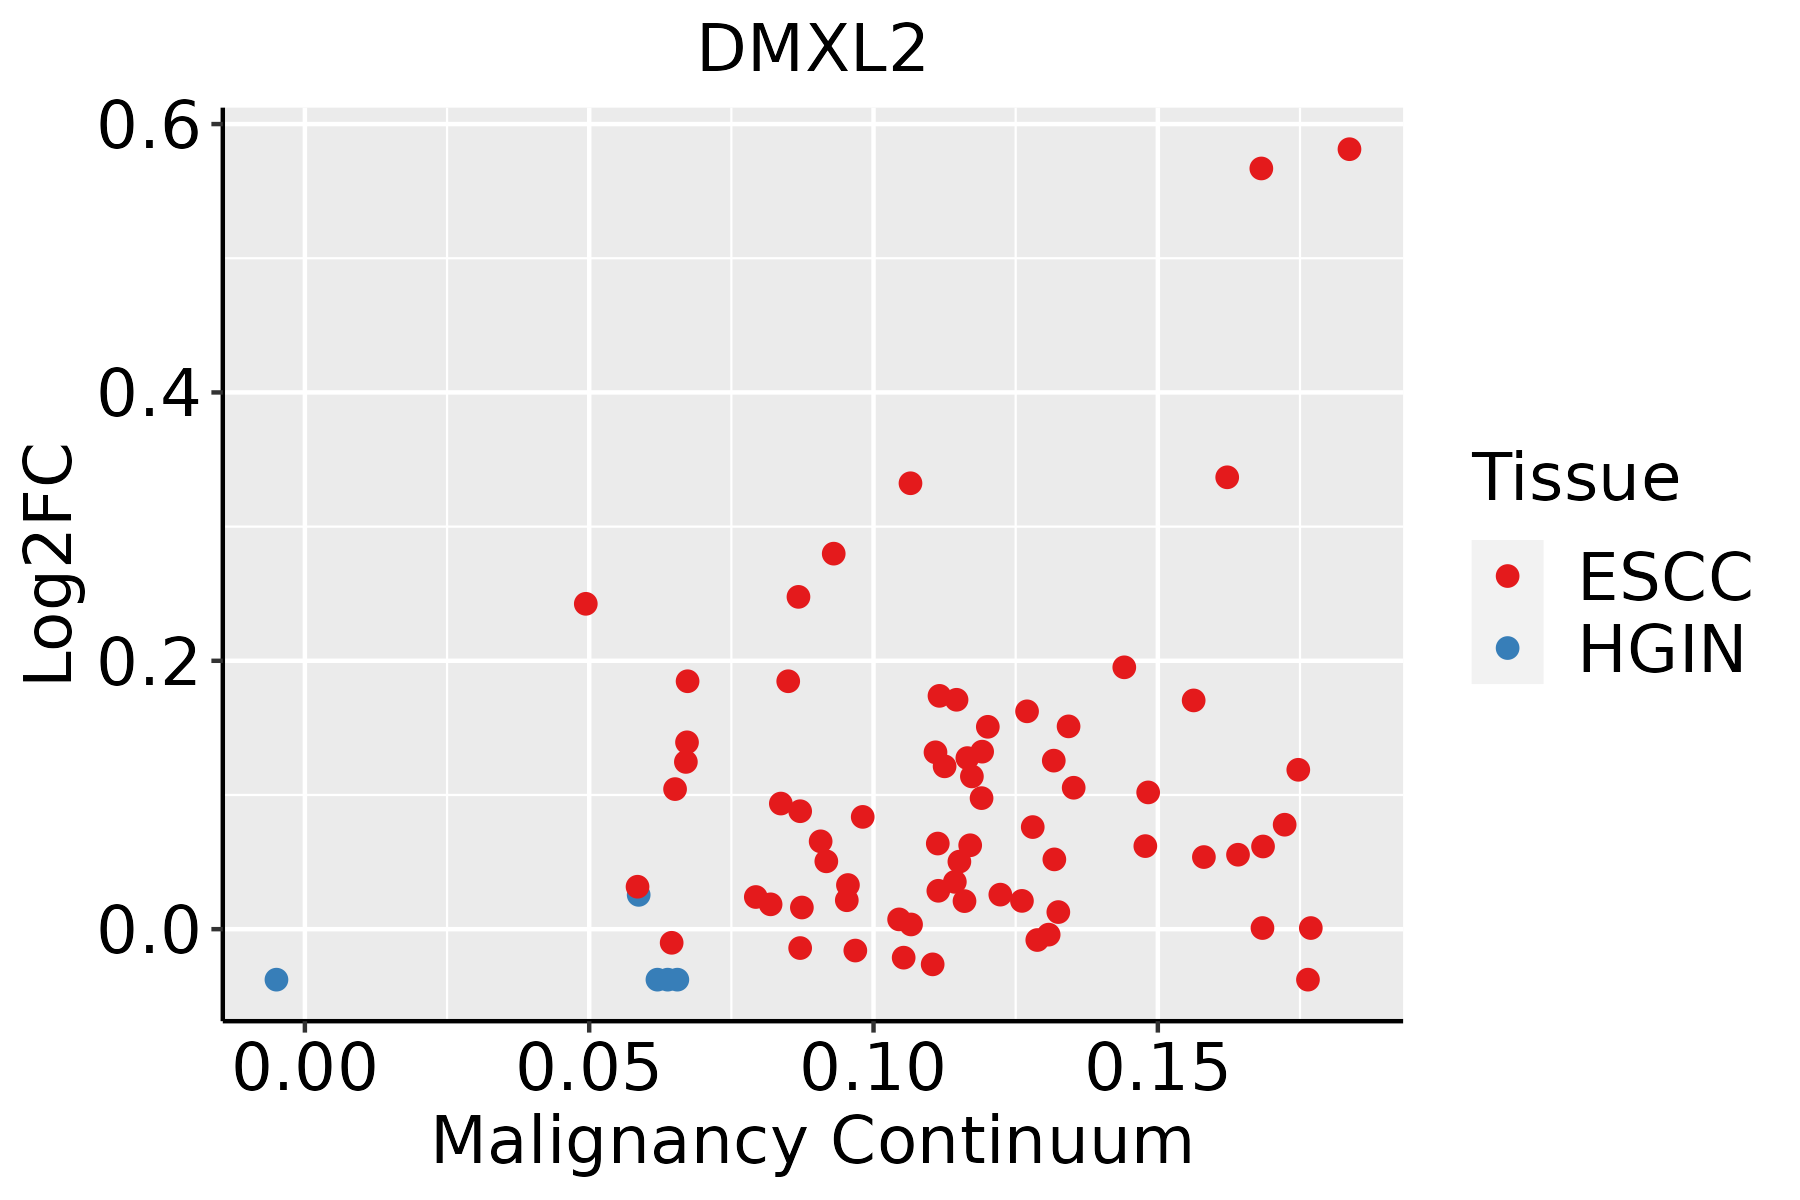 | ESCC: Esophageal squamous cell carcinoma |
| HGIN: High-grade intraepithelial neoplasias | ||
| LGIN: Low-grade intraepithelial neoplasias | ||
| Liver | 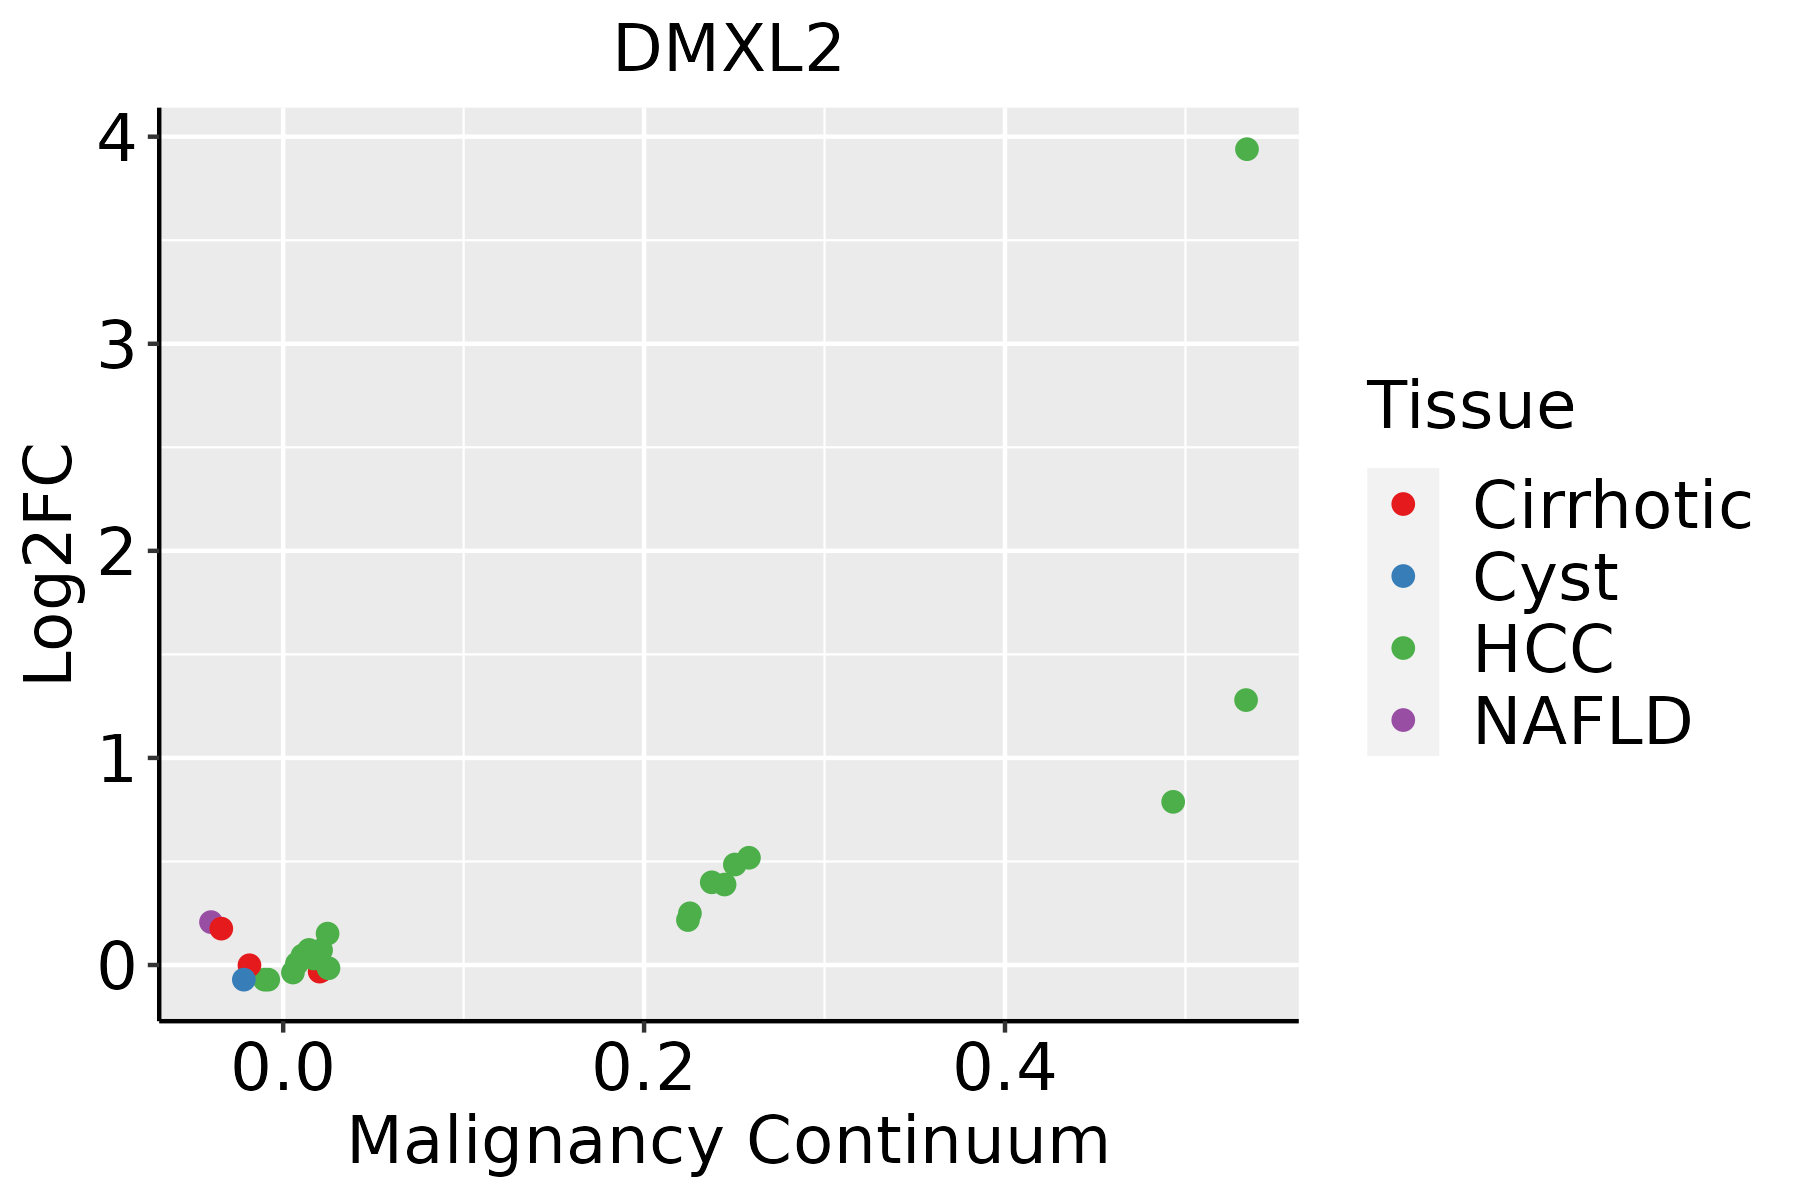 | HCC: Hepatocellular carcinoma |
| NAFLD: Non-alcoholic fatty liver disease |
| ∗log2FC in expression of this searched gene in stem-like cells from each diseased tissue sample relative to stem-like cells in normal samples in each tissue plotted against the malignancy continuum. Samples are colored based on if they are from different disease stage. |
Top |
Malignant transformation related pathway analysis |
| Find out the enriched GO biological processes and KEGG pathways involved in transition from healthy to precancer to cancer |
| Tissue | Disease Stage | Enriched GO biological Processes |
| Colorectum | AD |  |
| Colorectum | SER |  |
| Colorectum | MSS |  |
| Colorectum | MSI-H |  |
| Colorectum | FAP |  |
| ∗Top 15 enriched GO BP terms are showed in the bar plot of each disease state in each tissue. Each row represents a significant GO biological process which is colored according to the -log10(p.adjust). |
| Page: 1 2 3 4 5 6 7 8 9 |
| GO ID | Tissue | Disease Stage | Description | Gene Ratio | Bg Ratio | pvalue | p.adjust | Count |
| GO:0030004 | Colorectum | AD | cellular monovalent inorganic cation homeostasis | 36/3918 | 103/18723 | 6.80e-04 | 6.95e-03 | 36 |
| GO:0030641 | Colorectum | AD | regulation of cellular pH | 29/3918 | 81/18723 | 1.42e-03 | 1.22e-02 | 29 |
| GO:0051453 | Colorectum | AD | regulation of intracellular pH | 26/3918 | 75/18723 | 4.04e-03 | 2.82e-02 | 26 |
| GO:0006885 | Colorectum | AD | regulation of pH | 30/3918 | 91/18723 | 4.95e-03 | 3.32e-02 | 30 |
| GO:0055067 | Colorectum | AD | monovalent inorganic cation homeostasis | 45/3918 | 151/18723 | 6.19e-03 | 3.88e-02 | 45 |
| GO:00300041 | Colorectum | SER | cellular monovalent inorganic cation homeostasis | 31/2897 | 103/18723 | 1.31e-04 | 2.66e-03 | 31 |
| GO:00306411 | Colorectum | SER | regulation of cellular pH | 24/2897 | 81/18723 | 9.20e-04 | 1.11e-02 | 24 |
| GO:00550671 | Colorectum | SER | monovalent inorganic cation homeostasis | 37/2897 | 151/18723 | 2.48e-03 | 2.33e-02 | 37 |
| GO:00514531 | Colorectum | SER | regulation of intracellular pH | 21/2897 | 75/18723 | 3.97e-03 | 3.26e-02 | 21 |
| GO:00068851 | Colorectum | SER | regulation of pH | 24/2897 | 91/18723 | 5.03e-03 | 3.88e-02 | 24 |
| GO:00300042 | Colorectum | MSS | cellular monovalent inorganic cation homeostasis | 31/3467 | 103/18723 | 2.94e-03 | 2.27e-02 | 31 |
| GO:00306412 | Colorectum | MSS | regulation of cellular pH | 25/3467 | 81/18723 | 4.97e-03 | 3.46e-02 | 25 |
| GO:00300043 | Colorectum | FAP | cellular monovalent inorganic cation homeostasis | 28/2622 | 103/18723 | 3.23e-04 | 4.15e-03 | 28 |
| GO:00514532 | Colorectum | FAP | regulation of intracellular pH | 22/2622 | 75/18723 | 4.38e-04 | 5.21e-03 | 22 |
| GO:00306413 | Colorectum | FAP | regulation of cellular pH | 22/2622 | 81/18723 | 1.37e-03 | 1.24e-02 | 22 |
| GO:00550672 | Colorectum | FAP | monovalent inorganic cation homeostasis | 35/2622 | 151/18723 | 1.58e-03 | 1.40e-02 | 35 |
| GO:00068852 | Colorectum | FAP | regulation of pH | 23/2622 | 91/18723 | 3.00e-03 | 2.27e-02 | 23 |
| GO:00514533 | Colorectum | CRC | regulation of intracellular pH | 17/2078 | 75/18723 | 3.04e-03 | 2.71e-02 | 17 |
| GO:00300044 | Colorectum | CRC | cellular monovalent inorganic cation homeostasis | 21/2078 | 103/18723 | 4.15e-03 | 3.40e-02 | 21 |
| GO:00306414 | Colorectum | CRC | regulation of cellular pH | 17/2078 | 81/18723 | 6.93e-03 | 4.85e-02 | 17 |
| Page: 1 2 |
| Pathway ID | Tissue | Disease Stage | Description | Gene Ratio | Bg Ratio | pvalue | p.adjust | qvalue | Count |
| hsa04142 | Colorectum | SER | Lysosome | 38/1580 | 132/8465 | 2.87e-03 | 2.03e-02 | 1.47e-02 | 38 |
| hsa041421 | Colorectum | SER | Lysosome | 38/1580 | 132/8465 | 2.87e-03 | 2.03e-02 | 1.47e-02 | 38 |
| hsa0414222 | Esophagus | ESCC | Lysosome | 102/4205 | 132/8465 | 5.11e-11 | 7.13e-10 | 3.65e-10 | 102 |
| hsa0414232 | Esophagus | ESCC | Lysosome | 102/4205 | 132/8465 | 5.11e-11 | 7.13e-10 | 3.65e-10 | 102 |
| hsa041422 | Liver | HCC | Lysosome | 100/4020 | 132/8465 | 2.32e-11 | 4.31e-10 | 2.40e-10 | 100 |
| hsa041423 | Liver | HCC | Lysosome | 100/4020 | 132/8465 | 2.32e-11 | 4.31e-10 | 2.40e-10 | 100 |
| Page: 1 |
Top |
Cell-cell communication analysis |
| Identification of potential cell-cell interactions between two cell types and their ligand-receptor pairs for different disease states |
| Ligand | Receptor | LRpair | Pathway | Tissue | Disease Stage |
| Page: 1 |
Top |
Single-cell gene regulatory network inference analysis |
| Find out the significant the regulons (TFs) and the target genes of each regulon across cell types for different disease states |
| TF | Cell Type | Tissue | Disease Stage | Target Gene | RSS | Regulon Activity |
| ∗The dot plots of a searched regulon are shown for all cell subpopulations in each disease state of each tissue based on the regulon specific score inferred using pySCENIC and by calculating the average expression. |
| Page: 1 |
Top |
Somatic mutation of malignant transformation related genes |
| Annotation of somatic variants for genes involved in malignant transformation |
| Hugo Symbol | Variant Class | Variant Classification | dbSNP RS | HGVSc | HGVSp | HGVSp Short | SWISSPROT | BIOTYPE | SIFT | PolyPhen | Tumor Sample Barcode | Tissue | Histology | Sex | Age | Stage | Therapy Types | Drugs | Outcome |
| DMXL2 | SNV | Missense_Mutation | c.1756N>C | p.Val586Leu | p.V586L | Q8TDJ6 | protein_coding | tolerated(0.71) | benign(0) | TCGA-A2-A04T-01 | Breast | breast invasive carcinoma | Female | <65 | I/II | Chemotherapy | cyclophosphamide | SD | |
| DMXL2 | SNV | Missense_Mutation | c.1285N>C | p.Glu429Gln | p.E429Q | Q8TDJ6 | protein_coding | tolerated(0.32) | benign(0.143) | TCGA-A2-A0CL-01 | Breast | breast invasive carcinoma | Female | <65 | III/IV | Chemotherapy | cytoxan | SD | |
| DMXL2 | SNV | Missense_Mutation | c.5218G>T | p.Val1740Leu | p.V1740L | Q8TDJ6 | protein_coding | deleterious(0) | probably_damaging(0.996) | TCGA-A8-A094-01 | Breast | breast invasive carcinoma | Female | >=65 | I/II | Unknown | Unknown | SD | |
| DMXL2 | SNV | Missense_Mutation | c.4844A>G | p.Asn1615Ser | p.N1615S | Q8TDJ6 | protein_coding | tolerated(0.18) | possibly_damaging(0.793) | TCGA-A8-A097-01 | Breast | breast invasive carcinoma | Female | >=65 | I/II | Hormone Therapy | tamoxiphen | SD | |
| DMXL2 | SNV | Missense_Mutation | c.6415G>C | p.Glu2139Gln | p.E2139Q | Q8TDJ6 | protein_coding | tolerated(0.67) | benign(0.098) | TCGA-AC-A23H-01 | Breast | breast invasive carcinoma | Female | >=65 | I/II | Unknown | Unknown | PD | |
| DMXL2 | SNV | Missense_Mutation | c.6256G>A | p.Glu2086Lys | p.E2086K | Q8TDJ6 | protein_coding | tolerated(1) | benign(0.003) | TCGA-AC-A23H-01 | Breast | breast invasive carcinoma | Female | >=65 | I/II | Unknown | Unknown | PD | |
| DMXL2 | SNV | Missense_Mutation | c.3874G>A | p.Glu1292Lys | p.E1292K | Q8TDJ6 | protein_coding | tolerated(0.56) | benign(0.001) | TCGA-AC-A23H-01 | Breast | breast invasive carcinoma | Female | >=65 | I/II | Unknown | Unknown | PD | |
| DMXL2 | SNV | Missense_Mutation | novel | c.2242A>C | p.Ile748Leu | p.I748L | Q8TDJ6 | protein_coding | deleterious(0.02) | probably_damaging(0.994) | TCGA-AC-A5XS-01 | Breast | breast invasive carcinoma | Female | >=65 | I/II | Hormone Therapy | femara | SD |
| DMXL2 | SNV | Missense_Mutation | novel | c.2026N>T | p.Thr676Ser | p.T676S | Q8TDJ6 | protein_coding | tolerated(0.24) | probably_damaging(0.916) | TCGA-AC-A8OR-01 | Breast | breast invasive carcinoma | Female | >=65 | I/II | Unknown | Unknown | SD |
| DMXL2 | SNV | Missense_Mutation | rs763981971 | c.7111C>T | p.Arg2371Trp | p.R2371W | Q8TDJ6 | protein_coding | deleterious(0) | probably_damaging(0.994) | TCGA-AN-A046-01 | Breast | breast invasive carcinoma | Female | >=65 | I/II | Unknown | Unknown | SD |
| Page: 1 2 3 4 5 6 7 8 9 10 11 12 13 14 15 16 17 18 19 20 21 22 23 24 25 26 27 28 29 30 31 32 33 34 35 |
Top |
Related drugs of malignant transformation related genes |
| Identification of chemicals and drugs interact with genes involved in malignant transfromation |
| (DGIdb 4.0) |
| Entrez ID | Symbol | Category | Interaction Types | Drug Claim Name | Drug Name | PMIDs |
| Page: 1 |

Copyright 2023-Present -The University of Texas Health Science Center at Houston |