
|
|||||
|
 | |
| |
| |
| |
| |
| |
|
Gene: DMXL1 |
Gene summary for DMXL1 |
| Gene information | Species | Human | Gene symbol | DMXL1 | Gene ID | 1657 |
| Gene name | Dmx like 1 | |
| Gene Alias | DMXL1 | |
| Cytomap | 5q23.1 | |
| Gene Type | protein-coding | GO ID | GO:0006873 | UniProtAcc | B2RWN7 |
Top |
Malignant transformation analysis |
| Identification of the aberrant gene expression in precancerous and cancerous lesions by comparing the gene expression of stem-like cells in diseased tissues with normal stem cells |
| Entrez ID | Symbol | Replicates | Species | Organ | Tissue | Adj P-value | Log2FC | Malignancy |
| 1657 | DMXL1 | CCI_2 | Human | Cervix | CC | 5.81e-10 | 1.16e+00 | 0.5249 |
| 1657 | DMXL1 | CCI_3 | Human | Cervix | CC | 6.54e-08 | 7.22e-01 | 0.516 |
| 1657 | DMXL1 | HTA11_3410_2000001011 | Human | Colorectum | AD | 5.24e-21 | -6.83e-01 | 0.0155 |
| 1657 | DMXL1 | HTA11_2487_2000001011 | Human | Colorectum | SER | 4.69e-03 | -4.29e-01 | -0.1808 |
| 1657 | DMXL1 | HTA11_3361_2000001011 | Human | Colorectum | AD | 3.16e-06 | -5.17e-01 | -0.1207 |
| 1657 | DMXL1 | HTA11_83_2000001011 | Human | Colorectum | SER | 9.15e-03 | -4.52e-01 | -0.1526 |
| 1657 | DMXL1 | HTA11_696_2000001011 | Human | Colorectum | AD | 6.31e-04 | -4.06e-01 | -0.1464 |
| 1657 | DMXL1 | HTA11_866_2000001011 | Human | Colorectum | AD | 1.73e-02 | -4.05e-01 | -0.1001 |
| 1657 | DMXL1 | HTA11_1391_2000001011 | Human | Colorectum | AD | 1.08e-05 | -4.59e-01 | -0.059 |
| 1657 | DMXL1 | HTA11_5212_2000001011 | Human | Colorectum | AD | 7.26e-03 | -5.46e-01 | -0.2061 |
| 1657 | DMXL1 | HTA11_866_3004761011 | Human | Colorectum | AD | 5.63e-11 | -5.33e-01 | 0.096 |
| 1657 | DMXL1 | HTA11_10623_2000001011 | Human | Colorectum | AD | 2.04e-02 | -5.65e-01 | -0.0177 |
| 1657 | DMXL1 | HTA11_10711_2000001011 | Human | Colorectum | AD | 7.55e-05 | -4.59e-01 | 0.0338 |
| 1657 | DMXL1 | HTA11_7696_3000711011 | Human | Colorectum | AD | 1.90e-07 | -5.09e-01 | 0.0674 |
| 1657 | DMXL1 | HTA11_6818_2000001021 | Human | Colorectum | AD | 6.87e-04 | -4.08e-01 | 0.0588 |
| 1657 | DMXL1 | HTA11_99999970781_79442 | Human | Colorectum | MSS | 2.32e-16 | -5.67e-01 | 0.294 |
| 1657 | DMXL1 | HTA11_99999971662_82457 | Human | Colorectum | MSS | 3.08e-02 | -3.57e-01 | 0.3859 |
| 1657 | DMXL1 | HTA11_99999973899_84307 | Human | Colorectum | MSS | 2.14e-05 | -5.38e-01 | 0.2585 |
| 1657 | DMXL1 | HTA11_99999974143_84620 | Human | Colorectum | MSS | 6.86e-05 | -4.11e-01 | 0.3005 |
| 1657 | DMXL1 | F007 | Human | Colorectum | FAP | 1.24e-06 | -4.67e-01 | 0.1176 |
| Page: 1 2 3 4 5 6 7 8 |
| Tissue | Expression Dynamics | Abbreviation |
| Cervix |  | CC: Cervix cancer |
| HSIL_HPV: HPV-infected high-grade squamous intraepithelial lesions | ||
| N_HPV: HPV-infected normal cervix | ||
| Colorectum (GSE201348) | 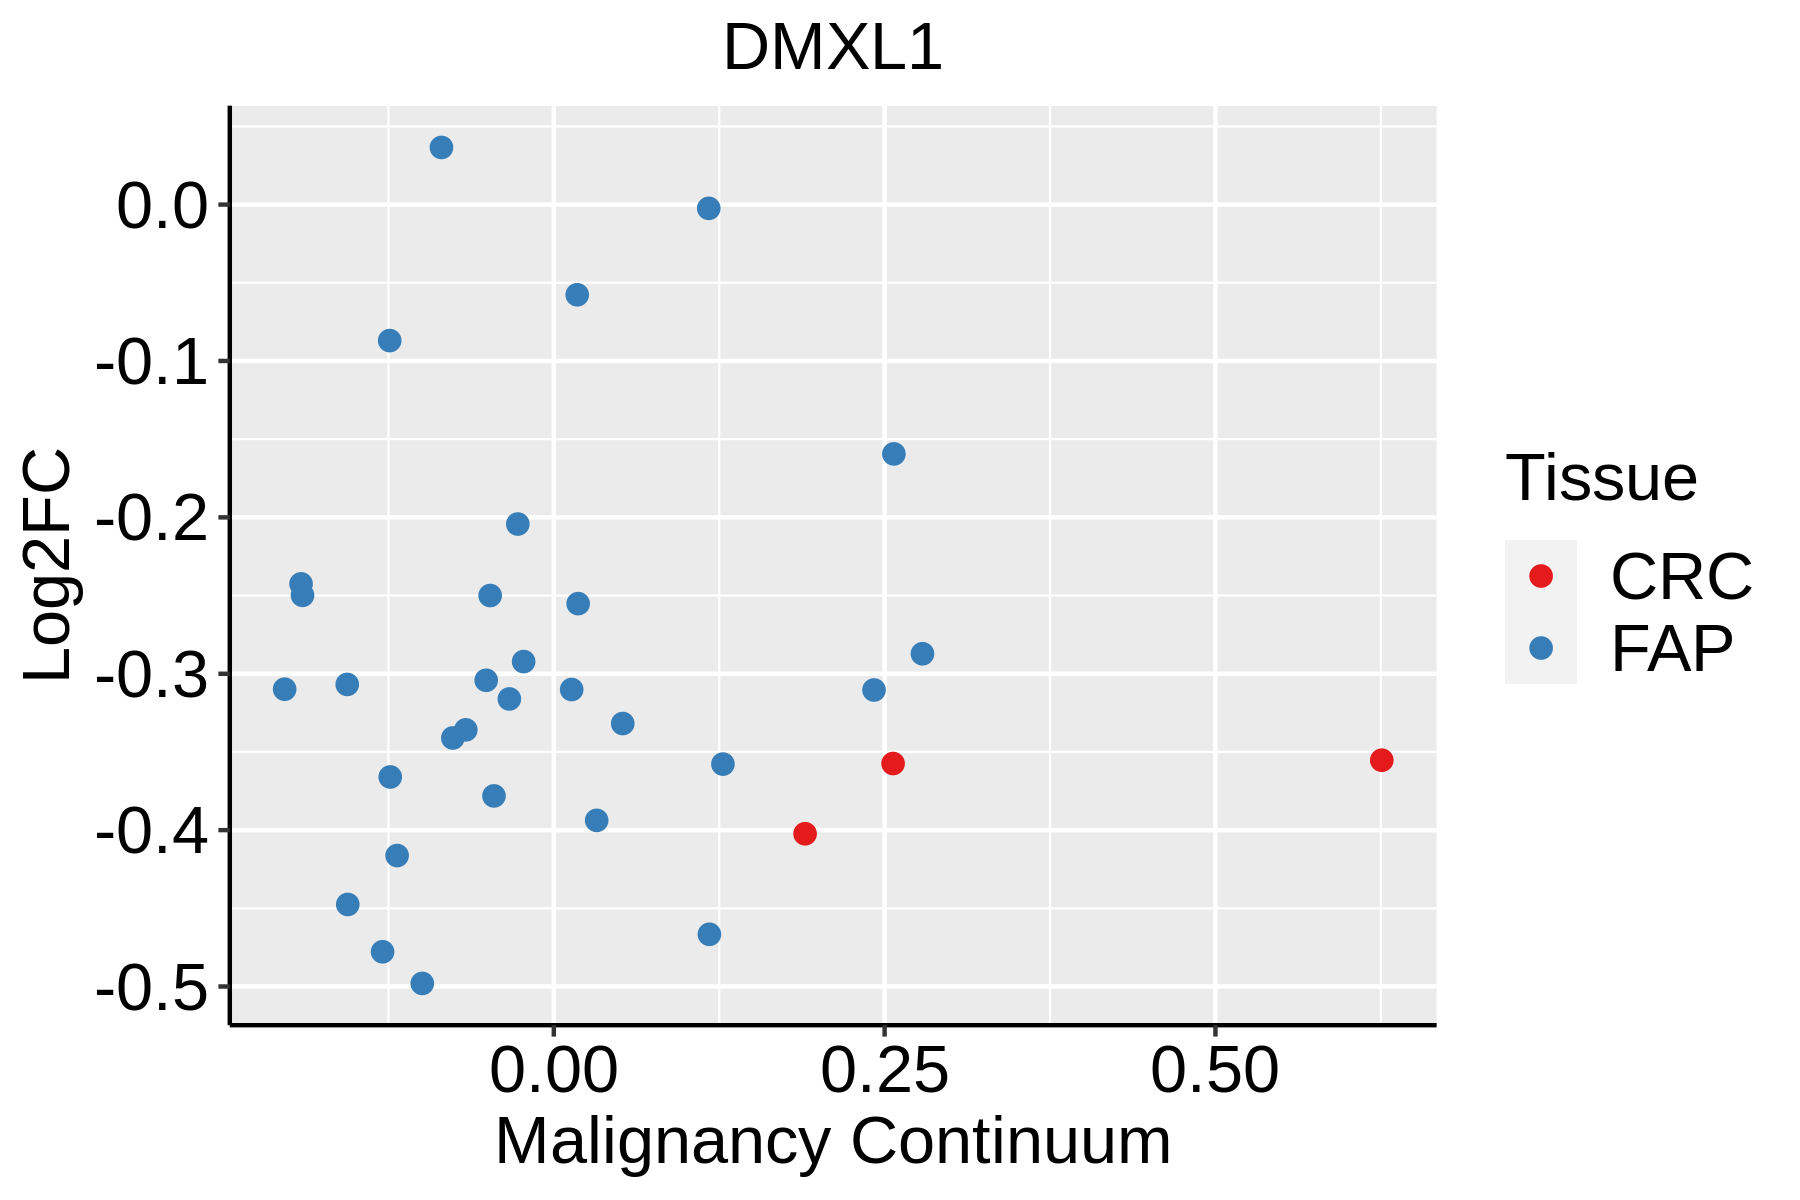 | FAP: Familial adenomatous polyposis |
| CRC: Colorectal cancer | ||
| Colorectum (HTA11) | 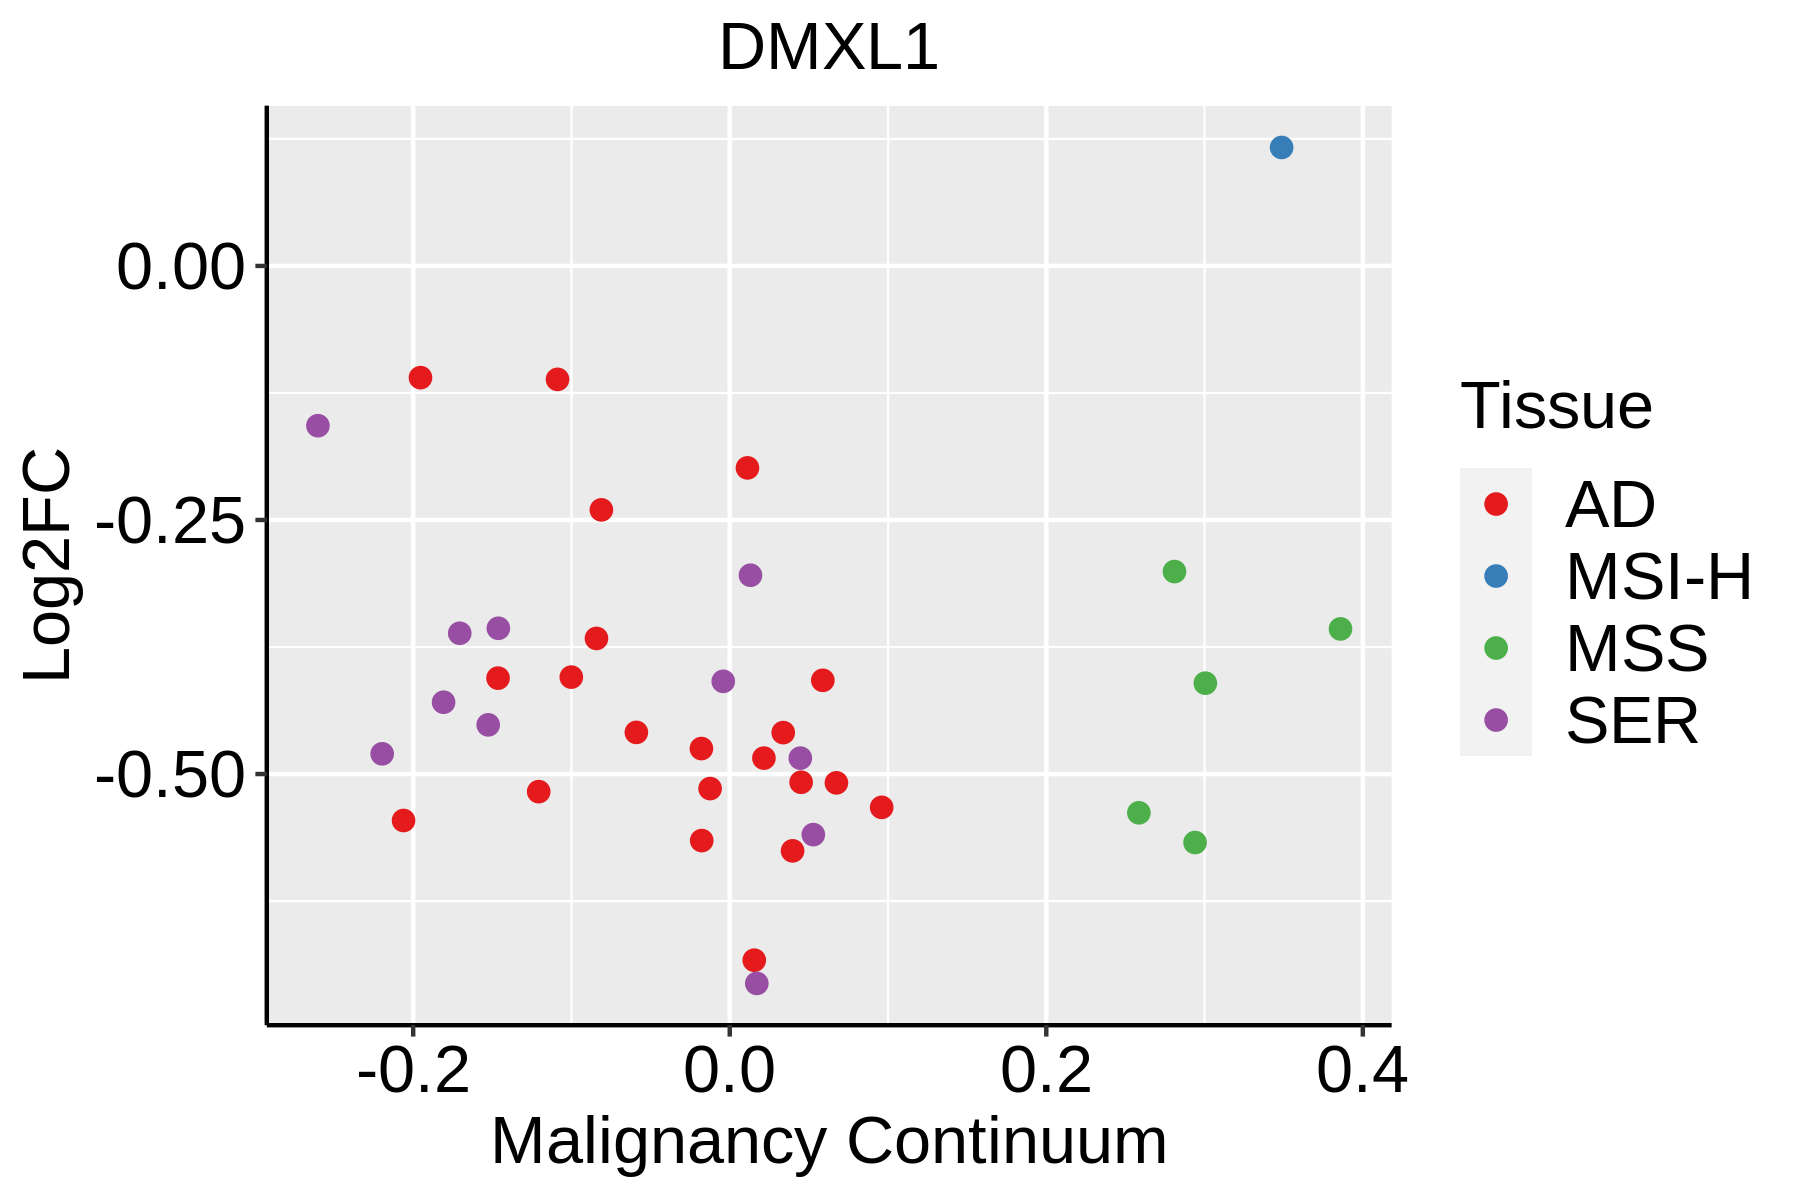 | AD: Adenomas |
| SER: Sessile serrated lesions | ||
| MSI-H: Microsatellite-high colorectal cancer | ||
| MSS: Microsatellite stable colorectal cancer | ||
| Esophagus | 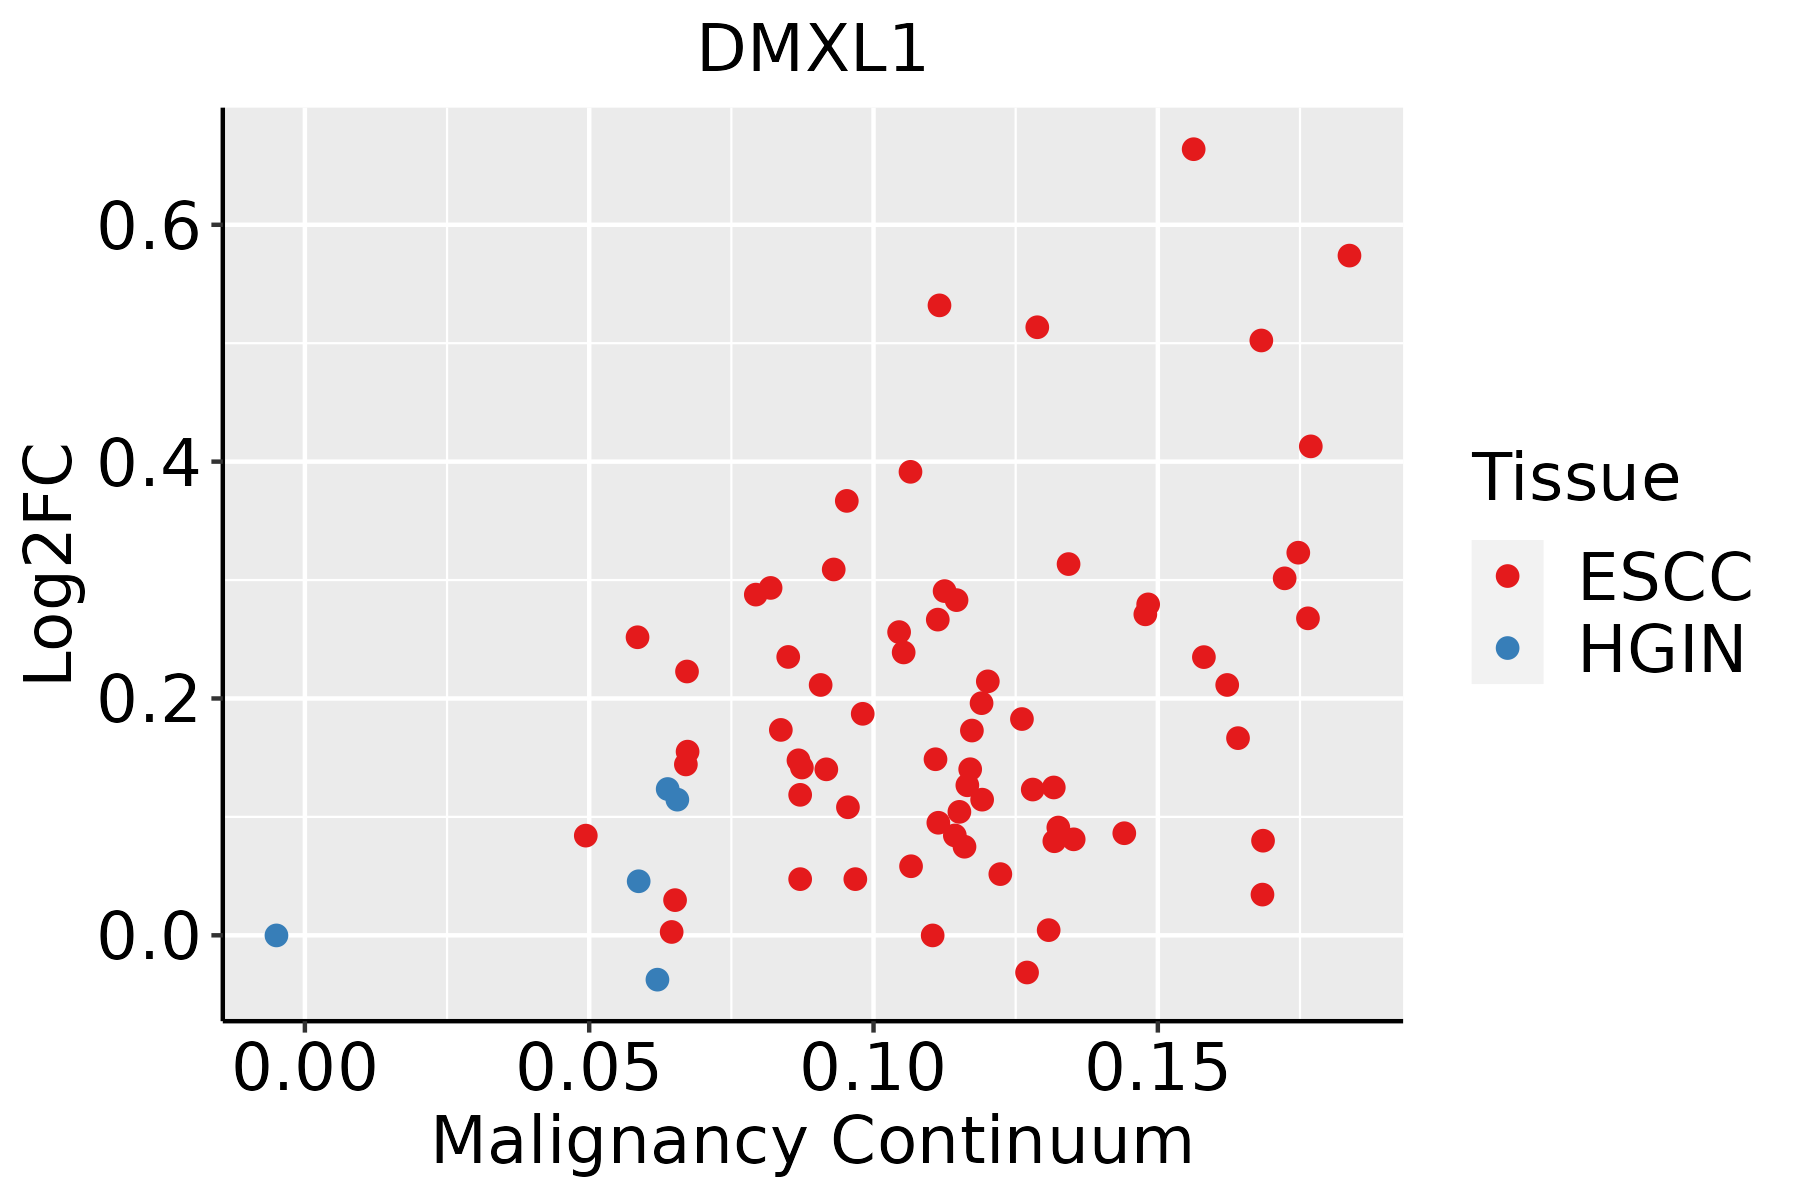 | ESCC: Esophageal squamous cell carcinoma |
| HGIN: High-grade intraepithelial neoplasias | ||
| LGIN: Low-grade intraepithelial neoplasias | ||
| Liver | 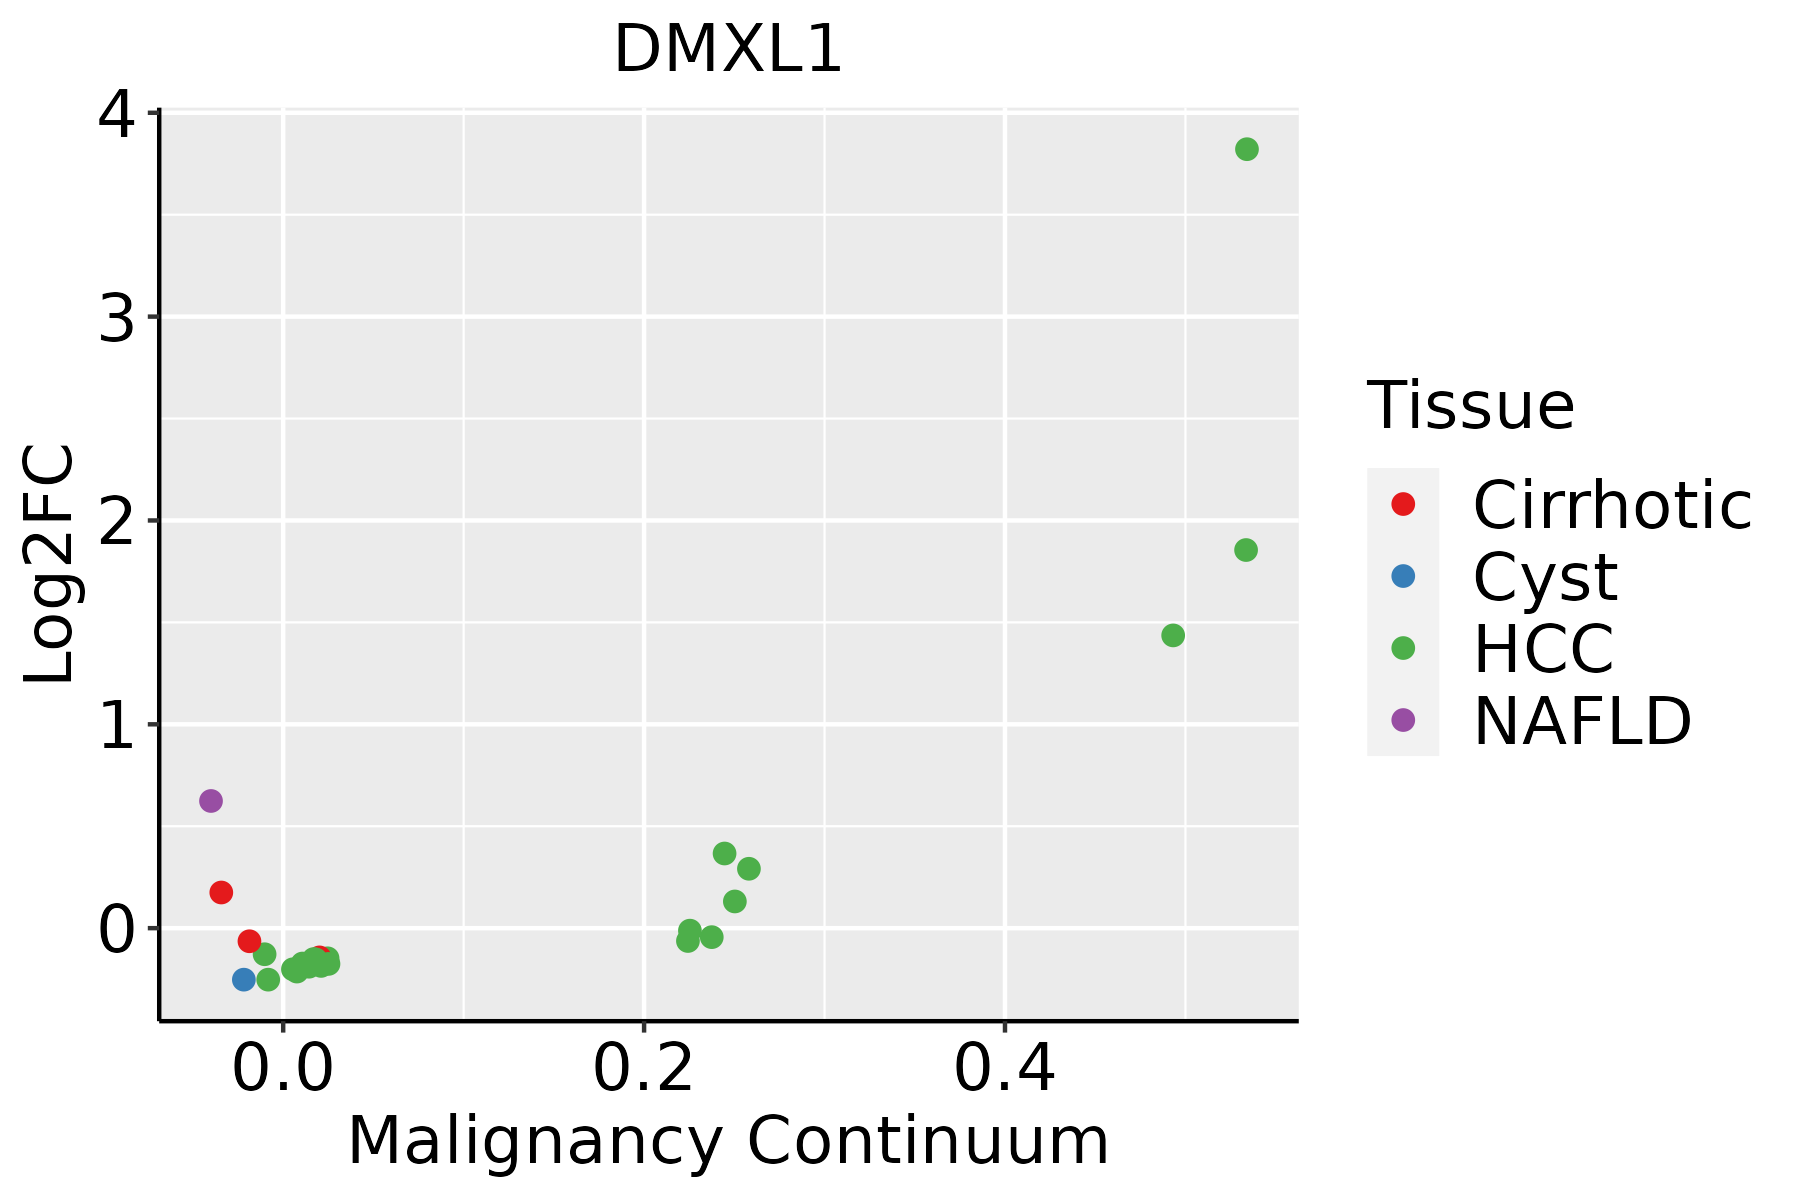 | HCC: Hepatocellular carcinoma |
| NAFLD: Non-alcoholic fatty liver disease | ||
| Lung | 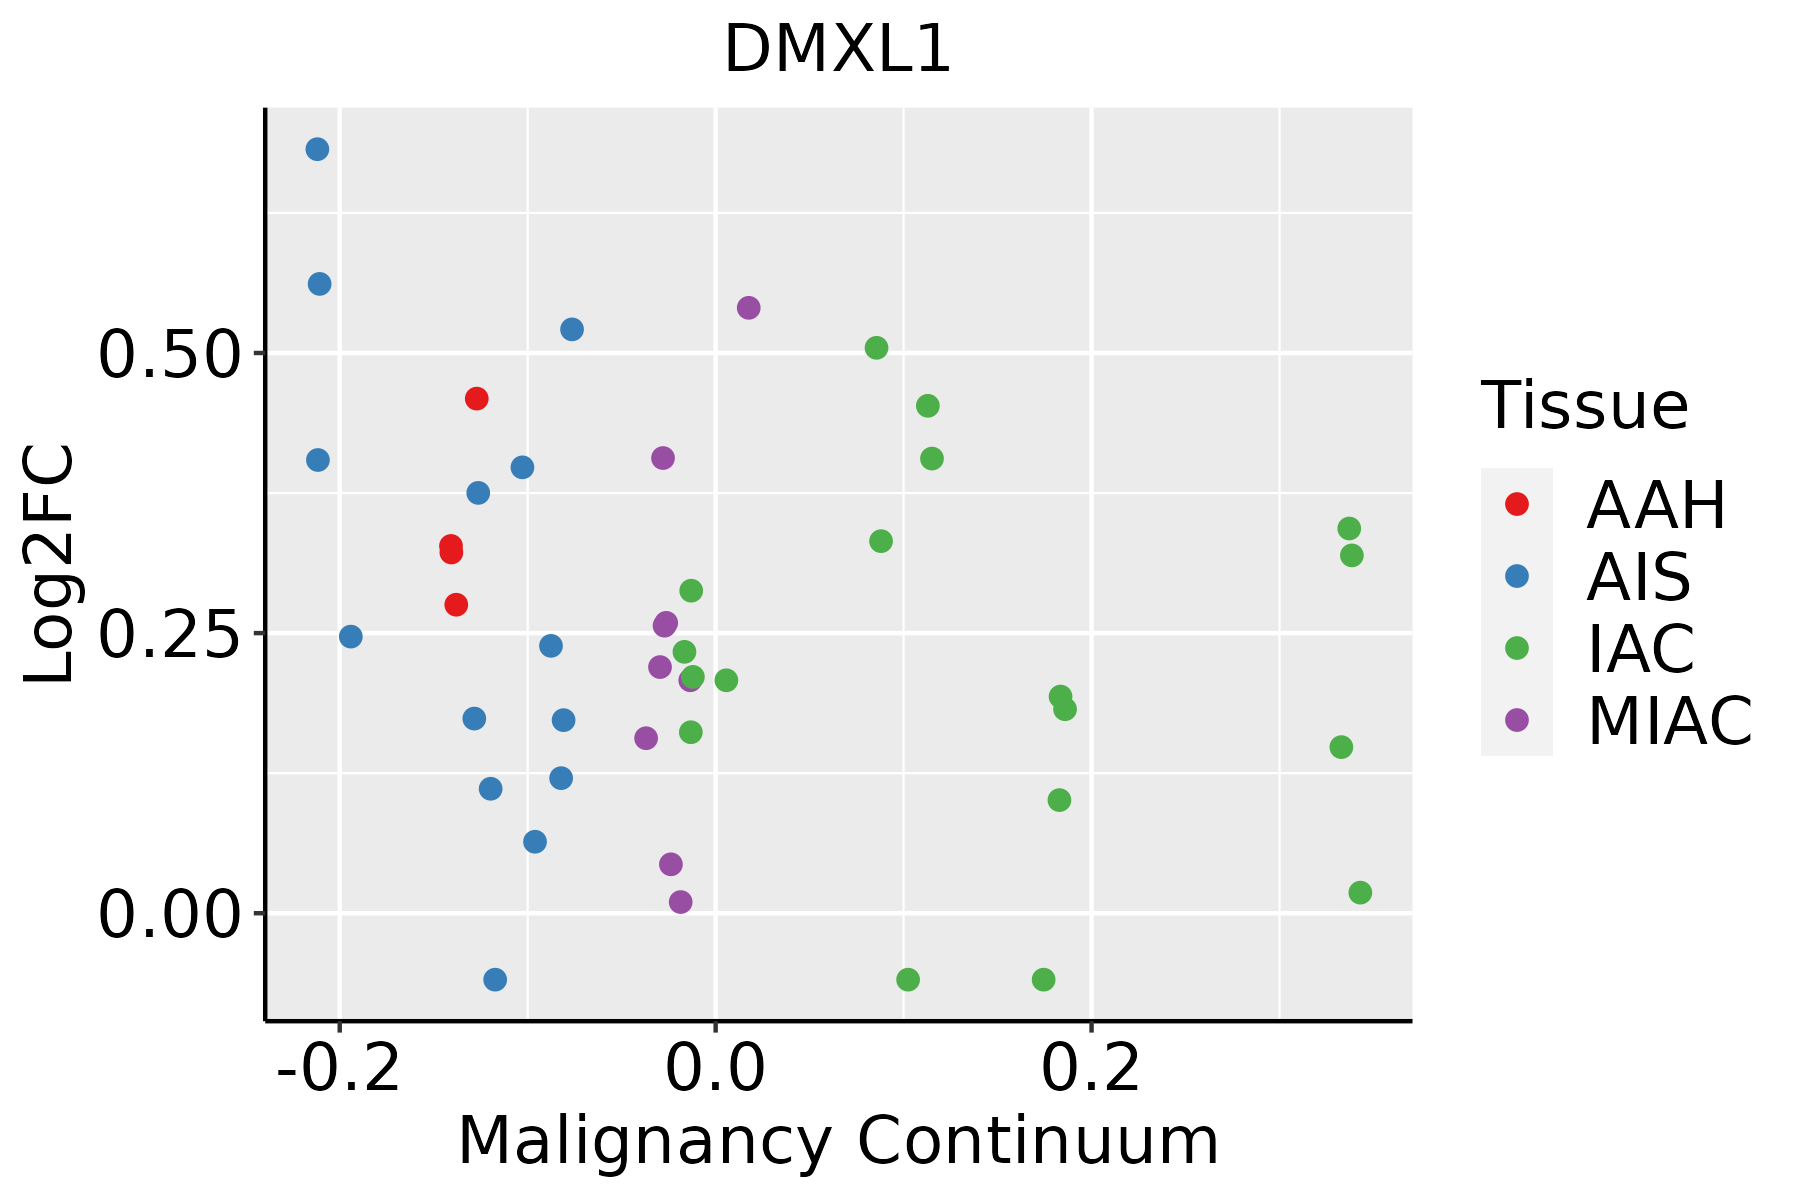 | AAH: Atypical adenomatous hyperplasia |
| AIS: Adenocarcinoma in situ | ||
| IAC: Invasive lung adenocarcinoma | ||
| MIA: Minimally invasive adenocarcinoma | ||
| Prostate | 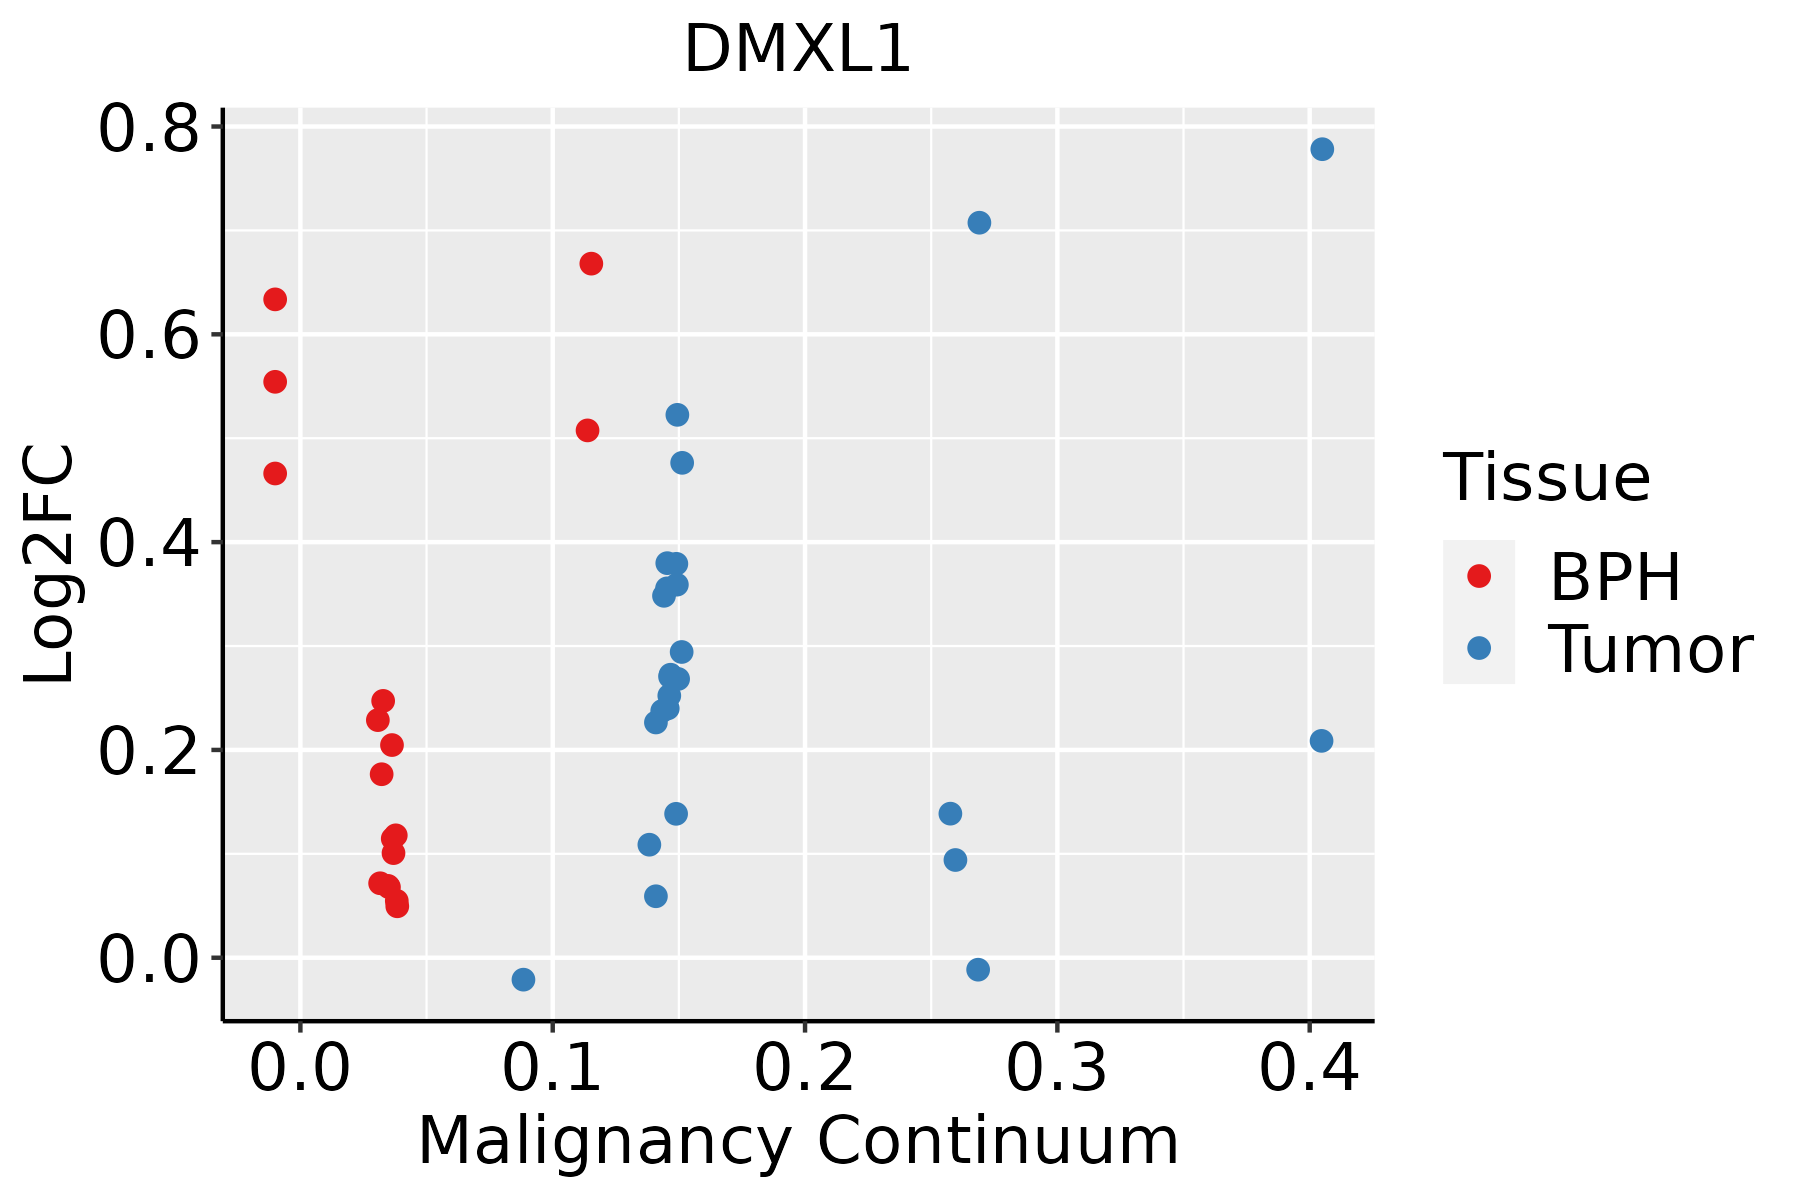 | BPH: Benign Prostatic Hyperplasia |
| Thyroid | 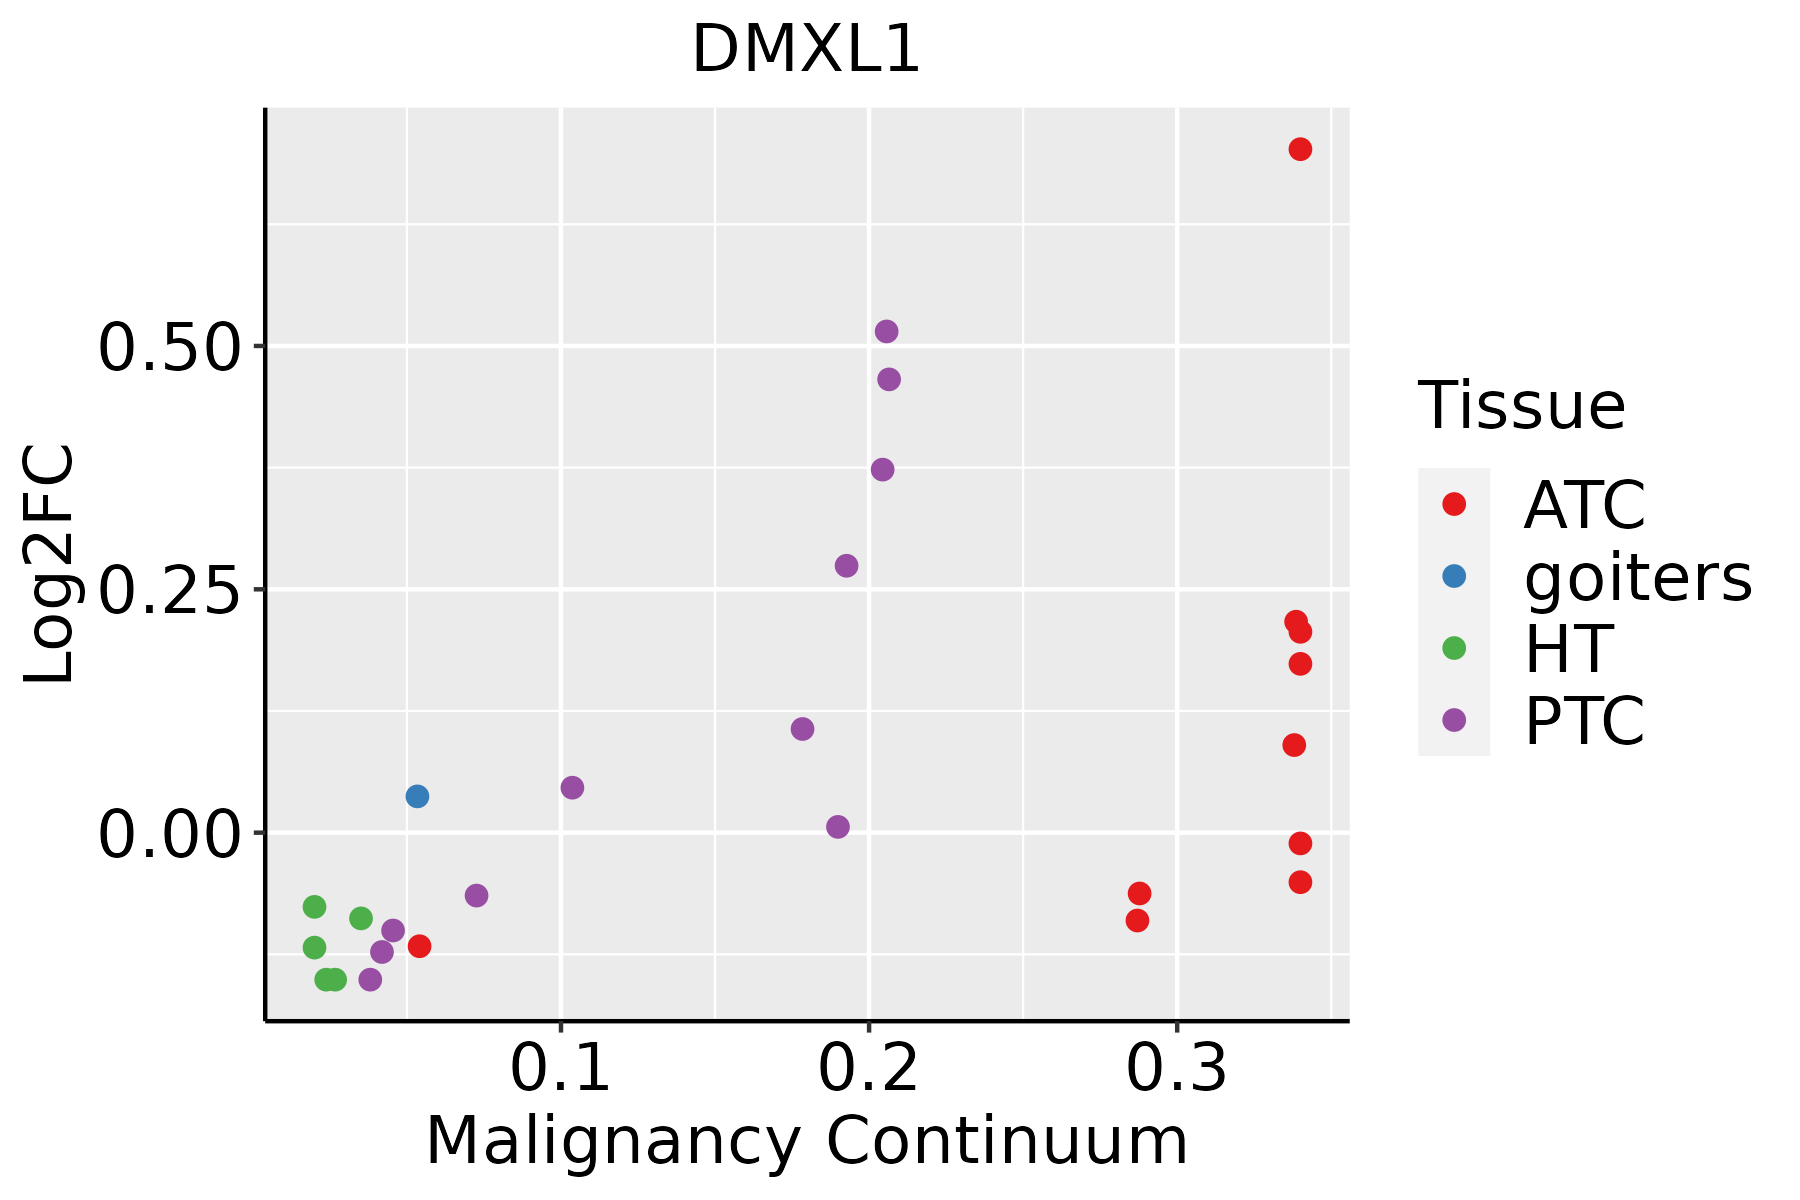 | ATC: Anaplastic thyroid cancer |
| HT: Hashimoto's thyroiditis | ||
| PTC: Papillary thyroid cancer |
| ∗log2FC in expression of this searched gene in stem-like cells from each diseased tissue sample relative to stem-like cells in normal samples in each tissue plotted against the malignancy continuum. Samples are colored based on if they are from different disease stage. |
Top |
Malignant transformation related pathway analysis |
| Find out the enriched GO biological processes and KEGG pathways involved in transition from healthy to precancer to cancer |
| Tissue | Disease Stage | Enriched GO biological Processes |
| Colorectum | AD |  |
| Colorectum | SER |  |
| Colorectum | MSS |  |
| Colorectum | MSI-H |  |
| Colorectum | FAP |  |
| ∗Top 15 enriched GO BP terms are showed in the bar plot of each disease state in each tissue. Each row represents a significant GO biological process which is colored according to the -log10(p.adjust). |
| Page: 1 2 3 4 5 6 7 8 9 |
| GO ID | Tissue | Disease Stage | Description | Gene Ratio | Bg Ratio | pvalue | p.adjust | Count |
| GO:0030004 | Colorectum | AD | cellular monovalent inorganic cation homeostasis | 36/3918 | 103/18723 | 6.80e-04 | 6.95e-03 | 36 |
| GO:0030641 | Colorectum | AD | regulation of cellular pH | 29/3918 | 81/18723 | 1.42e-03 | 1.22e-02 | 29 |
| GO:0051453 | Colorectum | AD | regulation of intracellular pH | 26/3918 | 75/18723 | 4.04e-03 | 2.82e-02 | 26 |
| GO:0006885 | Colorectum | AD | regulation of pH | 30/3918 | 91/18723 | 4.95e-03 | 3.32e-02 | 30 |
| GO:0055067 | Colorectum | AD | monovalent inorganic cation homeostasis | 45/3918 | 151/18723 | 6.19e-03 | 3.88e-02 | 45 |
| GO:00300041 | Colorectum | SER | cellular monovalent inorganic cation homeostasis | 31/2897 | 103/18723 | 1.31e-04 | 2.66e-03 | 31 |
| GO:00306411 | Colorectum | SER | regulation of cellular pH | 24/2897 | 81/18723 | 9.20e-04 | 1.11e-02 | 24 |
| GO:00550671 | Colorectum | SER | monovalent inorganic cation homeostasis | 37/2897 | 151/18723 | 2.48e-03 | 2.33e-02 | 37 |
| GO:00514531 | Colorectum | SER | regulation of intracellular pH | 21/2897 | 75/18723 | 3.97e-03 | 3.26e-02 | 21 |
| GO:00068851 | Colorectum | SER | regulation of pH | 24/2897 | 91/18723 | 5.03e-03 | 3.88e-02 | 24 |
| GO:00300042 | Colorectum | MSS | cellular monovalent inorganic cation homeostasis | 31/3467 | 103/18723 | 2.94e-03 | 2.27e-02 | 31 |
| GO:00306412 | Colorectum | MSS | regulation of cellular pH | 25/3467 | 81/18723 | 4.97e-03 | 3.46e-02 | 25 |
| GO:00300043 | Colorectum | FAP | cellular monovalent inorganic cation homeostasis | 28/2622 | 103/18723 | 3.23e-04 | 4.15e-03 | 28 |
| GO:00514532 | Colorectum | FAP | regulation of intracellular pH | 22/2622 | 75/18723 | 4.38e-04 | 5.21e-03 | 22 |
| GO:00306413 | Colorectum | FAP | regulation of cellular pH | 22/2622 | 81/18723 | 1.37e-03 | 1.24e-02 | 22 |
| GO:00550672 | Colorectum | FAP | monovalent inorganic cation homeostasis | 35/2622 | 151/18723 | 1.58e-03 | 1.40e-02 | 35 |
| GO:00068852 | Colorectum | FAP | regulation of pH | 23/2622 | 91/18723 | 3.00e-03 | 2.27e-02 | 23 |
| GO:00514533 | Colorectum | CRC | regulation of intracellular pH | 17/2078 | 75/18723 | 3.04e-03 | 2.71e-02 | 17 |
| GO:00300044 | Colorectum | CRC | cellular monovalent inorganic cation homeostasis | 21/2078 | 103/18723 | 4.15e-03 | 3.40e-02 | 21 |
| GO:00306414 | Colorectum | CRC | regulation of cellular pH | 17/2078 | 81/18723 | 6.93e-03 | 4.85e-02 | 17 |
| Page: 1 2 |
| Pathway ID | Tissue | Disease Stage | Description | Gene Ratio | Bg Ratio | pvalue | p.adjust | qvalue | Count |
| hsa04142 | Colorectum | SER | Lysosome | 38/1580 | 132/8465 | 2.87e-03 | 2.03e-02 | 1.47e-02 | 38 |
| hsa041421 | Colorectum | SER | Lysosome | 38/1580 | 132/8465 | 2.87e-03 | 2.03e-02 | 1.47e-02 | 38 |
| hsa0414222 | Esophagus | ESCC | Lysosome | 102/4205 | 132/8465 | 5.11e-11 | 7.13e-10 | 3.65e-10 | 102 |
| hsa0414232 | Esophagus | ESCC | Lysosome | 102/4205 | 132/8465 | 5.11e-11 | 7.13e-10 | 3.65e-10 | 102 |
| hsa041424 | Liver | Cirrhotic | Lysosome | 68/2530 | 132/8465 | 1.34e-07 | 1.97e-06 | 1.21e-06 | 68 |
| hsa0414211 | Liver | Cirrhotic | Lysosome | 68/2530 | 132/8465 | 1.34e-07 | 1.97e-06 | 1.21e-06 | 68 |
| hsa041422 | Liver | HCC | Lysosome | 100/4020 | 132/8465 | 2.32e-11 | 4.31e-10 | 2.40e-10 | 100 |
| hsa041423 | Liver | HCC | Lysosome | 100/4020 | 132/8465 | 2.32e-11 | 4.31e-10 | 2.40e-10 | 100 |
| Page: 1 |
Top |
Cell-cell communication analysis |
| Identification of potential cell-cell interactions between two cell types and their ligand-receptor pairs for different disease states |
| Ligand | Receptor | LRpair | Pathway | Tissue | Disease Stage |
| Page: 1 |
Top |
Single-cell gene regulatory network inference analysis |
| Find out the significant the regulons (TFs) and the target genes of each regulon across cell types for different disease states |
| TF | Cell Type | Tissue | Disease Stage | Target Gene | RSS | Regulon Activity |
| ∗The dot plots of a searched regulon are shown for all cell subpopulations in each disease state of each tissue based on the regulon specific score inferred using pySCENIC and by calculating the average expression. |
| Page: 1 |
Top |
Somatic mutation of malignant transformation related genes |
| Annotation of somatic variants for genes involved in malignant transformation |
| Hugo Symbol | Variant Class | Variant Classification | dbSNP RS | HGVSc | HGVSp | HGVSp Short | SWISSPROT | BIOTYPE | SIFT | PolyPhen | Tumor Sample Barcode | Tissue | Histology | Sex | Age | Stage | Therapy Types | Drugs | Outcome |
| DMXL1 | SNV | Missense_Mutation | novel | c.5837N>G | p.Ser1946Cys | p.S1946C | protein_coding | deleterious(0) | probably_damaging(0.991) | TCGA-A2-A25A-01 | Breast | breast invasive carcinoma | Female | <65 | I/II | Unspecific | Cytoxan | SD | |
| DMXL1 | SNV | Missense_Mutation | novel | c.2126N>T | p.Arg709Met | p.R709M | protein_coding | deleterious(0) | probably_damaging(0.996) | TCGA-A7-A0DB-01 | Breast | breast invasive carcinoma | Female | <65 | I/II | Hormone Therapy | arimidex | SD | |
| DMXL1 | SNV | Missense_Mutation | c.7163A>G | p.Lys2388Arg | p.K2388R | protein_coding | tolerated(0.27) | benign(0.001) | TCGA-A8-A092-01 | Breast | breast invasive carcinoma | Female | <65 | III/IV | Chemotherapy | paclitaxel | CR | ||
| DMXL1 | SNV | Missense_Mutation | c.3946N>T | p.His1316Tyr | p.H1316Y | protein_coding | deleterious(0) | benign(0.069) | TCGA-AC-A23H-01 | Breast | breast invasive carcinoma | Female | >=65 | I/II | Unknown | Unknown | PD | ||
| DMXL1 | SNV | Missense_Mutation | c.6446N>A | p.Ser2149Tyr | p.S2149Y | protein_coding | deleterious(0) | probably_damaging(0.997) | TCGA-AC-A23H-01 | Breast | breast invasive carcinoma | Female | >=65 | I/II | Unknown | Unknown | PD | ||
| DMXL1 | SNV | Missense_Mutation | novel | c.7333N>G | p.Gln2445Glu | p.Q2445E | protein_coding | tolerated(0.75) | benign(0.009) | TCGA-AC-A5XS-01 | Breast | breast invasive carcinoma | Female | >=65 | I/II | Hormone Therapy | femara | SD | |
| DMXL1 | SNV | Missense_Mutation | c.8442G>C | p.Met2814Ile | p.M2814I | protein_coding | tolerated(0.86) | benign(0.007) | TCGA-AN-A0XW-01 | Breast | breast invasive carcinoma | Female | <65 | III/IV | Unknown | Unknown | SD | ||
| DMXL1 | SNV | Missense_Mutation | c.8554N>C | p.Tyr2852His | p.Y2852H | protein_coding | deleterious(0) | probably_damaging(0.982) | TCGA-AO-A124-01 | Breast | breast invasive carcinoma | Female | <65 | I/II | Chemotherapy | doxorubicin | SD | ||
| DMXL1 | SNV | Missense_Mutation | novel | c.535G>T | p.Asp179Tyr | p.D179Y | protein_coding | deleterious(0) | probably_damaging(1) | TCGA-AR-A1AJ-01 | Breast | breast invasive carcinoma | Female | >=65 | I/II | Unknown | Unknown | SD | |
| DMXL1 | SNV | Missense_Mutation | c.1321N>A | p.Asp441Asn | p.D441N | protein_coding | tolerated(0.06) | possibly_damaging(0.52) | TCGA-BH-A0HP-01 | Breast | breast invasive carcinoma | Female | >=65 | III/IV | Chemotherapy | doxorubicin | SD |
| Page: 1 2 3 4 5 6 7 8 9 10 11 12 13 14 15 16 17 18 19 20 21 22 23 24 25 26 27 28 29 30 31 32 |
Top |
Related drugs of malignant transformation related genes |
| Identification of chemicals and drugs interact with genes involved in malignant transfromation |
| (DGIdb 4.0) |
| Entrez ID | Symbol | Category | Interaction Types | Drug Claim Name | Drug Name | PMIDs |
| Page: 1 |

Copyright 2023-Present -The University of Texas Health Science Center at Houston |