
|
|||||
|
 | |
| |
| |
| |
| |
| |
|
Gene: DMTN |
Gene summary for DMTN |
| Gene information | Species | Human | Gene symbol | DMTN | Gene ID | 2039 |
| Gene name | dematin actin binding protein | |
| Gene Alias | DMT | |
| Cytomap | 8p21.3 | |
| Gene Type | protein-coding | GO ID | GO:0000902 | UniProtAcc | Q08495 |
Top |
Malignant transformation analysis |
| Identification of the aberrant gene expression in precancerous and cancerous lesions by comparing the gene expression of stem-like cells in diseased tissues with normal stem cells |
| Entrez ID | Symbol | Replicates | Species | Organ | Tissue | Adj P-value | Log2FC | Malignancy |
| 2039 | DMTN | HCC1_Meng | Human | Liver | HCC | 1.68e-20 | 4.39e-02 | 0.0246 |
| 2039 | DMTN | HCC2_Meng | Human | Liver | HCC | 2.23e-23 | 1.73e-01 | 0.0107 |
| 2039 | DMTN | cirrhotic2 | Human | Liver | Cirrhotic | 2.79e-02 | 9.84e-02 | 0.0201 |
| 2039 | DMTN | HCC2 | Human | Liver | HCC | 1.52e-09 | 1.81e+00 | 0.5341 |
| 2039 | DMTN | S014 | Human | Liver | HCC | 2.86e-17 | 4.56e-01 | 0.2254 |
| 2039 | DMTN | S015 | Human | Liver | HCC | 1.33e-14 | 5.27e-01 | 0.2375 |
| 2039 | DMTN | S016 | Human | Liver | HCC | 2.57e-22 | 5.38e-01 | 0.2243 |
| 2039 | DMTN | S027 | Human | Liver | HCC | 2.74e-07 | 3.88e-01 | 0.2446 |
| 2039 | DMTN | S028 | Human | Liver | HCC | 6.26e-20 | 5.86e-01 | 0.2503 |
| 2039 | DMTN | S029 | Human | Liver | HCC | 2.07e-07 | 3.17e-01 | 0.2581 |
| Page: 1 |
| Tissue | Expression Dynamics | Abbreviation |
| Liver | 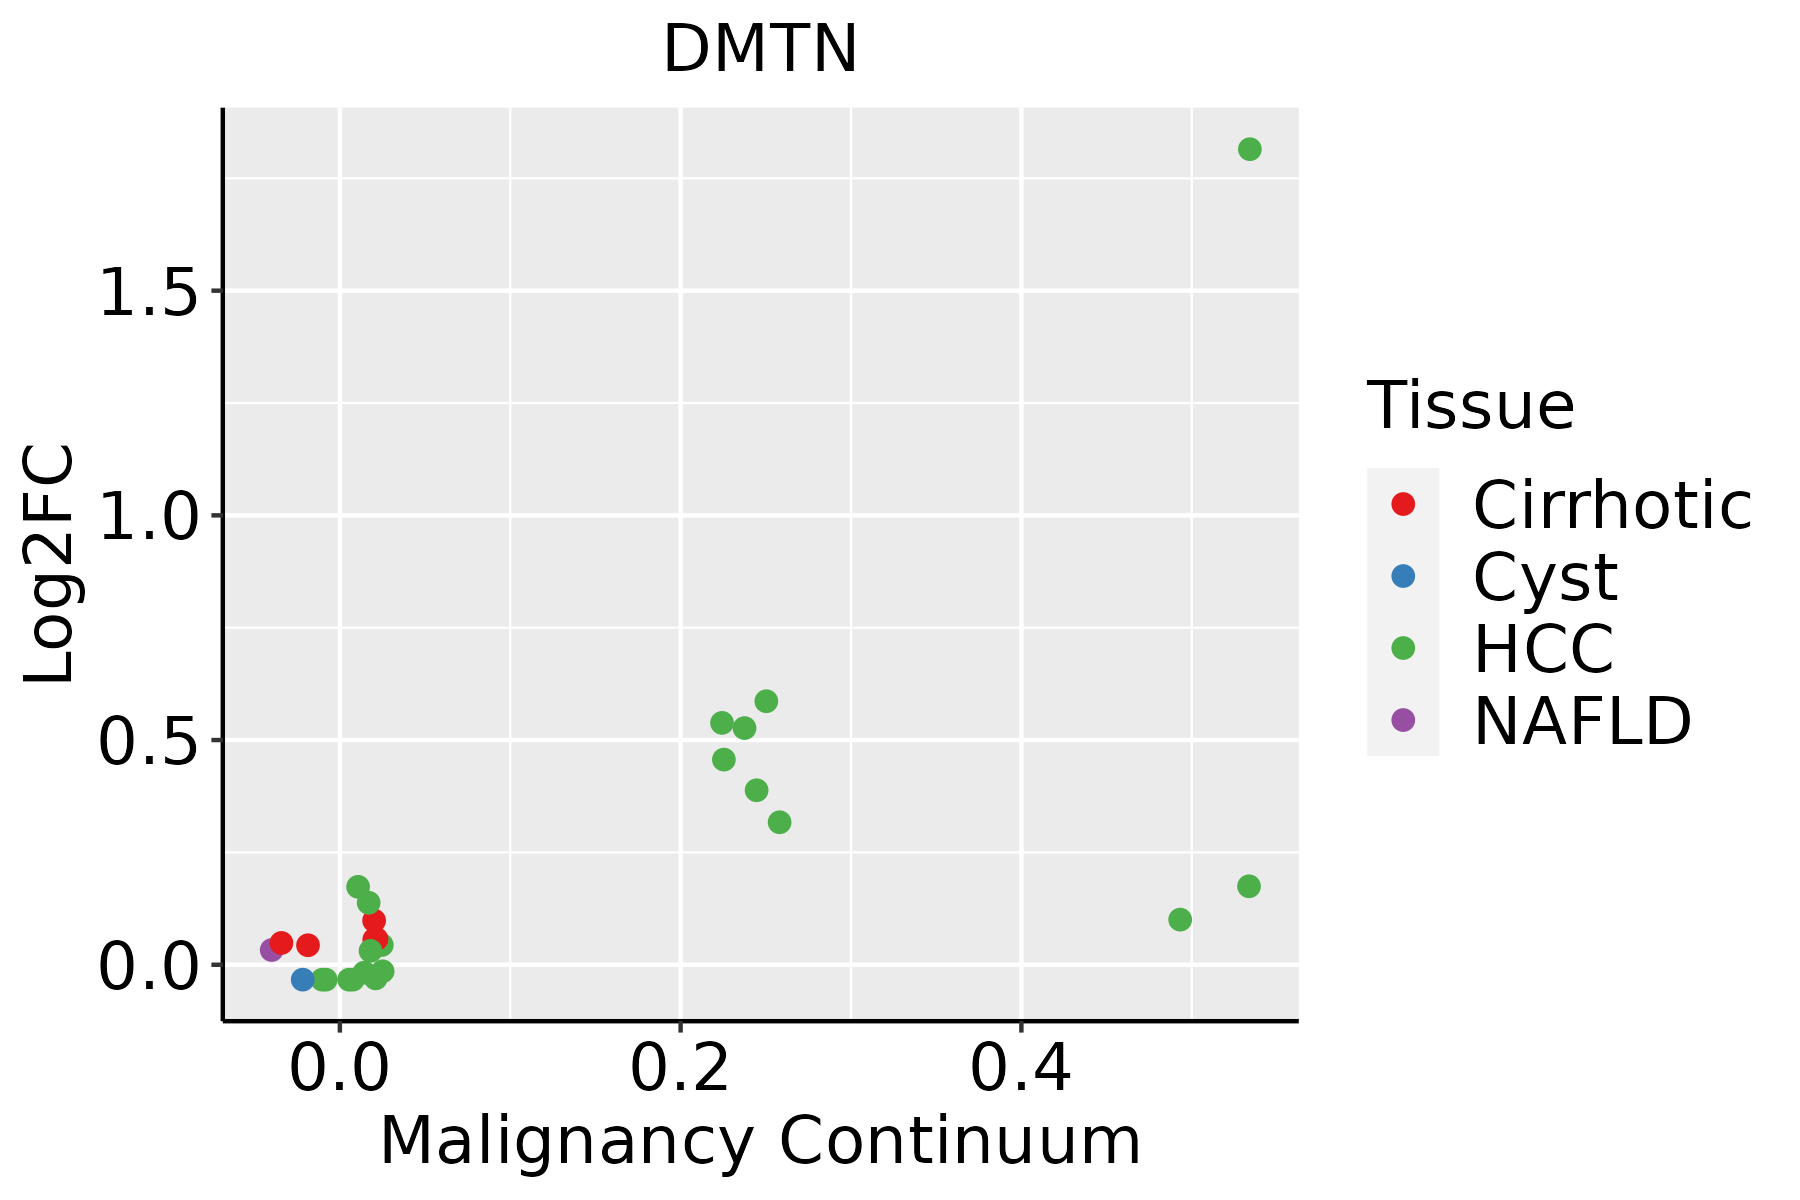 | HCC: Hepatocellular carcinoma |
| NAFLD: Non-alcoholic fatty liver disease |
| ∗log2FC in expression of this searched gene in stem-like cells from each diseased tissue sample relative to stem-like cells in normal samples in each tissue plotted against the malignancy continuum. Samples are colored based on if they are from different disease stage. |
Top |
Malignant transformation related pathway analysis |
| Find out the enriched GO biological processes and KEGG pathways involved in transition from healthy to precancer to cancer |
| Tissue | Disease Stage | Enriched GO biological Processes |
| Colorectum | AD |  |
| Colorectum | SER |  |
| Colorectum | MSS |  |
| Colorectum | MSI-H |  |
| Colorectum | FAP |  |
| ∗Top 15 enriched GO BP terms are showed in the bar plot of each disease state in each tissue. Each row represents a significant GO biological process which is colored according to the -log10(p.adjust). |
| Page: 1 2 3 4 5 6 7 8 9 |
| GO ID | Tissue | Disease Stage | Description | Gene Ratio | Bg Ratio | pvalue | p.adjust | Count |
| GO:00066057 | Liver | Cirrhotic | protein targeting | 148/4634 | 314/18723 | 3.86e-18 | 6.20e-16 | 148 |
| GO:00901507 | Liver | Cirrhotic | establishment of protein localization to membrane | 123/4634 | 260/18723 | 1.85e-15 | 2.15e-13 | 123 |
| GO:00224117 | Liver | Cirrhotic | cellular component disassembly | 182/4634 | 443/18723 | 1.59e-14 | 1.54e-12 | 182 |
| GO:003238611 | Liver | Cirrhotic | regulation of intracellular transport | 147/4634 | 337/18723 | 1.84e-14 | 1.72e-12 | 147 |
| GO:003315711 | Liver | Cirrhotic | regulation of intracellular protein transport | 108/4634 | 229/18723 | 1.23e-13 | 1.04e-11 | 108 |
| GO:004325412 | Liver | Cirrhotic | regulation of protein-containing complex assembly | 169/4634 | 428/18723 | 7.40e-12 | 4.99e-10 | 169 |
| GO:001003812 | Liver | Cirrhotic | response to metal ion | 150/4634 | 373/18723 | 2.27e-11 | 1.37e-09 | 150 |
| GO:000701512 | Liver | Cirrhotic | actin filament organization | 171/4634 | 442/18723 | 3.93e-11 | 2.30e-09 | 171 |
| GO:002260412 | Liver | Cirrhotic | regulation of cell morphogenesis | 127/4634 | 309/18723 | 1.45e-10 | 7.44e-09 | 127 |
| GO:190290312 | Liver | Cirrhotic | regulation of supramolecular fiber organization | 148/4634 | 383/18723 | 8.85e-10 | 4.08e-08 | 148 |
| GO:003297012 | Liver | Cirrhotic | regulation of actin filament-based process | 152/4634 | 397/18723 | 1.12e-09 | 5.00e-08 | 152 |
| GO:003295612 | Liver | Cirrhotic | regulation of actin cytoskeleton organization | 136/4634 | 358/18723 | 1.47e-08 | 5.49e-07 | 136 |
| GO:015011512 | Liver | Cirrhotic | cell-substrate junction organization | 51/4634 | 101/18723 | 2.08e-08 | 7.47e-07 | 51 |
| GO:004206012 | Liver | Cirrhotic | wound healing | 155/4634 | 422/18723 | 2.12e-08 | 7.56e-07 | 155 |
| GO:005125812 | Liver | Cirrhotic | protein polymerization | 116/4634 | 297/18723 | 2.87e-08 | 9.78e-07 | 116 |
| GO:000836012 | Liver | Cirrhotic | regulation of cell shape | 69/4634 | 154/18723 | 4.21e-08 | 1.36e-06 | 69 |
| GO:19054755 | Liver | Cirrhotic | regulation of protein localization to membrane | 76/4634 | 175/18723 | 4.55e-08 | 1.45e-06 | 76 |
| GO:00313337 | Liver | Cirrhotic | negative regulation of protein-containing complex assembly | 64/4634 | 141/18723 | 7.08e-08 | 2.14e-06 | 64 |
| GO:005101712 | Liver | Cirrhotic | actin filament bundle assembly | 69/4634 | 157/18723 | 1.06e-07 | 3.05e-06 | 69 |
| GO:011005312 | Liver | Cirrhotic | regulation of actin filament organization | 108/4634 | 278/18723 | 1.17e-07 | 3.32e-06 | 108 |
| Page: 1 2 3 4 5 6 7 8 9 10 11 12 |
| Pathway ID | Tissue | Disease Stage | Description | Gene Ratio | Bg Ratio | pvalue | p.adjust | qvalue | Count |
| Page: 1 |
Top |
Cell-cell communication analysis |
| Identification of potential cell-cell interactions between two cell types and their ligand-receptor pairs for different disease states |
| Ligand | Receptor | LRpair | Pathway | Tissue | Disease Stage |
| Page: 1 |
Top |
Single-cell gene regulatory network inference analysis |
| Find out the significant the regulons (TFs) and the target genes of each regulon across cell types for different disease states |
| TF | Cell Type | Tissue | Disease Stage | Target Gene | RSS | Regulon Activity |
| ∗The dot plots of a searched regulon are shown for all cell subpopulations in each disease state of each tissue based on the regulon specific score inferred using pySCENIC and by calculating the average expression. |
| Page: 1 |
Top |
Somatic mutation of malignant transformation related genes |
| Annotation of somatic variants for genes involved in malignant transformation |
| Hugo Symbol | Variant Class | Variant Classification | dbSNP RS | HGVSc | HGVSp | HGVSp Short | SWISSPROT | BIOTYPE | SIFT | PolyPhen | Tumor Sample Barcode | Tissue | Histology | Sex | Age | Stage | Therapy Types | Drugs | Outcome |
| DMTN | SNV | Missense_Mutation | c.787A>T | p.Ile263Phe | p.I263F | Q08495 | protein_coding | tolerated(0.23) | possibly_damaging(0.593) | TCGA-AR-A1AV-01 | Breast | breast invasive carcinoma | Male | >=65 | I/II | Chemotherapy | cytoxan | SD | |
| DMTN | SNV | Missense_Mutation | rs750730863 | c.1079C>T | p.Pro360Leu | p.P360L | Q08495 | protein_coding | tolerated(0.09) | probably_damaging(0.998) | TCGA-D8-A1JN-01 | Breast | breast invasive carcinoma | Female | >=65 | III/IV | Hormone Therapy | anastrozolum | SD |
| DMTN | insertion | Frame_Shift_Ins | novel | c.848_849insGATTTTAGTTTTCTTTGTGT | p.Thr284IlefsTer7 | p.T284Ifs*7 | Q08495 | protein_coding | TCGA-A8-A093-01 | Breast | breast invasive carcinoma | Female | <65 | I/II | Hormone Therapy | tamoxiphen | SD | ||
| DMTN | insertion | Nonsense_Mutation | novel | c.755_756insACATTCAAGTGTCTAAGTCTTGGCTCCATCTTCCTTTCTC | p.Leu253HisfsTer5 | p.L253Hfs*5 | Q08495 | protein_coding | TCGA-BH-A0E7-01 | Breast | breast invasive carcinoma | Female | >=65 | I/II | Hormone Therapy | arimidex | SD | ||
| DMTN | deletion | Frame_Shift_Del | novel | c.731delN | p.Thr245LeufsTer7 | p.T245Lfs*7 | Q08495 | protein_coding | TCGA-D8-A27V-01 | Breast | breast invasive carcinoma | Female | <65 | I/II | Hormone Therapy | tamoxiphen | SD | ||
| DMTN | SNV | Missense_Mutation | c.568N>A | p.Asp190Asn | p.D190N | Q08495 | protein_coding | deleterious(0.02) | probably_damaging(0.99) | TCGA-EK-A2RA-01 | Cervix | cervical & endocervical cancer | Female | >=65 | I/II | Unknown | Unknown | SD | |
| DMTN | SNV | Missense_Mutation | c.871N>T | p.Pro291Ser | p.P291S | Q08495 | protein_coding | deleterious(0.05) | possibly_damaging(0.796) | TCGA-AA-3672-01 | Colorectum | colon adenocarcinoma | Female | >=65 | III/IV | Unknown | Unknown | SD | |
| DMTN | SNV | Missense_Mutation | rs534685259 | c.226G>A | p.Val76Met | p.V76M | Q08495 | protein_coding | tolerated(0.1) | benign(0.403) | TCGA-NH-A8F8-01 | Colorectum | colon adenocarcinoma | Male | >=65 | III/IV | Chemotherapy | fluorouracil | PD |
| DMTN | SNV | Missense_Mutation | novel | c.131N>C | p.Leu44Pro | p.L44P | Q08495 | protein_coding | deleterious(0) | possibly_damaging(0.694) | TCGA-F5-6814-01 | Colorectum | rectum adenocarcinoma | Male | <65 | I/II | Unknown | Unknown | SD |
| DMTN | deletion | Frame_Shift_Del | c.359delN | p.Arg122GlyfsTer109 | p.R122Gfs*109 | Q08495 | protein_coding | TCGA-AZ-6598-01 | Colorectum | colon adenocarcinoma | Female | >=65 | I/II | Unknown | Unknown | SD |
| Page: 1 2 3 4 5 6 |
Top |
Related drugs of malignant transformation related genes |
| Identification of chemicals and drugs interact with genes involved in malignant transfromation |
| (DGIdb 4.0) |
| Entrez ID | Symbol | Category | Interaction Types | Drug Claim Name | Drug Name | PMIDs |
| Page: 1 |

Copyright 2023-Present -The University of Texas Health Science Center at Houston |