
|
|||||
|
 | |
| |
| |
| |
| |
| |
|
Gene: DMTF1 |
Gene summary for DMTF1 |
| Gene information | Species | Human | Gene symbol | DMTF1 | Gene ID | 9988 |
| Gene name | cyclin D binding myb like transcription factor 1 | |
| Gene Alias | DMP1 | |
| Cytomap | 7q21.12 | |
| Gene Type | protein-coding | GO ID | GO:0006139 | UniProtAcc | B3KMJ8 |
Top |
Malignant transformation analysis |
| Identification of the aberrant gene expression in precancerous and cancerous lesions by comparing the gene expression of stem-like cells in diseased tissues with normal stem cells |
| Entrez ID | Symbol | Replicates | Species | Organ | Tissue | Adj P-value | Log2FC | Malignancy |
| 9988 | DMTF1 | LZE4T | Human | Esophagus | ESCC | 4.27e-08 | 1.47e-01 | 0.0811 |
| 9988 | DMTF1 | LZE5T | Human | Esophagus | ESCC | 8.37e-04 | 2.90e-01 | 0.0514 |
| 9988 | DMTF1 | LZE7T | Human | Esophagus | ESCC | 5.89e-11 | 4.16e-01 | 0.0667 |
| 9988 | DMTF1 | LZE20T | Human | Esophagus | ESCC | 4.35e-07 | 1.73e-01 | 0.0662 |
| 9988 | DMTF1 | LZE24T | Human | Esophagus | ESCC | 3.68e-14 | 2.00e-01 | 0.0596 |
| 9988 | DMTF1 | P1T-E | Human | Esophagus | ESCC | 9.63e-06 | 2.67e-01 | 0.0875 |
| 9988 | DMTF1 | P2T-E | Human | Esophagus | ESCC | 9.31e-18 | 2.70e-01 | 0.1177 |
| 9988 | DMTF1 | P4T-E | Human | Esophagus | ESCC | 1.47e-06 | 2.46e-01 | 0.1323 |
| 9988 | DMTF1 | P5T-E | Human | Esophagus | ESCC | 3.89e-11 | 1.39e-01 | 0.1327 |
| 9988 | DMTF1 | P8T-E | Human | Esophagus | ESCC | 7.39e-15 | 2.21e-01 | 0.0889 |
| 9988 | DMTF1 | P9T-E | Human | Esophagus | ESCC | 1.65e-14 | 2.14e-01 | 0.1131 |
| 9988 | DMTF1 | P10T-E | Human | Esophagus | ESCC | 1.26e-21 | 4.09e-01 | 0.116 |
| 9988 | DMTF1 | P11T-E | Human | Esophagus | ESCC | 2.99e-15 | 2.48e-01 | 0.1426 |
| 9988 | DMTF1 | P12T-E | Human | Esophagus | ESCC | 7.40e-24 | 4.11e-01 | 0.1122 |
| 9988 | DMTF1 | P15T-E | Human | Esophagus | ESCC | 1.24e-17 | 3.88e-01 | 0.1149 |
| 9988 | DMTF1 | P16T-E | Human | Esophagus | ESCC | 1.14e-42 | 7.36e-01 | 0.1153 |
| 9988 | DMTF1 | P17T-E | Human | Esophagus | ESCC | 6.28e-05 | 1.61e-01 | 0.1278 |
| 9988 | DMTF1 | P20T-E | Human | Esophagus | ESCC | 8.74e-18 | 4.33e-01 | 0.1124 |
| 9988 | DMTF1 | P21T-E | Human | Esophagus | ESCC | 3.09e-17 | 2.71e-01 | 0.1617 |
| 9988 | DMTF1 | P22T-E | Human | Esophagus | ESCC | 7.25e-20 | 2.07e-01 | 0.1236 |
| Page: 1 2 3 4 5 |
| Tissue | Expression Dynamics | Abbreviation |
| Esophagus |  | ESCC: Esophageal squamous cell carcinoma |
| HGIN: High-grade intraepithelial neoplasias | ||
| LGIN: Low-grade intraepithelial neoplasias | ||
| Lung | 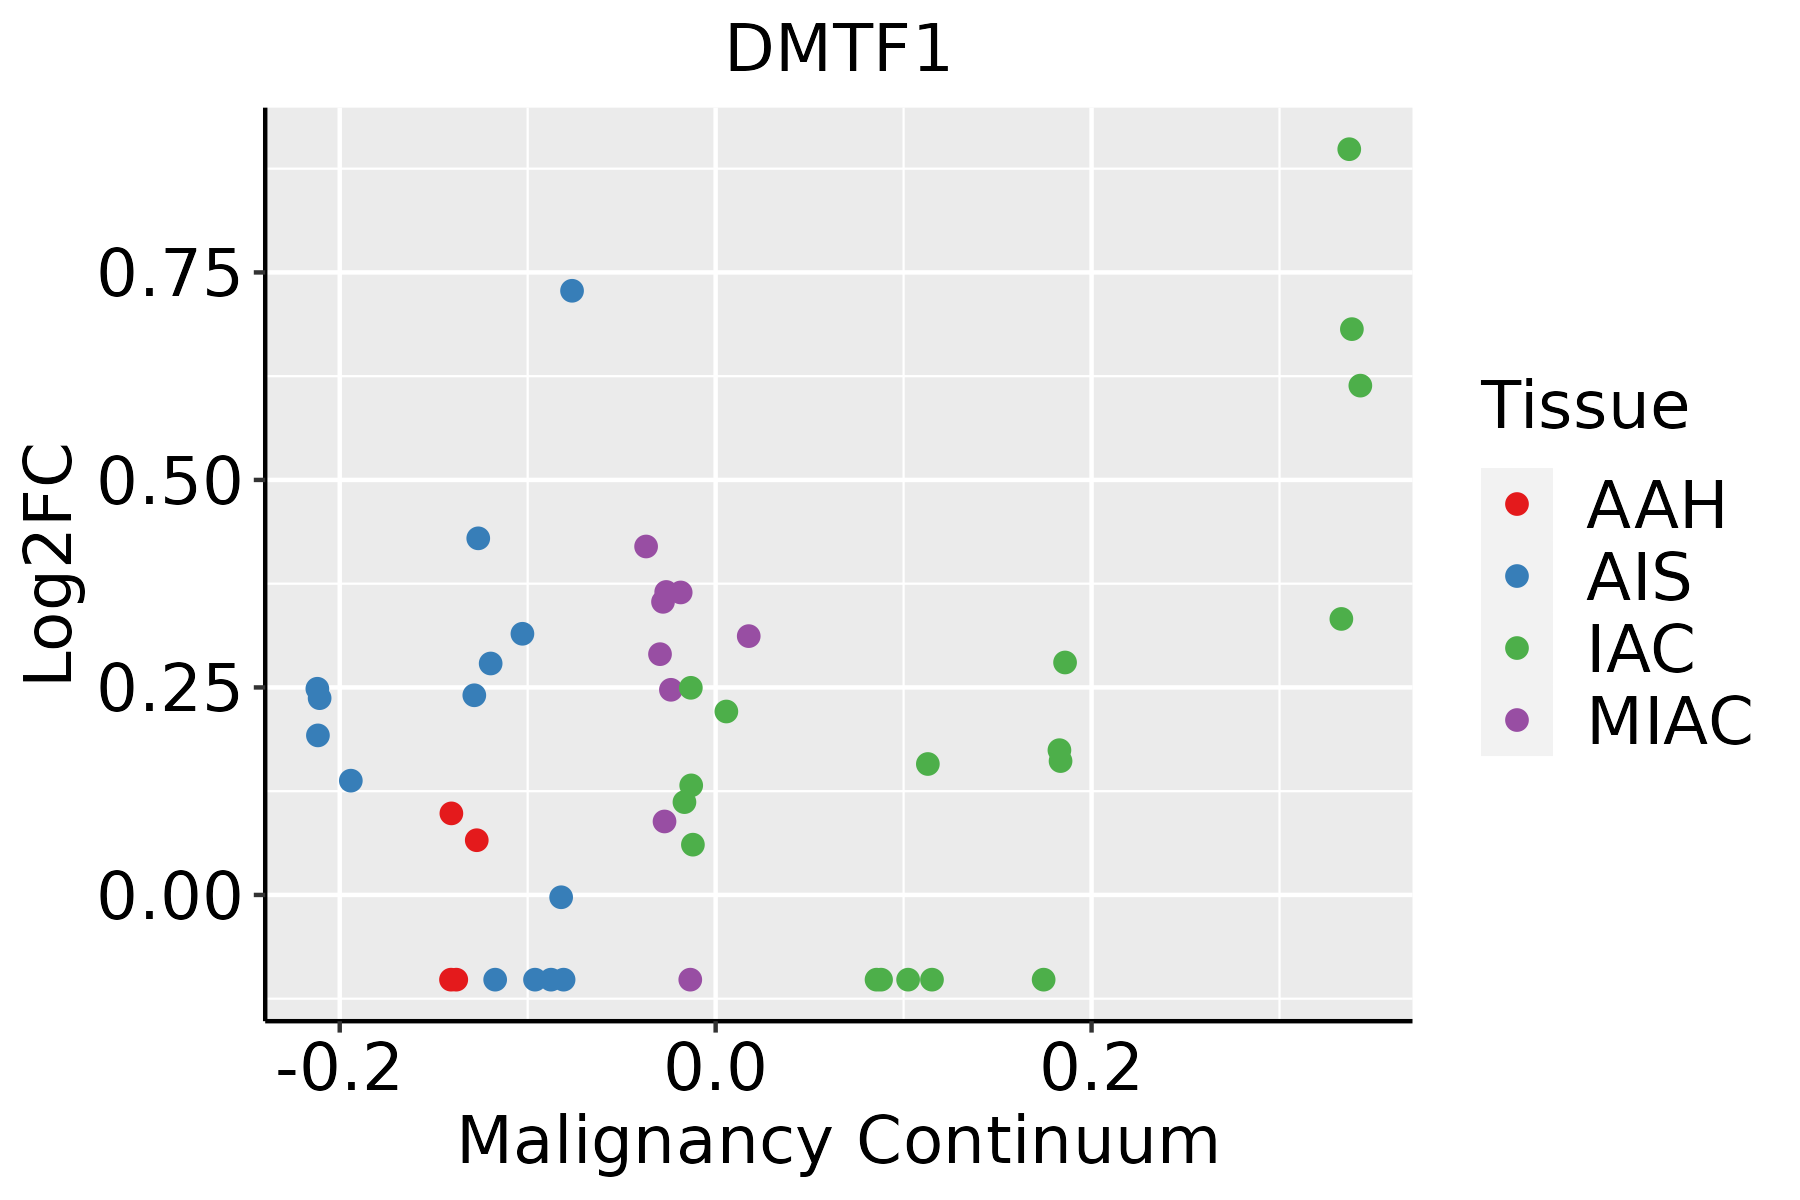 | AAH: Atypical adenomatous hyperplasia |
| AIS: Adenocarcinoma in situ | ||
| IAC: Invasive lung adenocarcinoma | ||
| MIA: Minimally invasive adenocarcinoma | ||
| Prostate | 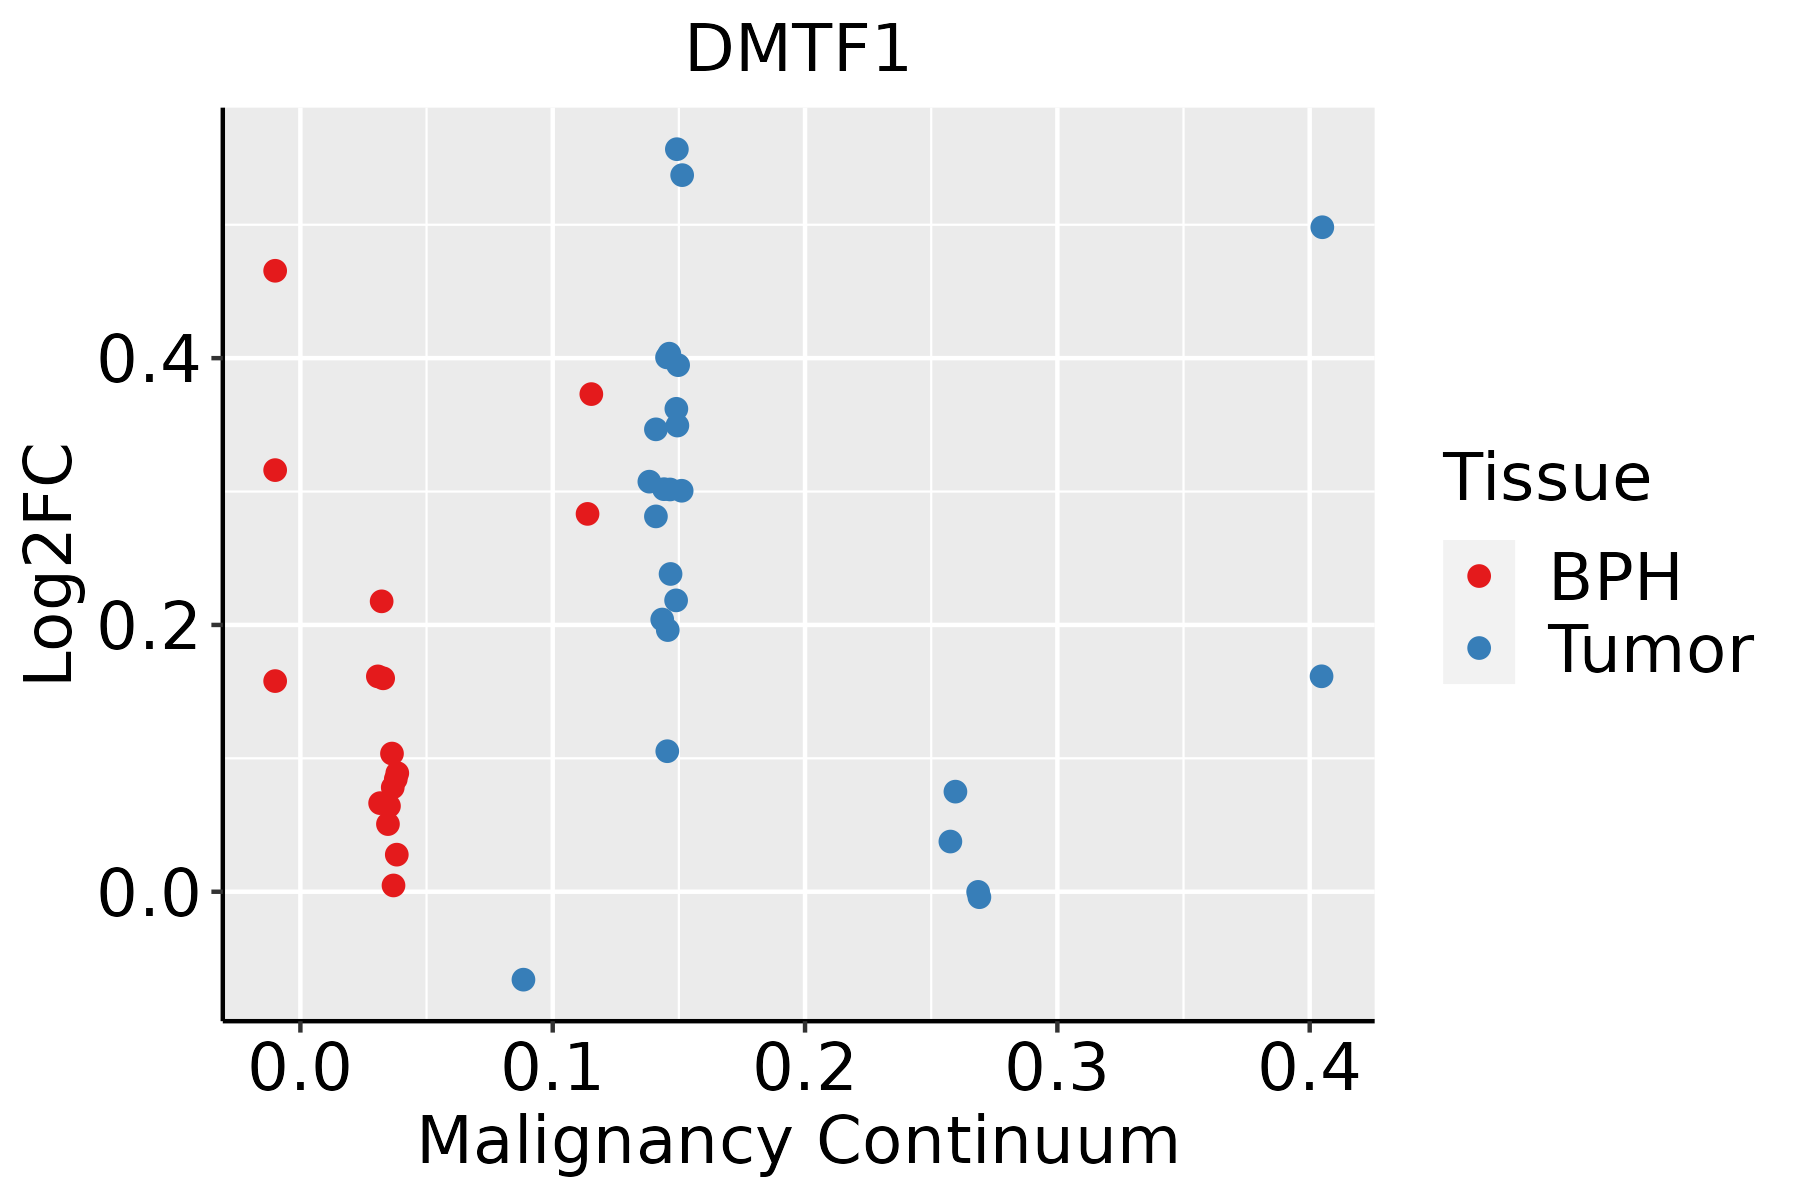 | BPH: Benign Prostatic Hyperplasia |
| Thyroid | 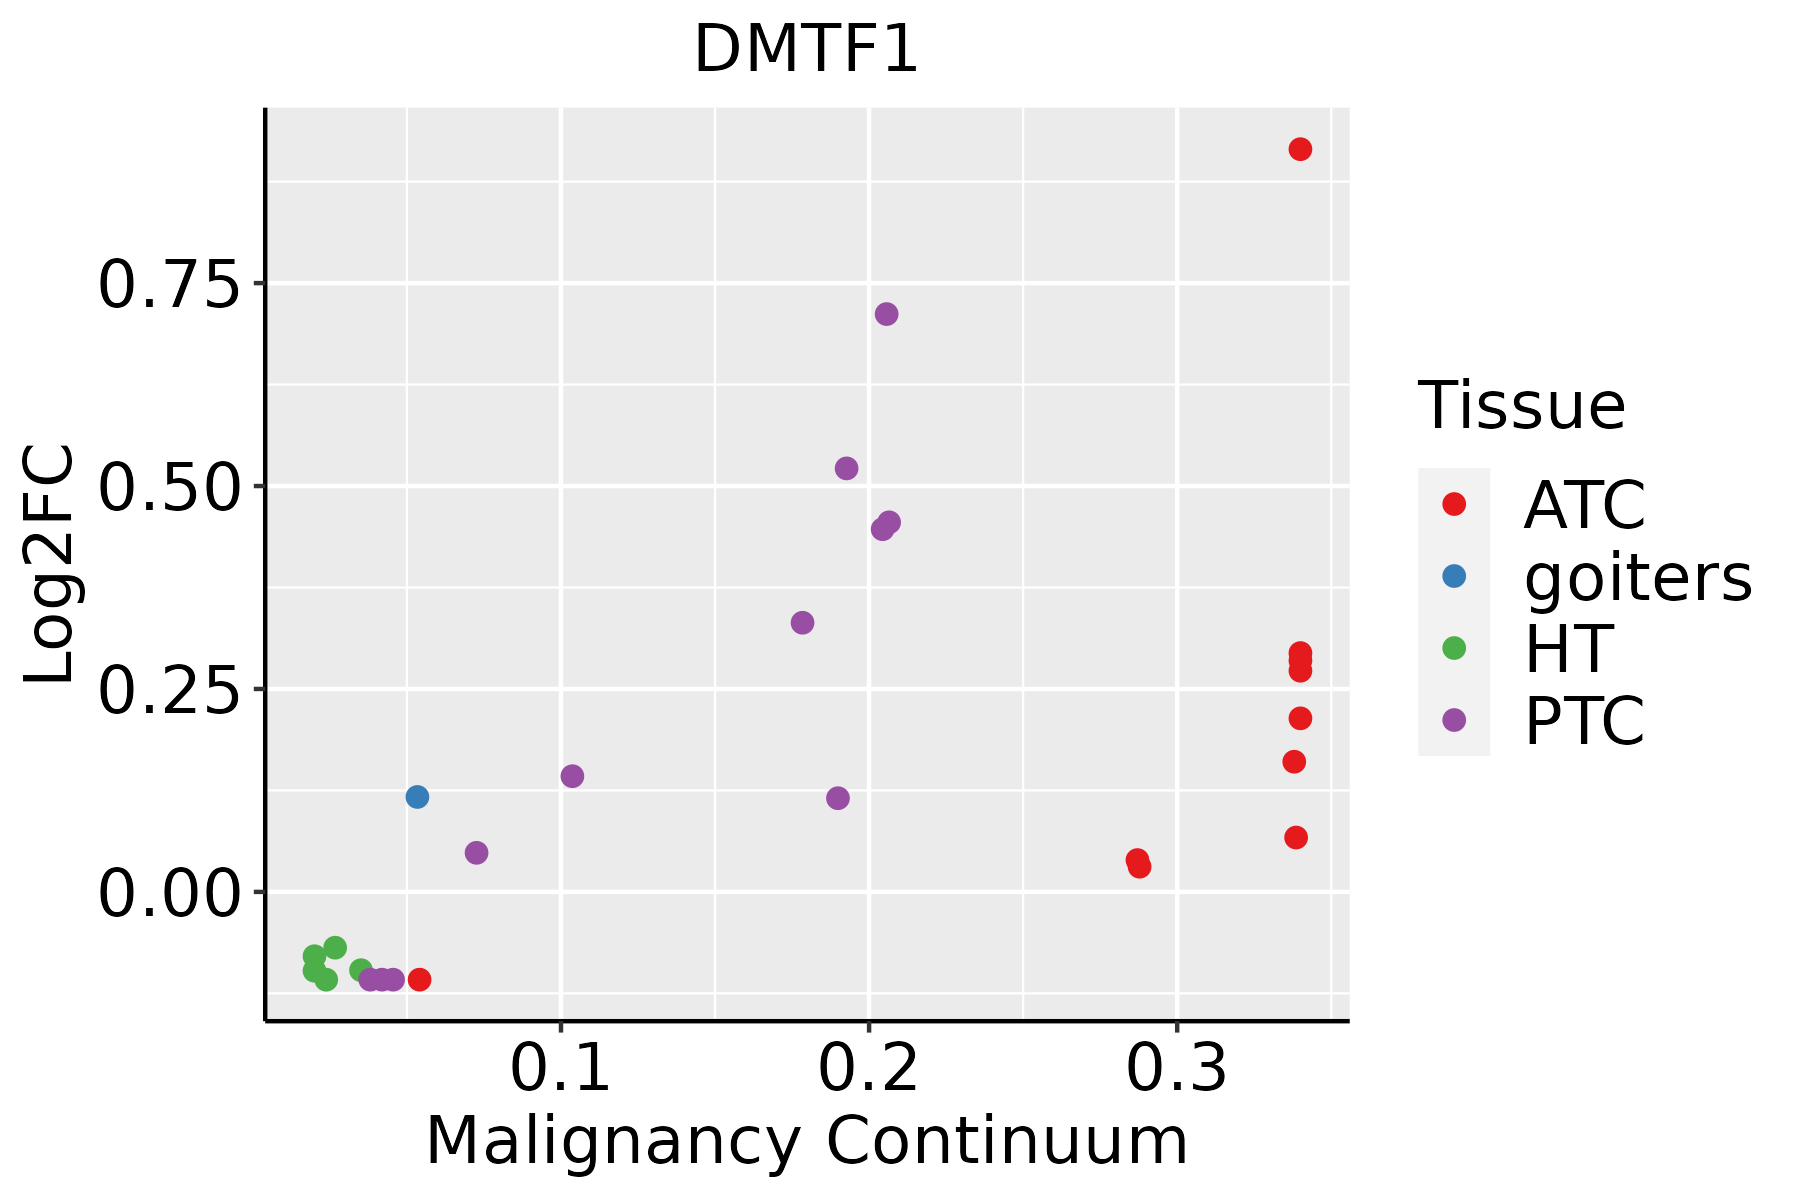 | ATC: Anaplastic thyroid cancer |
| HT: Hashimoto's thyroiditis | ||
| PTC: Papillary thyroid cancer |
| ∗log2FC in expression of this searched gene in stem-like cells from each diseased tissue sample relative to stem-like cells in normal samples in each tissue plotted against the malignancy continuum. Samples are colored based on if they are from different disease stage. |
Top |
Malignant transformation related pathway analysis |
| Find out the enriched GO biological processes and KEGG pathways involved in transition from healthy to precancer to cancer |
| Tissue | Disease Stage | Enriched GO biological Processes |
| Colorectum | AD |  |
| Colorectum | SER |  |
| Colorectum | MSS |  |
| Colorectum | MSI-H |  |
| Colorectum | FAP |  |
| ∗Top 15 enriched GO BP terms are showed in the bar plot of each disease state in each tissue. Each row represents a significant GO biological process which is colored according to the -log10(p.adjust). |
| Page: 1 2 3 4 5 6 7 8 9 |
| GO ID | Tissue | Disease Stage | Description | Gene Ratio | Bg Ratio | pvalue | p.adjust | Count |
| Page: 1 |
| Pathway ID | Tissue | Disease Stage | Description | Gene Ratio | Bg Ratio | pvalue | p.adjust | qvalue | Count |
| Page: 1 |
Top |
Cell-cell communication analysis |
| Identification of potential cell-cell interactions between two cell types and their ligand-receptor pairs for different disease states |
| Ligand | Receptor | LRpair | Pathway | Tissue | Disease Stage |
| Page: 1 |
Top |
Single-cell gene regulatory network inference analysis |
| Find out the significant the regulons (TFs) and the target genes of each regulon across cell types for different disease states |
| TF | Cell Type | Tissue | Disease Stage | Target Gene | RSS | Regulon Activity |
| ∗The dot plots of a searched regulon are shown for all cell subpopulations in each disease state of each tissue based on the regulon specific score inferred using pySCENIC and by calculating the average expression. |
| Page: 1 |
Top |
Somatic mutation of malignant transformation related genes |
| Annotation of somatic variants for genes involved in malignant transformation |
| Hugo Symbol | Variant Class | Variant Classification | dbSNP RS | HGVSc | HGVSp | HGVSp Short | SWISSPROT | BIOTYPE | SIFT | PolyPhen | Tumor Sample Barcode | Tissue | Histology | Sex | Age | Stage | Therapy Types | Drugs | Outcome |
| DMTF1 | SNV | Missense_Mutation | rs767321632 | c.1856N>G | p.Pro619Arg | p.P619R | Q9Y222 | protein_coding | deleterious_low_confidence(0.02) | benign(0.015) | TCGA-BH-A8FZ-01 | Breast | breast invasive carcinoma | Female | <65 | I/II | Unknown | Unknown | SD |
| DMTF1 | insertion | Nonsense_Mutation | novel | c.60_61insCTTTGCATGTTCTAGATCTGAATCCCTTGTTGGTTTTAGATG | p.Leu21_Thr22insCysMetPheTerIleTerIleProCysTrpPheTerMetLeu | p.L21_T22insCMF*I*IPCWF*ML | Q9Y222 | protein_coding | TCGA-AN-A0FX-01 | Breast | breast invasive carcinoma | Female | <65 | I/II | Unknown | Unknown | SD | ||
| DMTF1 | insertion | Frame_Shift_Ins | novel | c.1530_1531insCCTCTTTTTCT | p.Tyr511ProfsTer17 | p.Y511Pfs*17 | Q9Y222 | protein_coding | TCGA-AR-A0U0-01 | Breast | breast invasive carcinoma | Female | >=65 | I/II | Unknown | Unknown | SD | ||
| DMTF1 | insertion | Nonsense_Mutation | novel | c.1490_1491insGCTTTGAGGGAATTTTCTGTAGATTTTCTTTTTAGC | p.Leu497_Pro498insLeuTerGlyAsnPheLeuTerIlePhePheLeuAla | p.L497_P498insL*GNFL*IFFLA | Q9Y222 | protein_coding | TCGA-BH-A0DZ-01 | Breast | breast invasive carcinoma | Female | <65 | I/II | Chemotherapy | docetaxel | SD | ||
| DMTF1 | deletion | Frame_Shift_Del | novel | c.2253delN | p.Asp752MetfsTer6 | p.D752Mfs*6 | Q9Y222 | protein_coding | TCGA-EW-A2FV-01 | Breast | breast invasive carcinoma | Female | <65 | III/IV | Chemotherapy | docetaxel | SD | ||
| DMTF1 | SNV | Missense_Mutation | rs149748596 | c.1774G>A | p.Asp592Asn | p.D592N | Q9Y222 | protein_coding | tolerated_low_confidence(0.18) | possibly_damaging(0.548) | TCGA-2W-A8YY-01 | Cervix | cervical & endocervical cancer | Female | <65 | I/II | Chemotherapy | cisplatin | CR |
| DMTF1 | SNV | Missense_Mutation | novel | c.1706N>A | p.Arg569Lys | p.R569K | Q9Y222 | protein_coding | tolerated(0.26) | benign(0.001) | TCGA-VS-A94Y-01 | Cervix | cervical & endocervical cancer | Female | <65 | I/II | Chemotherapy | cisplatin | PD |
| DMTF1 | SNV | Missense_Mutation | c.794G>A | p.Arg265Gln | p.R265Q | Q9Y222 | protein_coding | deleterious(0.02) | probably_damaging(0.914) | TCGA-AA-3655-01 | Colorectum | colon adenocarcinoma | Male | >=65 | I/II | Unknown | Unknown | SD | |
| DMTF1 | SNV | Missense_Mutation | c.1481N>A | p.Phe494Tyr | p.F494Y | Q9Y222 | protein_coding | tolerated(0.14) | benign(0.112) | TCGA-G4-6304-01 | Colorectum | colon adenocarcinoma | Female | >=65 | I/II | Chemotherapy | fluorouracil | PD | |
| DMTF1 | SNV | Missense_Mutation | rs559006713 | c.508C>T | p.Arg170Cys | p.R170C | Q9Y222 | protein_coding | deleterious(0.01) | possibly_damaging(0.844) | TCGA-G4-6309-01 | Colorectum | colon adenocarcinoma | Female | <65 | III/IV | Chemotherapy | xeloda | PD |
| Page: 1 2 3 4 5 6 7 8 |
Top |
Related drugs of malignant transformation related genes |
| Identification of chemicals and drugs interact with genes involved in malignant transfromation |
| (DGIdb 4.0) |
| Entrez ID | Symbol | Category | Interaction Types | Drug Claim Name | Drug Name | PMIDs |
| Page: 1 |

Copyright 2023-Present -The University of Texas Health Science Center at Houston |