
|
|||||
|
 | |
| |
| |
| |
| |
| |
|
Gene: DMRTA2 |
Gene summary for DMRTA2 |
| Gene information | Species | Human | Gene symbol | DMRTA2 | Gene ID | 63950 |
| Gene name | DMRT like family A2 | |
| Gene Alias | DMRTA2 | |
| Cytomap | 1p32.3 | |
| Gene Type | protein-coding | GO ID | GO:0000003 | UniProtAcc | Q96SC8 |
Top |
Malignant transformation analysis |
| Identification of the aberrant gene expression in precancerous and cancerous lesions by comparing the gene expression of stem-like cells in diseased tissues with normal stem cells |
| Entrez ID | Symbol | Replicates | Species | Organ | Tissue | Adj P-value | Log2FC | Malignancy |
| 63950 | DMRTA2 | C21 | Human | Oral cavity | OSCC | 2.12e-09 | 2.65e-01 | 0.2678 |
| 63950 | DMRTA2 | C38 | Human | Oral cavity | OSCC | 9.35e-07 | 3.90e-01 | 0.172 |
| 63950 | DMRTA2 | C43 | Human | Oral cavity | OSCC | 3.94e-04 | 1.12e-01 | 0.1704 |
| 63950 | DMRTA2 | C46 | Human | Oral cavity | OSCC | 8.57e-18 | 3.85e-01 | 0.1673 |
| 63950 | DMRTA2 | LN22 | Human | Oral cavity | OSCC | 9.83e-12 | 6.63e-01 | 0.1733 |
| 63950 | DMRTA2 | LN46 | Human | Oral cavity | OSCC | 6.71e-17 | 5.26e-01 | 0.1666 |
| Page: 1 |
| Tissue | Expression Dynamics | Abbreviation |
| Oral Cavity | 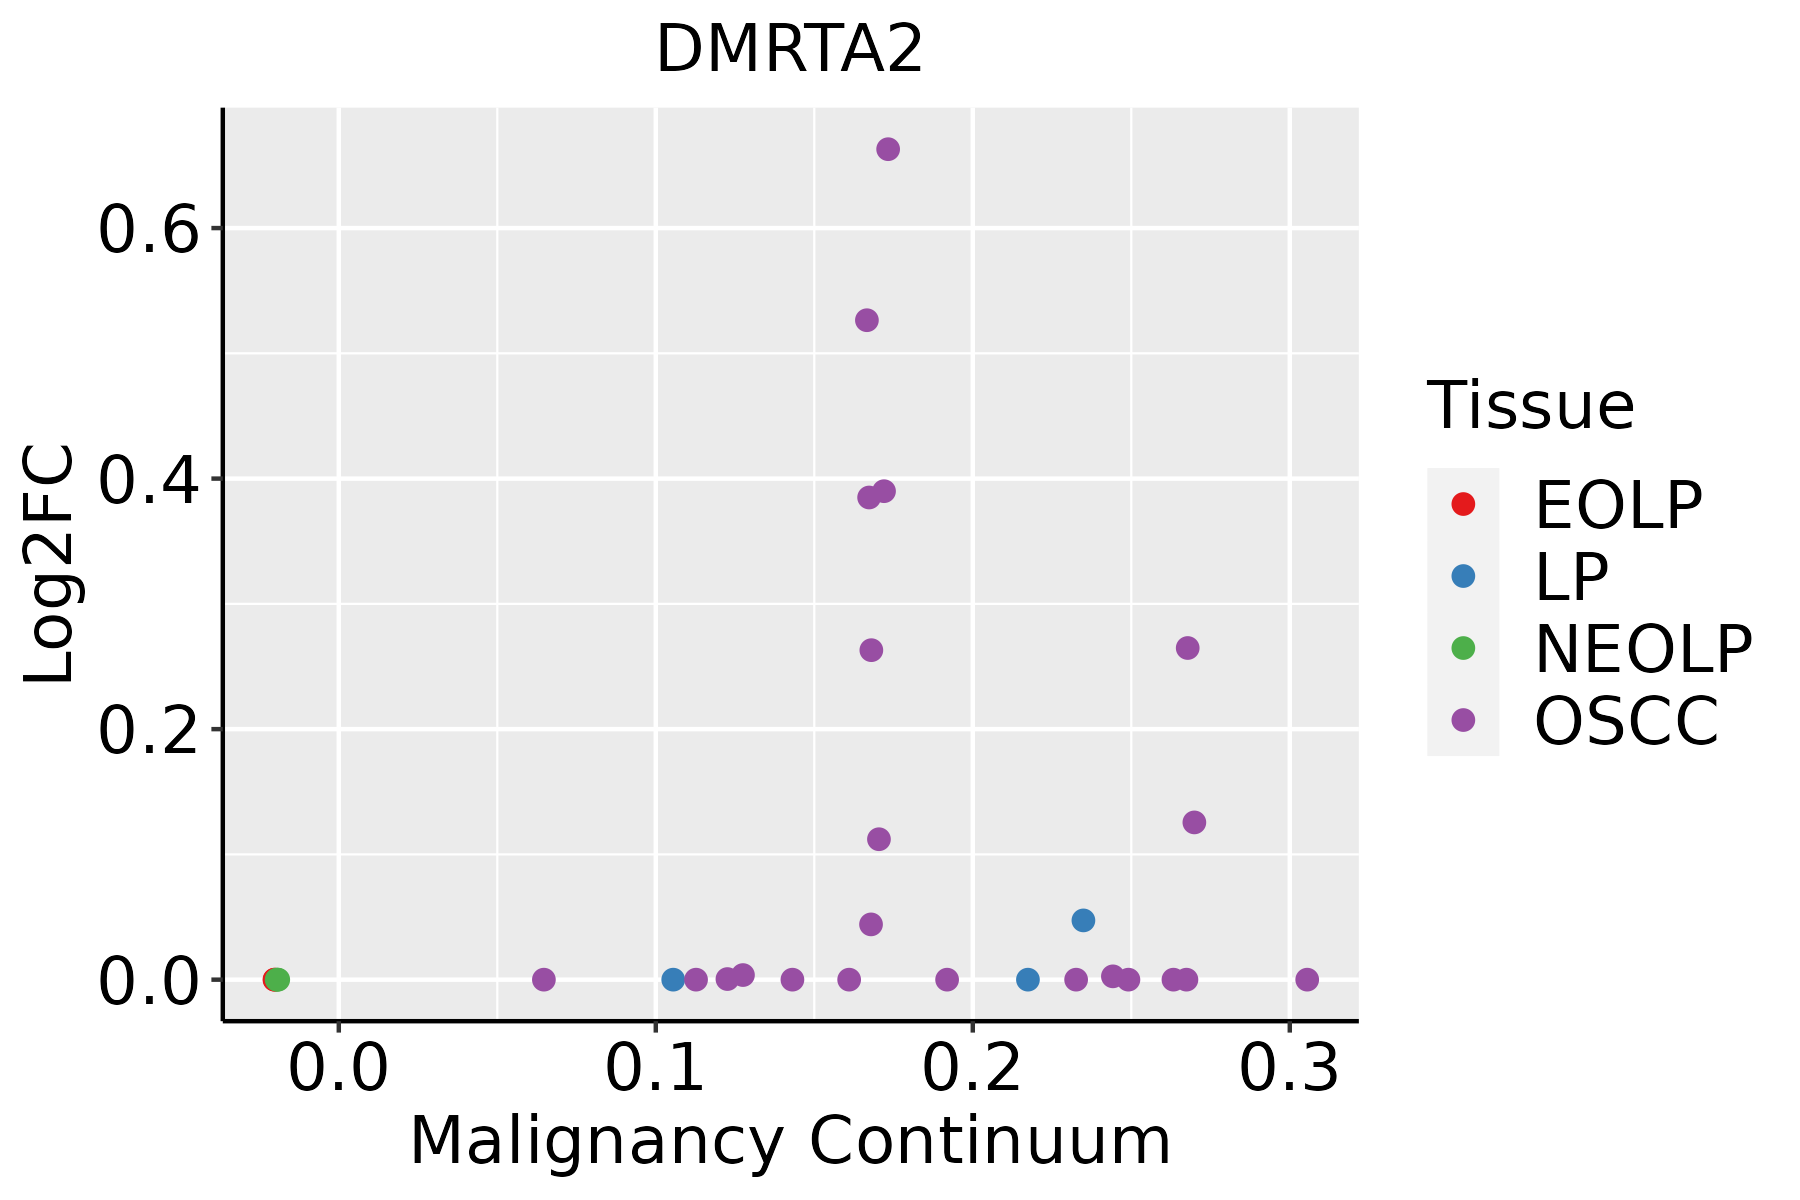 | EOLP: Erosive Oral lichen planus |
| LP: leukoplakia | ||
| NEOLP: Non-erosive oral lichen planus | ||
| OSCC: Oral squamous cell carcinoma |
| ∗log2FC in expression of this searched gene in stem-like cells from each diseased tissue sample relative to stem-like cells in normal samples in each tissue plotted against the malignancy continuum. Samples are colored based on if they are from different disease stage. |
Top |
Malignant transformation related pathway analysis |
| Find out the enriched GO biological processes and KEGG pathways involved in transition from healthy to precancer to cancer |
| Tissue | Disease Stage | Enriched GO biological Processes |
| Colorectum | AD |  |
| Colorectum | SER |  |
| Colorectum | MSS |  |
| Colorectum | MSI-H |  |
| Colorectum | FAP |  |
| ∗Top 15 enriched GO BP terms are showed in the bar plot of each disease state in each tissue. Each row represents a significant GO biological process which is colored according to the -log10(p.adjust). |
| Page: 1 2 3 4 5 6 7 8 9 |
| GO ID | Tissue | Disease Stage | Description | Gene Ratio | Bg Ratio | pvalue | p.adjust | Count |
| GO:00107209 | Oral cavity | OSCC | positive regulation of cell development | 159/7305 | 298/18723 | 3.06e-07 | 4.66e-06 | 159 |
| GO:00507696 | Oral cavity | OSCC | positive regulation of neurogenesis | 120/7305 | 225/18723 | 8.45e-06 | 9.02e-05 | 120 |
| GO:00507679 | Oral cavity | OSCC | regulation of neurogenesis | 179/7305 | 364/18723 | 4.49e-05 | 3.84e-04 | 179 |
| GO:00519624 | Oral cavity | OSCC | positive regulation of nervous system development | 135/7305 | 272/18723 | 2.20e-04 | 1.44e-03 | 135 |
| GO:00519605 | Oral cavity | OSCC | regulation of nervous system development | 205/7305 | 443/18723 | 9.80e-04 | 5.11e-03 | 205 |
| GO:00605378 | Oral cavity | OSCC | muscle tissue development | 185/7305 | 403/18723 | 2.60e-03 | 1.14e-02 | 185 |
| GO:00147067 | Oral cavity | OSCC | striated muscle tissue development | 174/7305 | 384/18723 | 6.45e-03 | 2.40e-02 | 174 |
| GO:00219876 | Oral cavity | OSCC | cerebral cortex development | 57/7305 | 114/18723 | 1.09e-02 | 3.71e-02 | 57 |
| GO:00215435 | Oral cavity | OSCC | pallium development | 81/7305 | 169/18723 | 1.11e-02 | 3.76e-02 | 81 |
| Page: 1 |
| Pathway ID | Tissue | Disease Stage | Description | Gene Ratio | Bg Ratio | pvalue | p.adjust | qvalue | Count |
| Page: 1 |
Top |
Cell-cell communication analysis |
| Identification of potential cell-cell interactions between two cell types and their ligand-receptor pairs for different disease states |
| Ligand | Receptor | LRpair | Pathway | Tissue | Disease Stage |
| Page: 1 |
Top |
Single-cell gene regulatory network inference analysis |
| Find out the significant the regulons (TFs) and the target genes of each regulon across cell types for different disease states |
| TF | Cell Type | Tissue | Disease Stage | Target Gene | RSS | Regulon Activity |
| ∗The dot plots of a searched regulon are shown for all cell subpopulations in each disease state of each tissue based on the regulon specific score inferred using pySCENIC and by calculating the average expression. |
| Page: 1 |
Top |
Somatic mutation of malignant transformation related genes |
| Annotation of somatic variants for genes involved in malignant transformation |
| Hugo Symbol | Variant Class | Variant Classification | dbSNP RS | HGVSc | HGVSp | HGVSp Short | SWISSPROT | BIOTYPE | SIFT | PolyPhen | Tumor Sample Barcode | Tissue | Histology | Sex | Age | Stage | Therapy Types | Drugs | Outcome |
| DMRTA2 | SNV | Missense_Mutation | novel | c.727N>A | p.Asp243Asn | p.D243N | Q96SC8 | protein_coding | tolerated(0.11) | probably_damaging(0.985) | TCGA-5L-AAT1-01 | Breast | breast invasive carcinoma | Female | <65 | III/IV | Hormone Therapy | letrozol | SD |
| DMRTA2 | SNV | Missense_Mutation | c.445C>T | p.Pro149Ser | p.P149S | Q96SC8 | protein_coding | tolerated(0.08) | probably_damaging(0.994) | TCGA-AD-6890-01 | Colorectum | colon adenocarcinoma | Male | >=65 | I/II | Unknown | Unknown | SD | |
| DMRTA2 | SNV | Missense_Mutation | novel | c.1519N>T | p.Asp507Tyr | p.D507Y | Q96SC8 | protein_coding | deleterious(0.04) | probably_damaging(0.948) | TCGA-CA-6717-01 | Colorectum | colon adenocarcinoma | Male | <65 | I/II | Chemotherapy | oxaliplatin | CR |
| DMRTA2 | SNV | Missense_Mutation | novel | c.160C>G | p.Pro54Ala | p.P54A | Q96SC8 | protein_coding | deleterious(0) | probably_damaging(0.991) | TCGA-CK-4951-01 | Colorectum | colon adenocarcinoma | Female | >=65 | I/II | Unknown | Unknown | PD |
| DMRTA2 | SNV | Missense_Mutation | novel | c.581N>G | p.Asp194Gly | p.D194G | Q96SC8 | protein_coding | deleterious(0.01) | benign(0.262) | TCGA-AP-A0LM-01 | Endometrium | uterine corpus endometrioid carcinoma | Female | <65 | III/IV | Chemotherapy | cisplatin | SD |
| DMRTA2 | SNV | Missense_Mutation | c.723C>A | p.Asn241Lys | p.N241K | Q96SC8 | protein_coding | deleterious(0.04) | probably_damaging(0.989) | TCGA-95-7947-01 | Lung | lung adenocarcinoma | Male | >=65 | I/II | Unknown | Unknown | SD | |
| DMRTA2 | SNV | Missense_Mutation | novel | c.577N>A | p.Phe193Ile | p.F193I | Q96SC8 | protein_coding | deleterious(0.03) | benign(0.444) | TCGA-L4-A4E5-01 | Lung | lung adenocarcinoma | Female | <65 | I/II | Unknown | Unknown | SD |
| DMRTA2 | SNV | Missense_Mutation | novel | c.1428N>A | p.His476Gln | p.H476Q | Q96SC8 | protein_coding | deleterious_low_confidence(0.02) | possibly_damaging(0.859) | TCGA-34-A5IX-01 | Lung | lung squamous cell carcinoma | Male | >=65 | I/II | Unknown | Unknown | SD |
| DMRTA2 | SNV | Missense_Mutation | novel | c.1451C>T | p.Ala484Val | p.A484V | Q96SC8 | protein_coding | deleterious(0.01) | benign(0.274) | TCGA-63-A5MP-01 | Lung | lung squamous cell carcinoma | Male | <65 | I/II | Chemotherapy | cisplatin | PD |
| DMRTA2 | SNV | Missense_Mutation | c.941N>T | p.Arg314Leu | p.R314L | Q96SC8 | protein_coding | deleterious(0.01) | benign(0.286) | TCGA-BR-8487-01 | Stomach | stomach adenocarcinoma | Female | <65 | I/II | Unknown | Unknown | SD |
| Page: 1 2 |
Top |
Related drugs of malignant transformation related genes |
| Identification of chemicals and drugs interact with genes involved in malignant transfromation |
| (DGIdb 4.0) |
| Entrez ID | Symbol | Category | Interaction Types | Drug Claim Name | Drug Name | PMIDs |
| Page: 1 |

Copyright 2023-Present -The University of Texas Health Science Center at Houston |