
|
|||||
|
 | |
| |
| |
| |
| |
| |
|
Gene: DMKN |
Gene summary for DMKN |
| Gene information | Species | Human | Gene symbol | DMKN | Gene ID | 93099 |
| Gene name | dermokine | |
| Gene Alias | UNQ729 | |
| Cytomap | 19q13.12 | |
| Gene Type | protein-coding | GO ID | GO:0007009 | UniProtAcc | A3EZ84 |
Top |
Malignant transformation analysis |
| Identification of the aberrant gene expression in precancerous and cancerous lesions by comparing the gene expression of stem-like cells in diseased tissues with normal stem cells |
| Entrez ID | Symbol | Replicates | Species | Organ | Tissue | Adj P-value | Log2FC | Malignancy |
| 93099 | DMKN | CA_HPV_1 | Human | Cervix | CC | 7.45e-21 | -5.73e-01 | 0.0264 |
| 93099 | DMKN | N_HPV_1 | Human | Cervix | N_HPV | 9.67e-10 | -4.82e-01 | 0.0079 |
| 93099 | DMKN | CCI_1 | Human | Cervix | CC | 1.24e-03 | -5.47e-01 | 0.528 |
| 93099 | DMKN | CCI_2 | Human | Cervix | CC | 2.70e-06 | -5.88e-01 | 0.5249 |
| 93099 | DMKN | CCI_3 | Human | Cervix | CC | 2.65e-03 | -4.95e-01 | 0.516 |
| 93099 | DMKN | CCII_1 | Human | Cervix | CC | 1.13e-13 | -5.88e-01 | 0.3249 |
| 93099 | DMKN | Tumor | Human | Cervix | CC | 3.86e-08 | 2.75e-01 | 0.1241 |
| 93099 | DMKN | sample3 | Human | Cervix | CC | 3.15e-13 | 2.15e-01 | 0.1387 |
| 93099 | DMKN | T1 | Human | Cervix | CC | 2.48e-02 | -3.10e-01 | 0.0918 |
| 93099 | DMKN | T3 | Human | Cervix | CC | 1.00e-05 | 2.21e-01 | 0.1389 |
| 93099 | DMKN | AEH-subject5 | Human | Endometrium | AEH | 1.16e-02 | -1.96e-01 | -0.2953 |
| 93099 | DMKN | EEC-subject3 | Human | Endometrium | EEC | 1.85e-08 | -1.59e-01 | -0.2525 |
| 93099 | DMKN | EEC-subject4 | Human | Endometrium | EEC | 7.14e-04 | -2.53e-01 | -0.2571 |
| 93099 | DMKN | GSM5276934 | Human | Endometrium | EEC | 1.66e-06 | -3.06e-01 | -0.0913 |
| 93099 | DMKN | GSM6177620_NYU_UCEC1_lib1_lib1 | Human | Endometrium | EEC | 5.80e-07 | -2.02e-01 | -0.1869 |
| 93099 | DMKN | GSM6177620_NYU_UCEC1_lib2_lib2 | Human | Endometrium | EEC | 3.14e-08 | -3.67e-01 | -0.1875 |
| 93099 | DMKN | GSM6177620_NYU_UCEC1_lib3_lib3 | Human | Endometrium | EEC | 2.33e-08 | -2.24e-01 | -0.1883 |
| 93099 | DMKN | GSM6177621_NYU_UCEC2_lib1_lib1 | Human | Endometrium | EEC | 3.56e-08 | -1.90e-01 | -0.1934 |
| 93099 | DMKN | GSM6177622_NYU_UCEC3_lib1_lib1 | Human | Endometrium | EEC | 1.09e-12 | -1.32e-01 | -0.1917 |
| 93099 | DMKN | GSM6177622_NYU_UCEC3_lib2_lib2 | Human | Endometrium | EEC | 5.47e-13 | 2.90e-02 | -0.1916 |
| Page: 1 2 3 4 5 6 7 8 |
| Tissue | Expression Dynamics | Abbreviation |
| Cervix |  | CC: Cervix cancer |
| HSIL_HPV: HPV-infected high-grade squamous intraepithelial lesions | ||
| N_HPV: HPV-infected normal cervix | ||
| Endometrium | 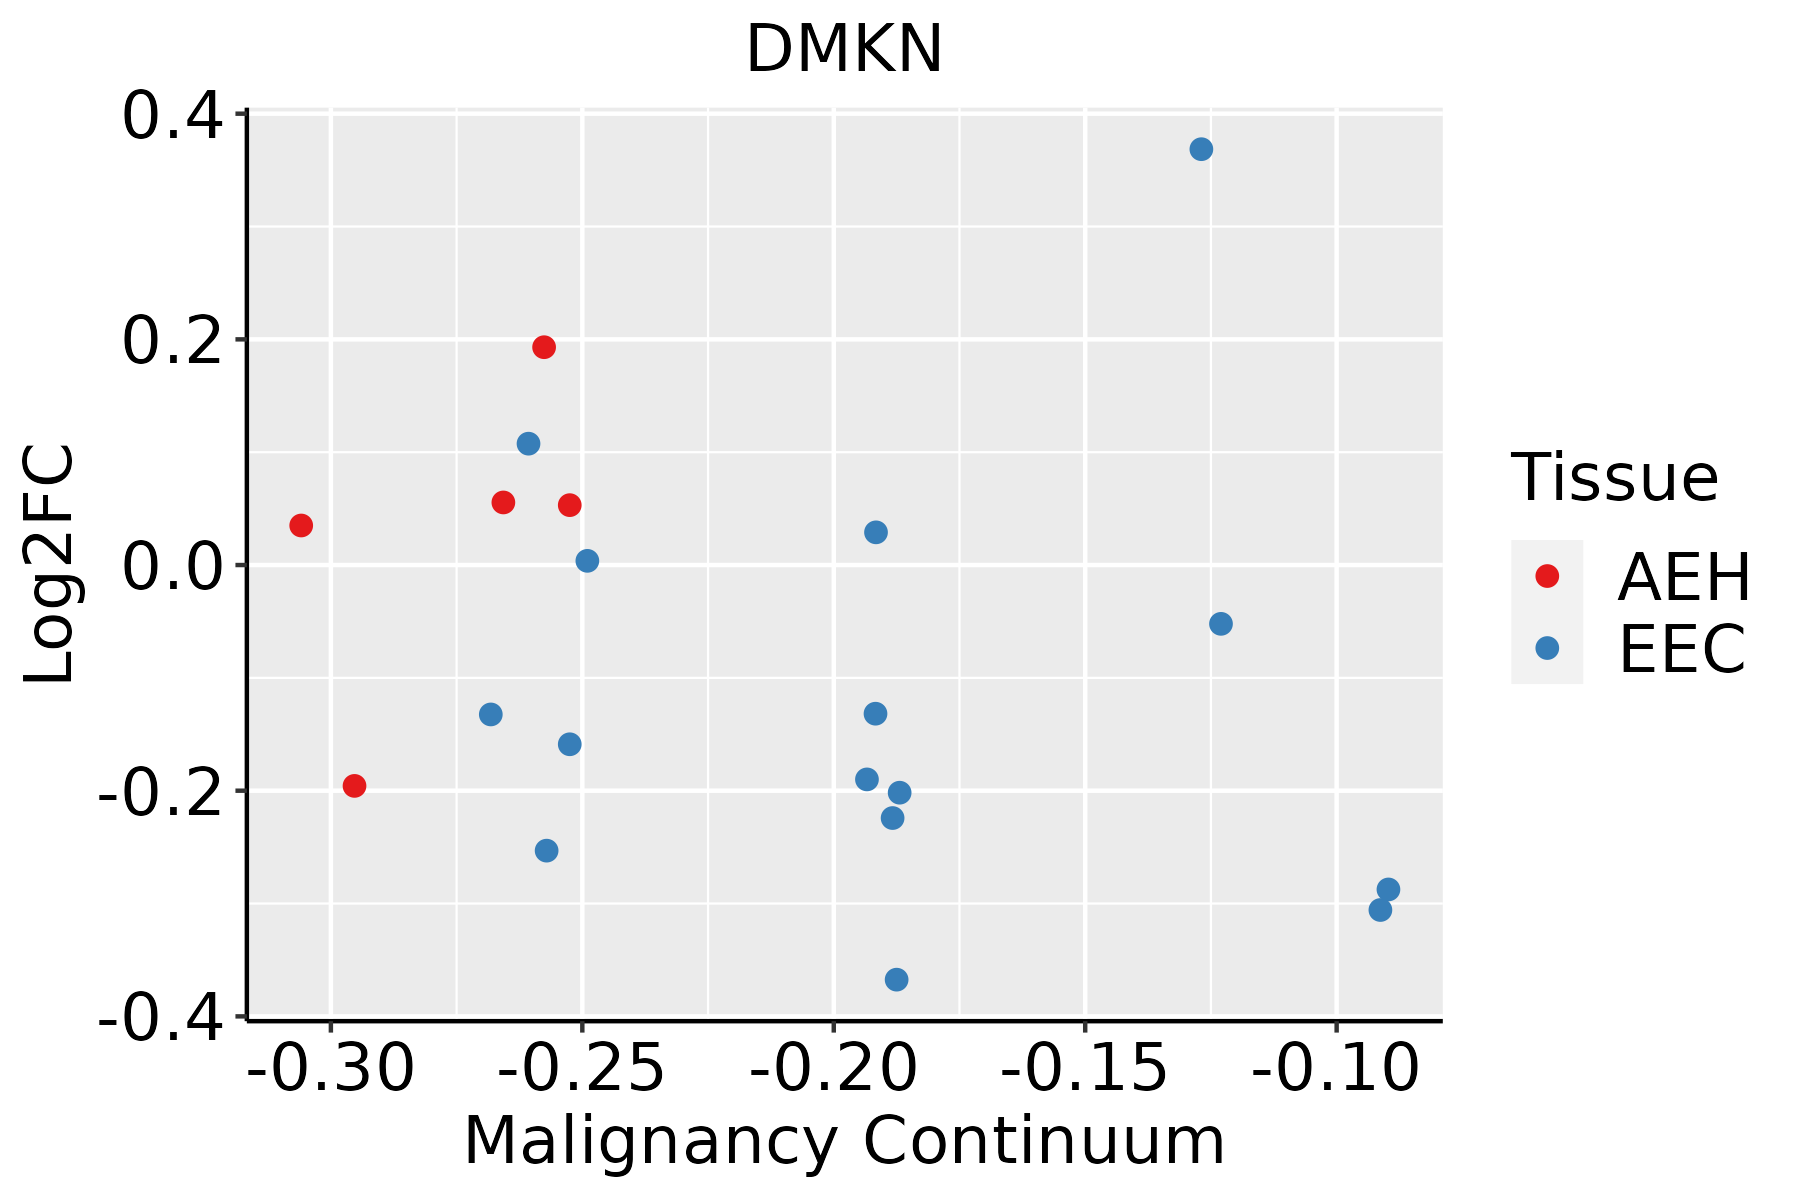 | AEH: Atypical endometrial hyperplasia |
| EEC: Endometrioid Cancer | ||
| Esophagus |  | ESCC: Esophageal squamous cell carcinoma |
| HGIN: High-grade intraepithelial neoplasias | ||
| LGIN: Low-grade intraepithelial neoplasias | ||
| Liver | 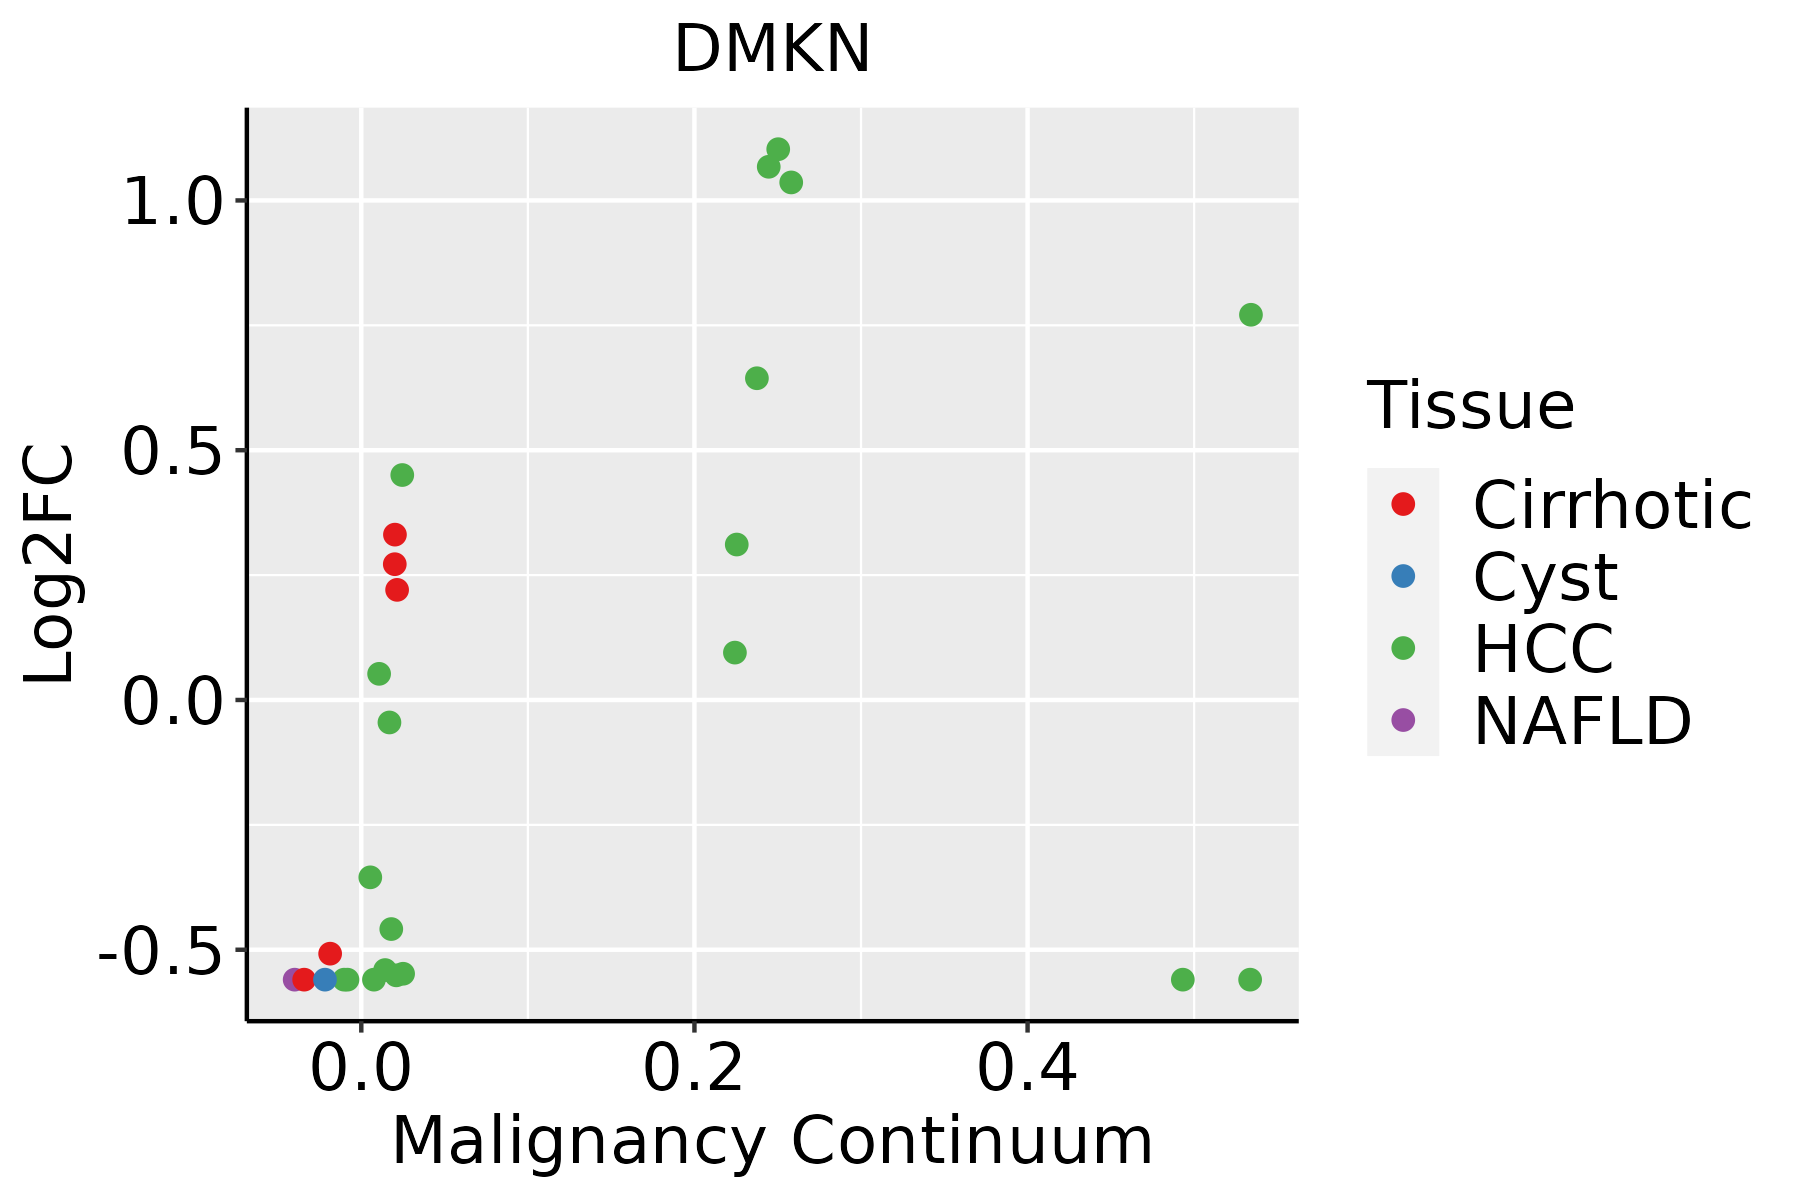 | HCC: Hepatocellular carcinoma |
| NAFLD: Non-alcoholic fatty liver disease | ||
| Oral Cavity | 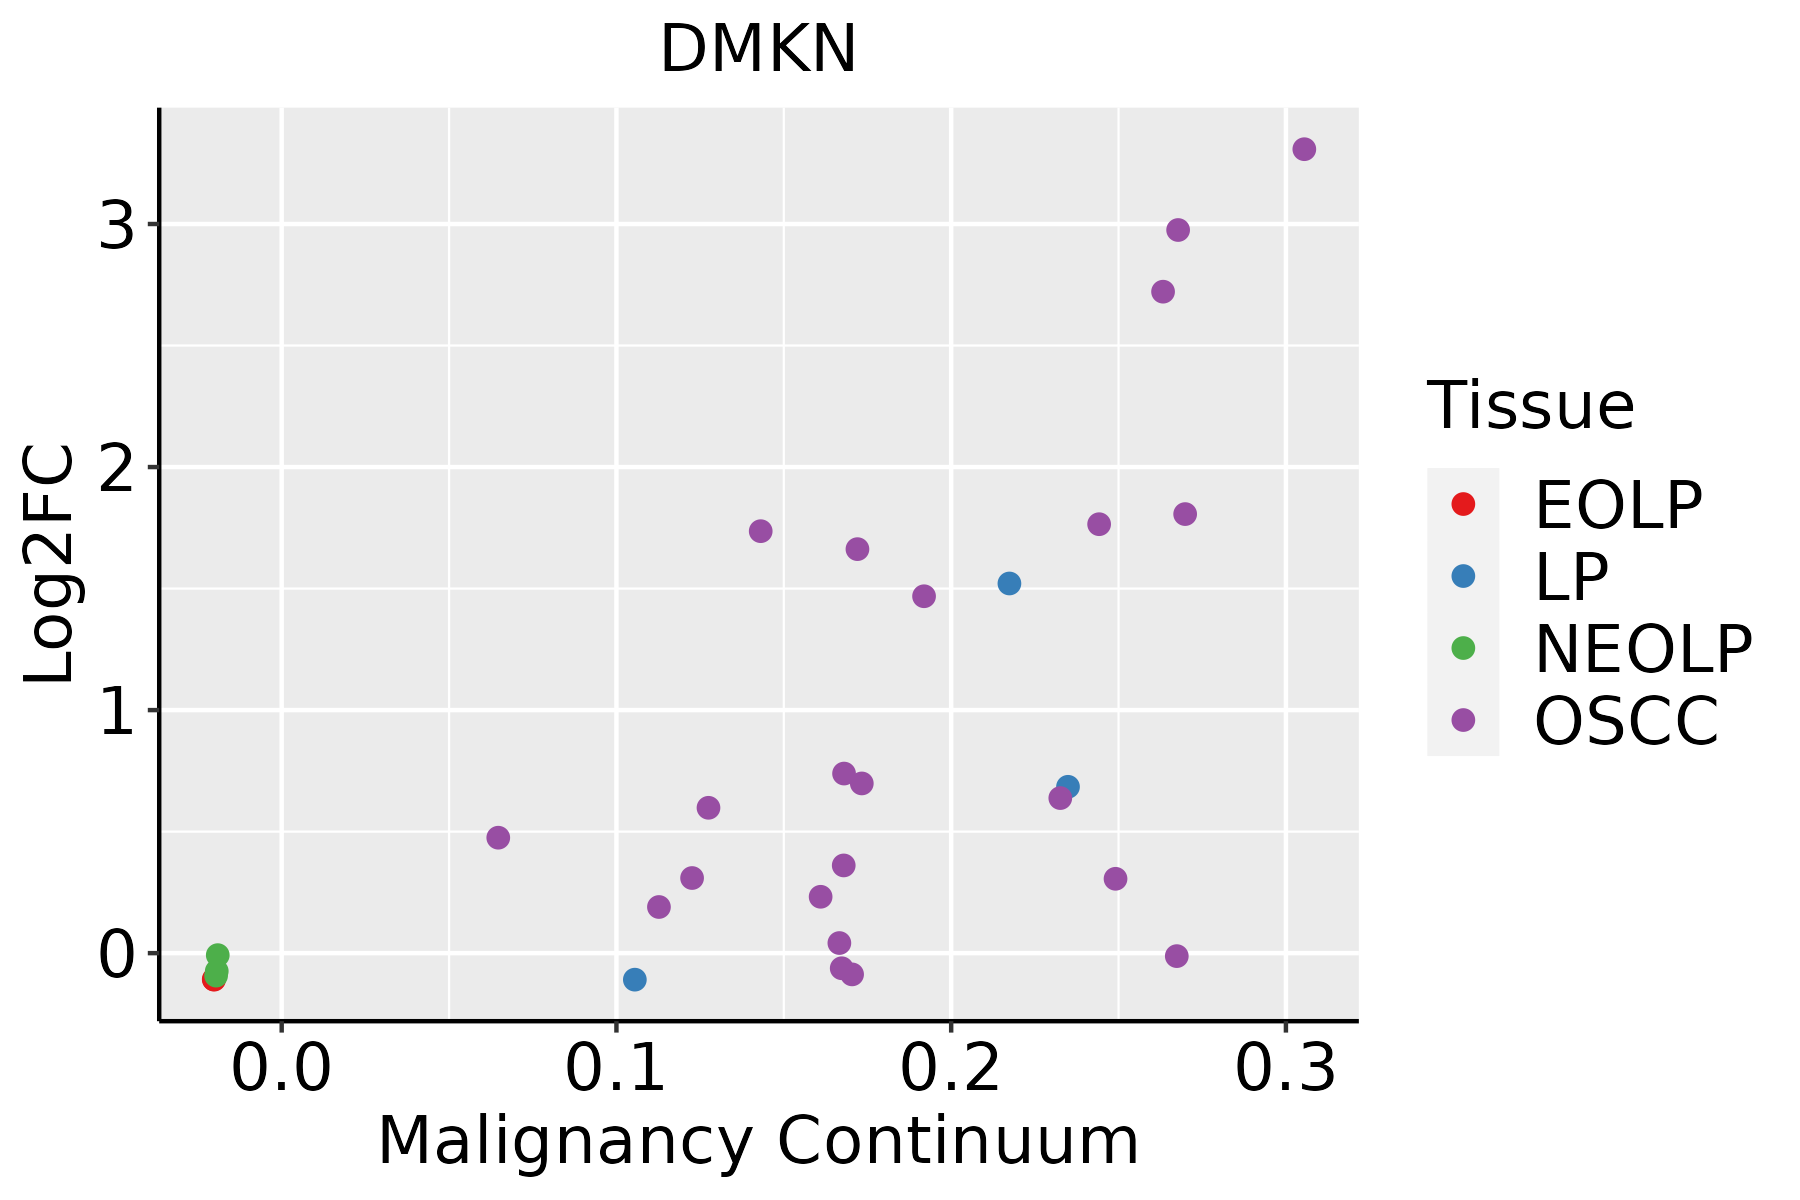 | EOLP: Erosive Oral lichen planus |
| LP: leukoplakia | ||
| NEOLP: Non-erosive oral lichen planus | ||
| OSCC: Oral squamous cell carcinoma | ||
| Prostate | 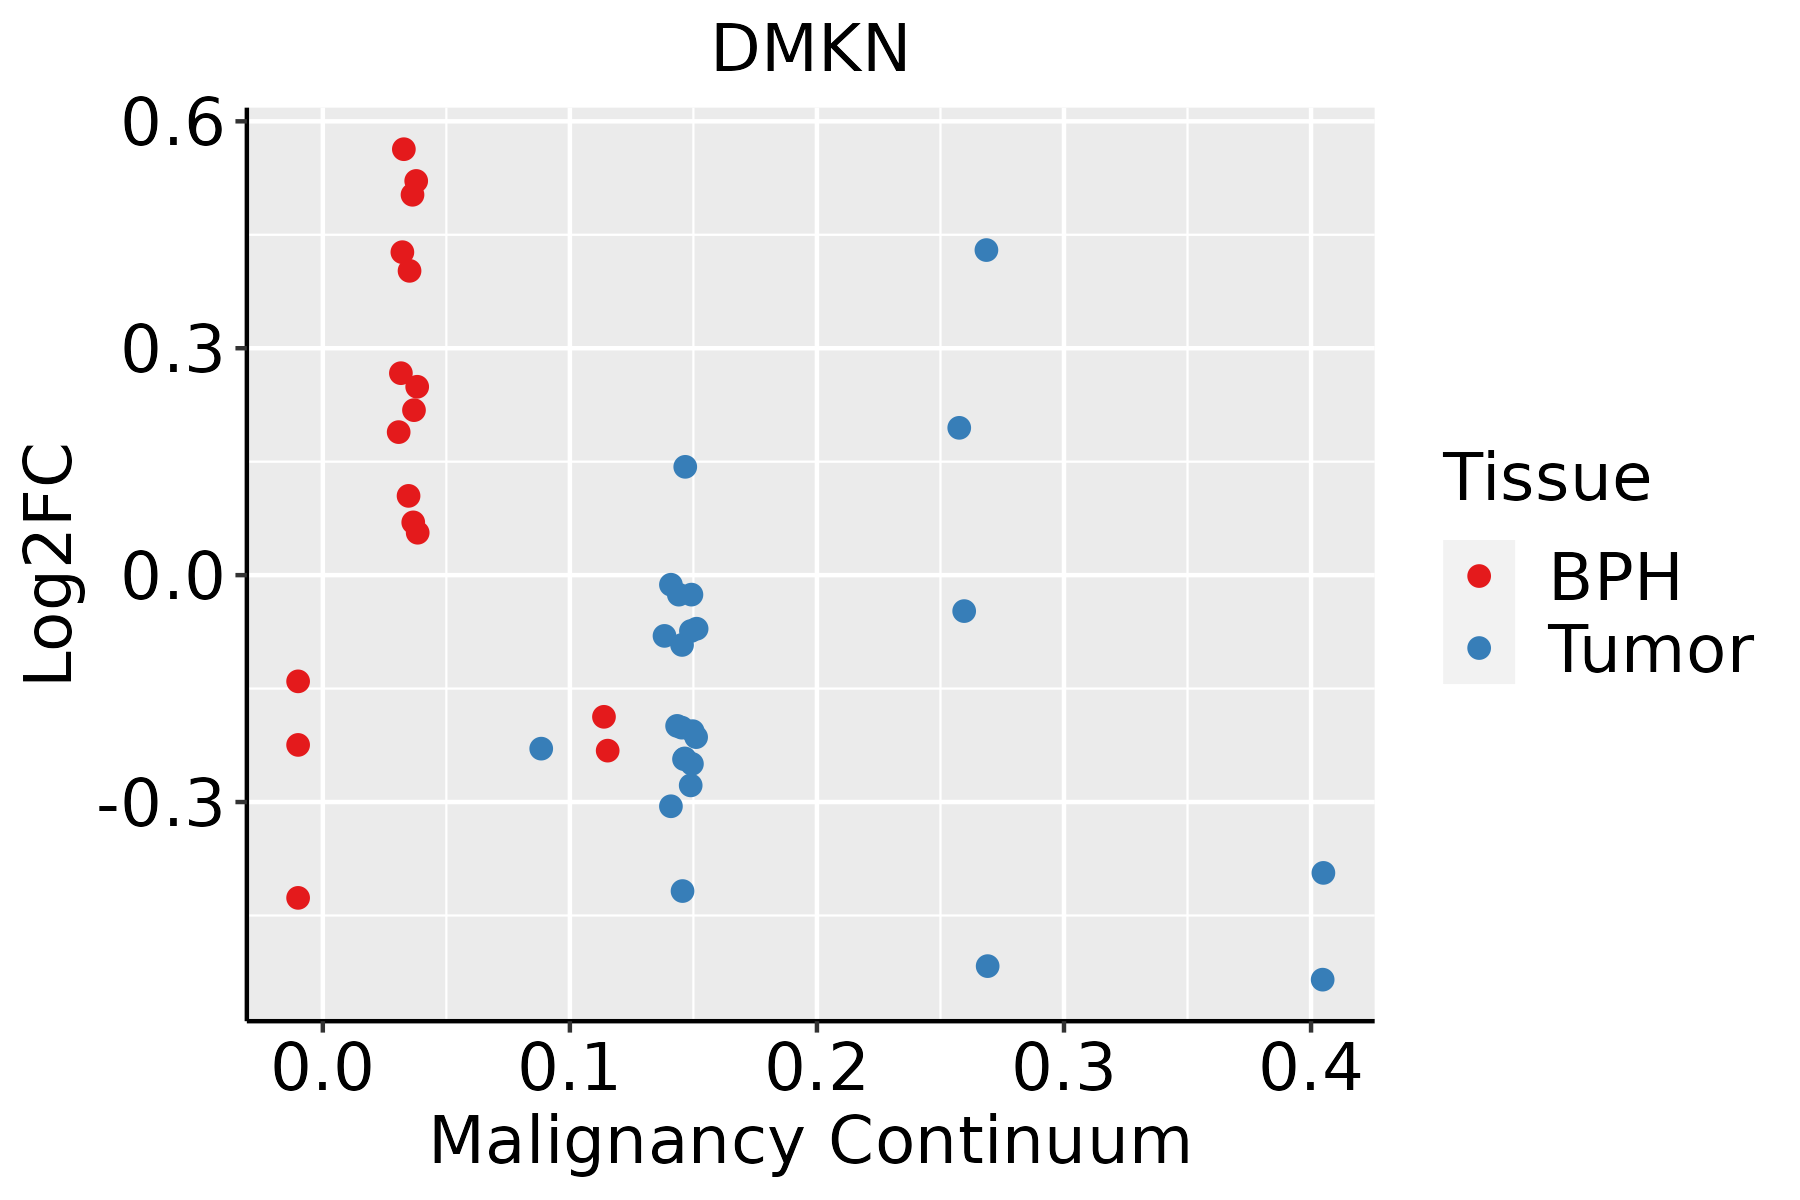 | BPH: Benign Prostatic Hyperplasia |
| Skin |  | AK: Actinic keratosis |
| cSCC: Cutaneous squamous cell carcinoma | ||
| SCCIS:squamous cell carcinoma in situ | ||
| Thyroid | 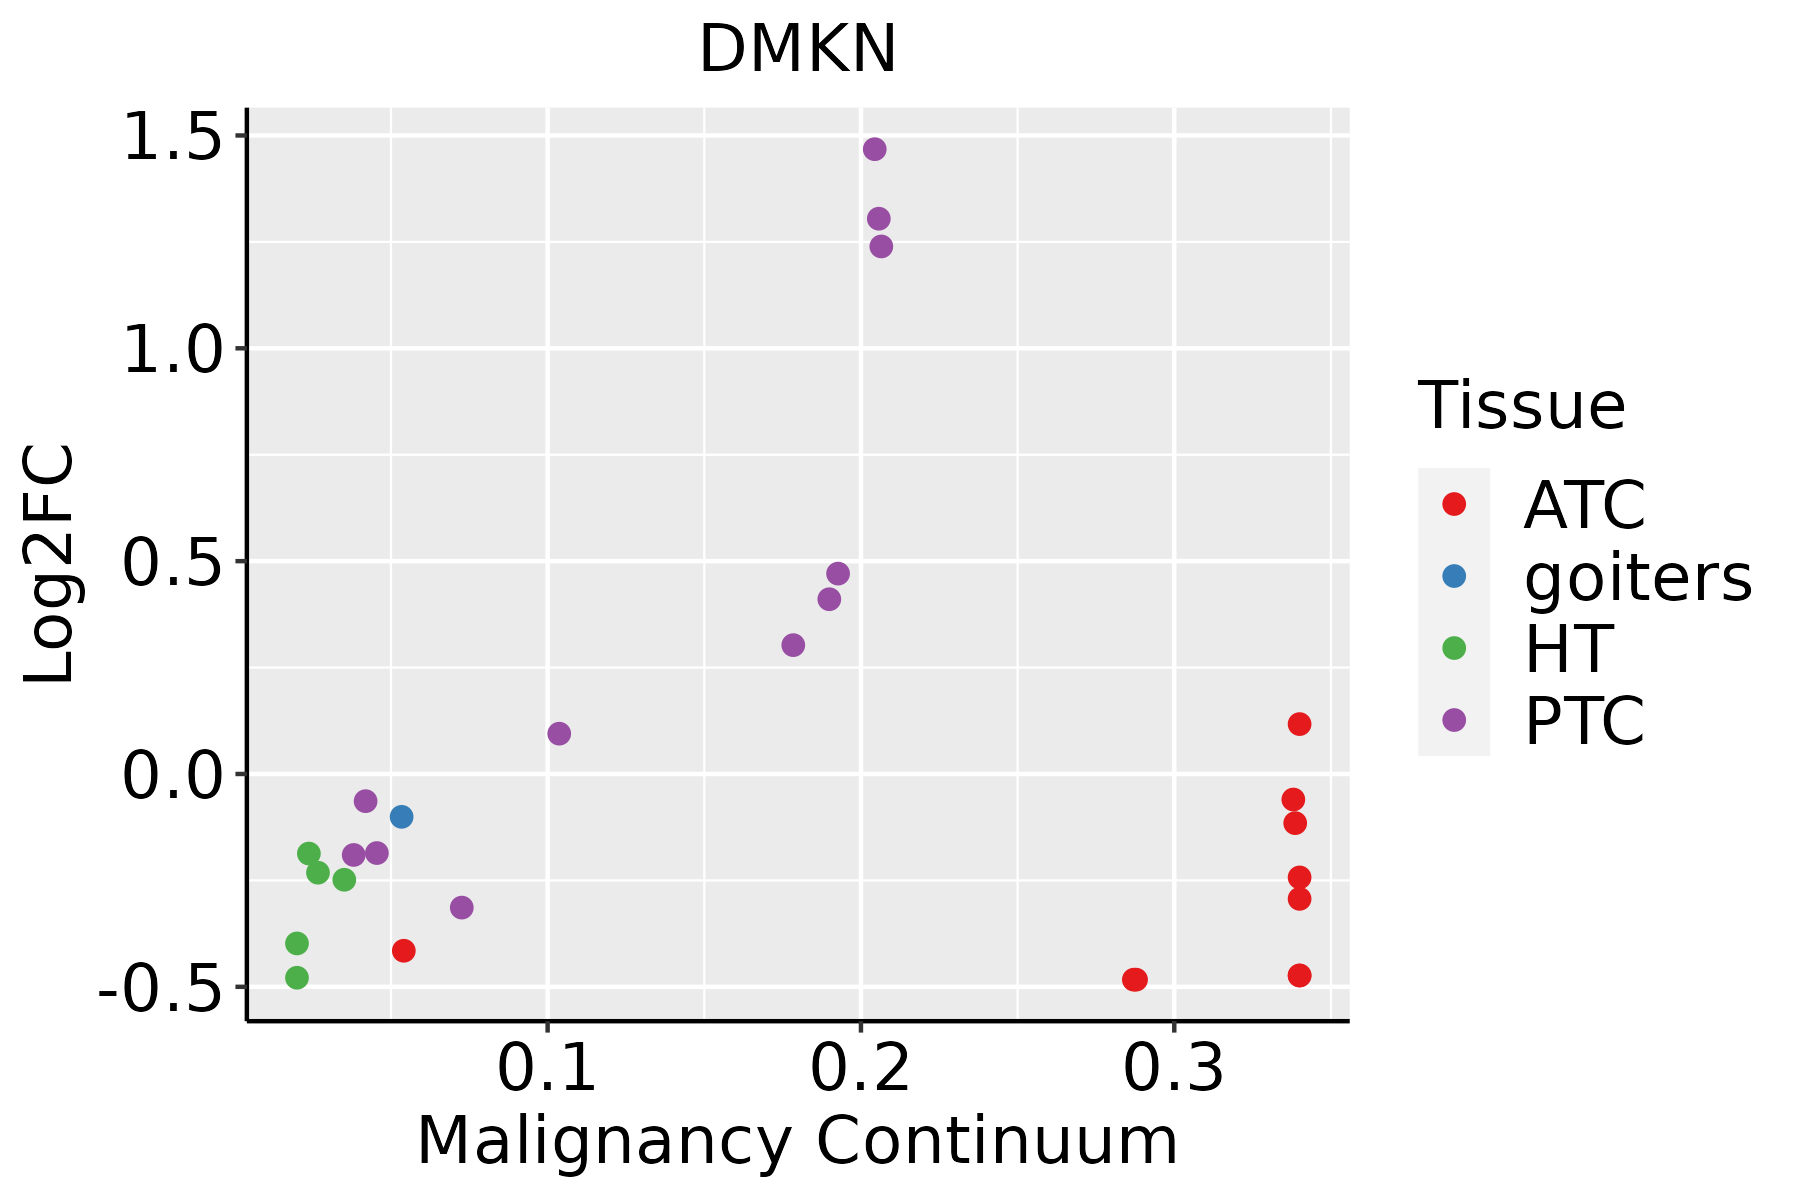 | ATC: Anaplastic thyroid cancer |
| HT: Hashimoto's thyroiditis | ||
| PTC: Papillary thyroid cancer |
| ∗log2FC in expression of this searched gene in stem-like cells from each diseased tissue sample relative to stem-like cells in normal samples in each tissue plotted against the malignancy continuum. Samples are colored based on if they are from different disease stage. |
Top |
Malignant transformation related pathway analysis |
| Find out the enriched GO biological processes and KEGG pathways involved in transition from healthy to precancer to cancer |
| Tissue | Disease Stage | Enriched GO biological Processes |
| Colorectum | AD |  |
| Colorectum | SER |  |
| Colorectum | MSS |  |
| Colorectum | MSI-H |  |
| Colorectum | FAP |  |
| ∗Top 15 enriched GO BP terms are showed in the bar plot of each disease state in each tissue. Each row represents a significant GO biological process which is colored according to the -log10(p.adjust). |
| Page: 1 2 3 4 5 6 7 8 9 |
| GO ID | Tissue | Disease Stage | Description | Gene Ratio | Bg Ratio | pvalue | p.adjust | Count |
| GO:00070092 | Cervix | CC | plasma membrane organization | 28/2311 | 142/18723 | 7.85e-03 | 4.14e-02 | 28 |
| GO:00717095 | Cervix | N_HPV | membrane assembly | 6/534 | 50/18723 | 2.87e-03 | 2.47e-02 | 6 |
| GO:00440915 | Cervix | N_HPV | membrane biogenesis | 6/534 | 55/18723 | 4.64e-03 | 3.47e-02 | 6 |
| GO:00717096 | Endometrium | AEH | membrane assembly | 12/2100 | 50/18723 | 8.00e-03 | 4.43e-02 | 12 |
| GO:00440918 | Esophagus | ESCC | membrane biogenesis | 38/8552 | 55/18723 | 3.78e-04 | 2.19e-03 | 38 |
| GO:00717099 | Esophagus | ESCC | membrane assembly | 35/8552 | 50/18723 | 4.33e-04 | 2.44e-03 | 35 |
| GO:00440914 | Liver | Cirrhotic | membrane biogenesis | 25/4634 | 55/18723 | 6.51e-04 | 4.96e-03 | 25 |
| GO:00717094 | Liver | Cirrhotic | membrane assembly | 23/4634 | 50/18723 | 8.62e-04 | 6.22e-03 | 23 |
| GO:004409111 | Liver | HCC | membrane biogenesis | 37/7958 | 55/18723 | 1.79e-04 | 1.41e-03 | 37 |
| GO:007170911 | Liver | HCC | membrane assembly | 34/7958 | 50/18723 | 2.38e-04 | 1.79e-03 | 34 |
| GO:00440917 | Oral cavity | OSCC | membrane biogenesis | 35/7305 | 55/18723 | 1.88e-04 | 1.27e-03 | 35 |
| GO:00717098 | Oral cavity | OSCC | membrane assembly | 32/7305 | 50/18723 | 3.02e-04 | 1.89e-03 | 32 |
| GO:004409113 | Oral cavity | LP | membrane biogenesis | 25/4623 | 55/18723 | 6.27e-04 | 5.71e-03 | 25 |
| GO:007170913 | Oral cavity | LP | membrane assembly | 23/4623 | 50/18723 | 8.33e-04 | 7.27e-03 | 23 |
| GO:00717097 | Prostate | BPH | membrane assembly | 20/3107 | 50/18723 | 6.88e-05 | 6.78e-04 | 20 |
| GO:00440916 | Prostate | BPH | membrane biogenesis | 21/3107 | 55/18723 | 1.02e-04 | 9.39e-04 | 21 |
| GO:007170912 | Prostate | Tumor | membrane assembly | 19/3246 | 50/18723 | 4.13e-04 | 3.16e-03 | 19 |
| GO:004409112 | Prostate | Tumor | membrane biogenesis | 20/3246 | 55/18723 | 5.74e-04 | 4.13e-03 | 20 |
| GO:00070093 | Prostate | Tumor | plasma membrane organization | 36/3246 | 142/18723 | 1.00e-02 | 4.20e-02 | 36 |
| GO:00440919 | Skin | cSCC | membrane biogenesis | 26/4864 | 55/18723 | 5.38e-04 | 3.99e-03 | 26 |
| Page: 1 2 |
| Pathway ID | Tissue | Disease Stage | Description | Gene Ratio | Bg Ratio | pvalue | p.adjust | qvalue | Count |
| Page: 1 |
Top |
Cell-cell communication analysis |
| Identification of potential cell-cell interactions between two cell types and their ligand-receptor pairs for different disease states |
| Ligand | Receptor | LRpair | Pathway | Tissue | Disease Stage |
| Page: 1 |
Top |
Single-cell gene regulatory network inference analysis |
| Find out the significant the regulons (TFs) and the target genes of each regulon across cell types for different disease states |
| TF | Cell Type | Tissue | Disease Stage | Target Gene | RSS | Regulon Activity |
| ∗The dot plots of a searched regulon are shown for all cell subpopulations in each disease state of each tissue based on the regulon specific score inferred using pySCENIC and by calculating the average expression. |
| Page: 1 |
Top |
Somatic mutation of malignant transformation related genes |
| Annotation of somatic variants for genes involved in malignant transformation |
| Hugo Symbol | Variant Class | Variant Classification | dbSNP RS | HGVSc | HGVSp | HGVSp Short | SWISSPROT | BIOTYPE | SIFT | PolyPhen | Tumor Sample Barcode | Tissue | Histology | Sex | Age | Stage | Therapy Types | Drugs | Outcome |
| DMKN | SNV | Missense_Mutation | c.1321N>T | p.Ala441Ser | p.A441S | Q6E0U4 | protein_coding | tolerated(0.1) | benign(0.015) | TCGA-AR-A0TX-01 | Breast | breast invasive carcinoma | Female | <65 | I/II | Unknown | Unknown | SD | |
| DMKN | SNV | Missense_Mutation | c.656N>T | p.Ser219Leu | p.S219L | Q6E0U4 | protein_coding | deleterious(0) | possibly_damaging(0.494) | TCGA-BH-A1F8-01 | Breast | breast invasive carcinoma | Female | >=65 | III/IV | Unknown | Unknown | PD | |
| DMKN | SNV | Missense_Mutation | novel | c.1124N>T | p.Ala375Val | p.A375V | Q6E0U4 | protein_coding | deleterious(0) | probably_damaging(0.958) | TCGA-WT-AB41-01 | Breast | breast invasive carcinoma | Female | <65 | I/II | Chemotherapy | taxotere | CR |
| DMKN | SNV | Missense_Mutation | rs367798085 | c.388N>A | p.Gly130Ser | p.G130S | Q6E0U4 | protein_coding | tolerated(1) | benign(0.001) | TCGA-2W-A8YY-01 | Cervix | cervical & endocervical cancer | Female | <65 | I/II | Chemotherapy | cisplatin | CR |
| DMKN | SNV | Missense_Mutation | c.1370N>T | p.Ser457Leu | p.S457L | Q6E0U4 | protein_coding | deleterious(0.01) | benign(0.001) | TCGA-C5-A1BQ-01 | Cervix | cervical & endocervical cancer | Female | >=65 | III/IV | Chemotherapy | cisplatin | CR | |
| DMKN | SNV | Missense_Mutation | c.334G>C | p.Glu112Gln | p.E112Q | Q6E0U4 | protein_coding | deleterious(0) | possibly_damaging(0.893) | TCGA-EK-A2H0-01 | Cervix | cervical & endocervical cancer | Female | <65 | I/II | Chemotherapy | cisplatin | CR | |
| DMKN | SNV | Missense_Mutation | c.1045N>A | p.Glu349Lys | p.E349K | Q6E0U4 | protein_coding | deleterious(0.04) | benign(0.058) | TCGA-IR-A3LK-01 | Cervix | cervical & endocervical cancer | Female | >=65 | I/II | Chemotherapy | cisplatin | PD | |
| DMKN | SNV | Missense_Mutation | rs756468266 | c.166N>A | p.Gly56Ser | p.G56S | Q6E0U4 | protein_coding | tolerated(0.06) | benign(0.015) | TCGA-VS-A9UJ-01 | Cervix | cervical & endocervical cancer | Female | <65 | I/II | Unknown | Unknown | PD |
| DMKN | SNV | Missense_Mutation | novel | c.1015N>A | p.Gly339Arg | p.G339R | Q6E0U4 | protein_coding | tolerated(0.64) | benign(0.381) | TCGA-XS-A8TJ-01 | Cervix | cervical & endocervical cancer | Female | <65 | I/II | Chemotherapy | cisplatin | SD |
| DMKN | SNV | Missense_Mutation | c.334G>C | p.Glu112Gln | p.E112Q | Q6E0U4 | protein_coding | deleterious(0) | possibly_damaging(0.893) | TCGA-ZJ-A8QQ-01 | Cervix | cervical & endocervical cancer | Female | <65 | I/II | Chemotherapy | cisplatin | SD |
| Page: 1 2 3 4 5 6 |
Top |
Related drugs of malignant transformation related genes |
| Identification of chemicals and drugs interact with genes involved in malignant transfromation |
| (DGIdb 4.0) |
| Entrez ID | Symbol | Category | Interaction Types | Drug Claim Name | Drug Name | PMIDs |
| Page: 1 |

Copyright 2023-Present -The University of Texas Health Science Center at Houston |