
|
|||||
|
 | |
| |
| |
| |
| |
| |
|
Gene: DMGDH |
Gene summary for DMGDH |
| Gene information | Species | Human | Gene symbol | DMGDH | Gene ID | 29958 |
| Gene name | dimethylglycine dehydrogenase | |
| Gene Alias | DMGDHD | |
| Cytomap | 5q14.1 | |
| Gene Type | protein-coding | GO ID | GO:0006091 | UniProtAcc | B3KQ84 |
Top |
Malignant transformation analysis |
| Identification of the aberrant gene expression in precancerous and cancerous lesions by comparing the gene expression of stem-like cells in diseased tissues with normal stem cells |
| Entrez ID | Symbol | Replicates | Species | Organ | Tissue | Adj P-value | Log2FC | Malignancy |
| 29958 | DMGDH | HTA11_2487_2000001011 | Human | Colorectum | SER | 2.49e-02 | 2.89e-01 | -0.1808 |
| 29958 | DMGDH | HTA11_1938_2000001011 | Human | Colorectum | AD | 8.75e-06 | 4.04e-01 | -0.0811 |
| 29958 | DMGDH | HTA11_347_2000001011 | Human | Colorectum | AD | 8.55e-13 | 5.32e-01 | -0.1954 |
| 29958 | DMGDH | HTA11_411_2000001011 | Human | Colorectum | SER | 6.45e-03 | 6.51e-01 | -0.2602 |
| 29958 | DMGDH | HTA11_696_2000001011 | Human | Colorectum | AD | 1.39e-09 | 4.86e-01 | -0.1464 |
| 29958 | DMGDH | HTA11_1391_2000001011 | Human | Colorectum | AD | 3.74e-05 | 3.56e-01 | -0.059 |
| 29958 | DMGDH | HTA11_10623_2000001011 | Human | Colorectum | AD | 6.51e-06 | 5.03e-01 | -0.0177 |
| 29958 | DMGDH | HTA11_10711_2000001011 | Human | Colorectum | AD | 4.51e-06 | 5.30e-01 | 0.0338 |
| 29958 | DMGDH | HTA11_7696_3000711011 | Human | Colorectum | AD | 7.71e-03 | 3.47e-01 | 0.0674 |
| 29958 | DMGDH | HTA11_6818_2000001011 | Human | Colorectum | AD | 3.19e-10 | 8.30e-01 | 0.0112 |
| 29958 | DMGDH | HTA11_11156_2000001011 | Human | Colorectum | AD | 2.21e-02 | 4.32e-01 | 0.0397 |
| 29958 | DMGDH | HTA11_6818_2000001021 | Human | Colorectum | AD | 1.23e-05 | 5.15e-01 | 0.0588 |
| 29958 | DMGDH | HTA11_99999973899_84307 | Human | Colorectum | MSS | 6.52e-07 | 6.14e-01 | 0.2585 |
| 29958 | DMGDH | HTA11_99999974143_84620 | Human | Colorectum | MSS | 7.28e-35 | 1.20e+00 | 0.3005 |
| 29958 | DMGDH | A002-C-116 | Human | Colorectum | FAP | 5.97e-03 | -4.27e-02 | -0.0452 |
| 29958 | DMGDH | NAFLD1 | Human | Liver | NAFLD | 4.54e-16 | 1.30e+00 | -0.04 |
| 29958 | DMGDH | S41 | Human | Liver | Cirrhotic | 2.95e-06 | 6.50e-01 | -0.0343 |
| 29958 | DMGDH | S43 | Human | Liver | Cirrhotic | 1.94e-06 | -8.96e-02 | -0.0187 |
| 29958 | DMGDH | HCC1_Meng | Human | Liver | HCC | 2.29e-36 | -1.64e-01 | 0.0246 |
| 29958 | DMGDH | HCC2_Meng | Human | Liver | HCC | 2.15e-06 | -2.09e-01 | 0.0107 |
| Page: 1 2 |
| Tissue | Expression Dynamics | Abbreviation |
| Colorectum (GSE201348) | 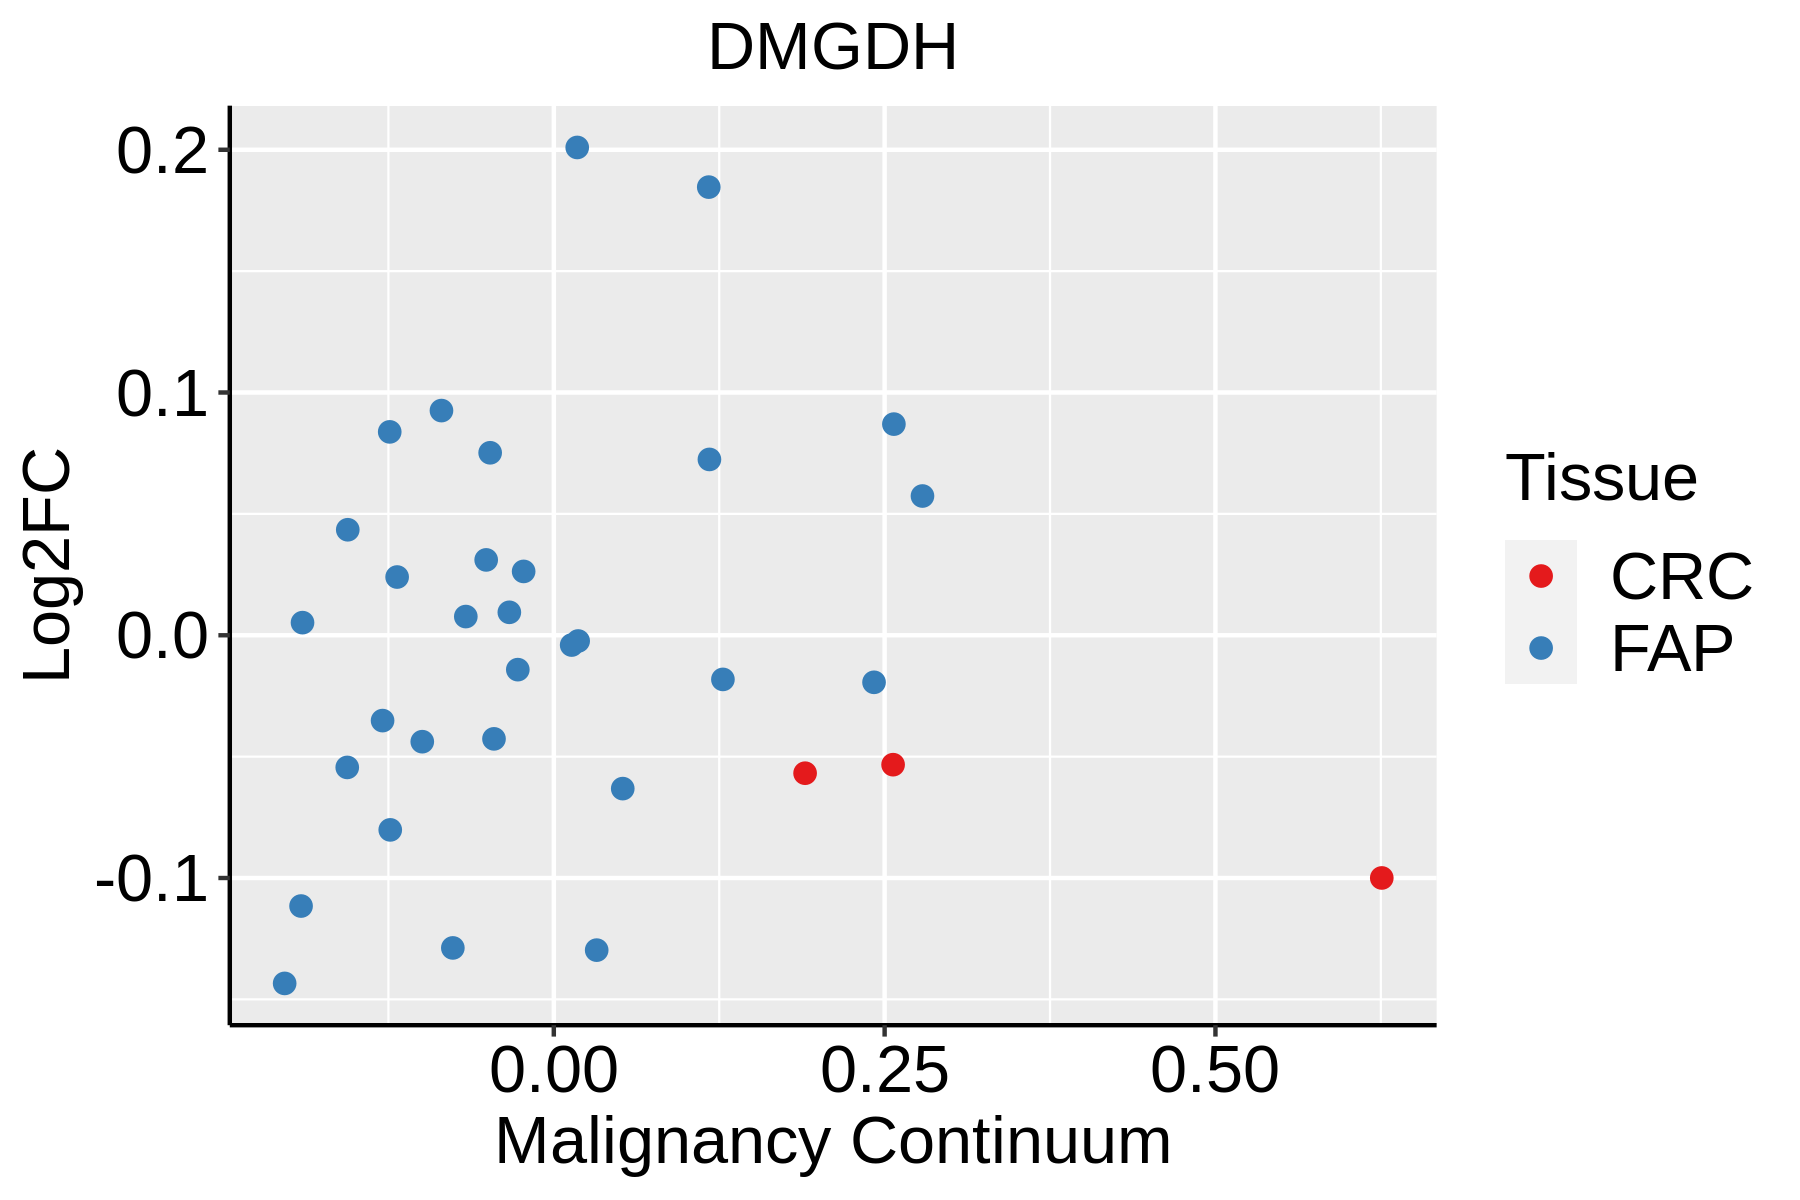 | FAP: Familial adenomatous polyposis |
| CRC: Colorectal cancer | ||
| Colorectum (HTA11) |  | AD: Adenomas |
| SER: Sessile serrated lesions | ||
| MSI-H: Microsatellite-high colorectal cancer | ||
| MSS: Microsatellite stable colorectal cancer | ||
| Liver | 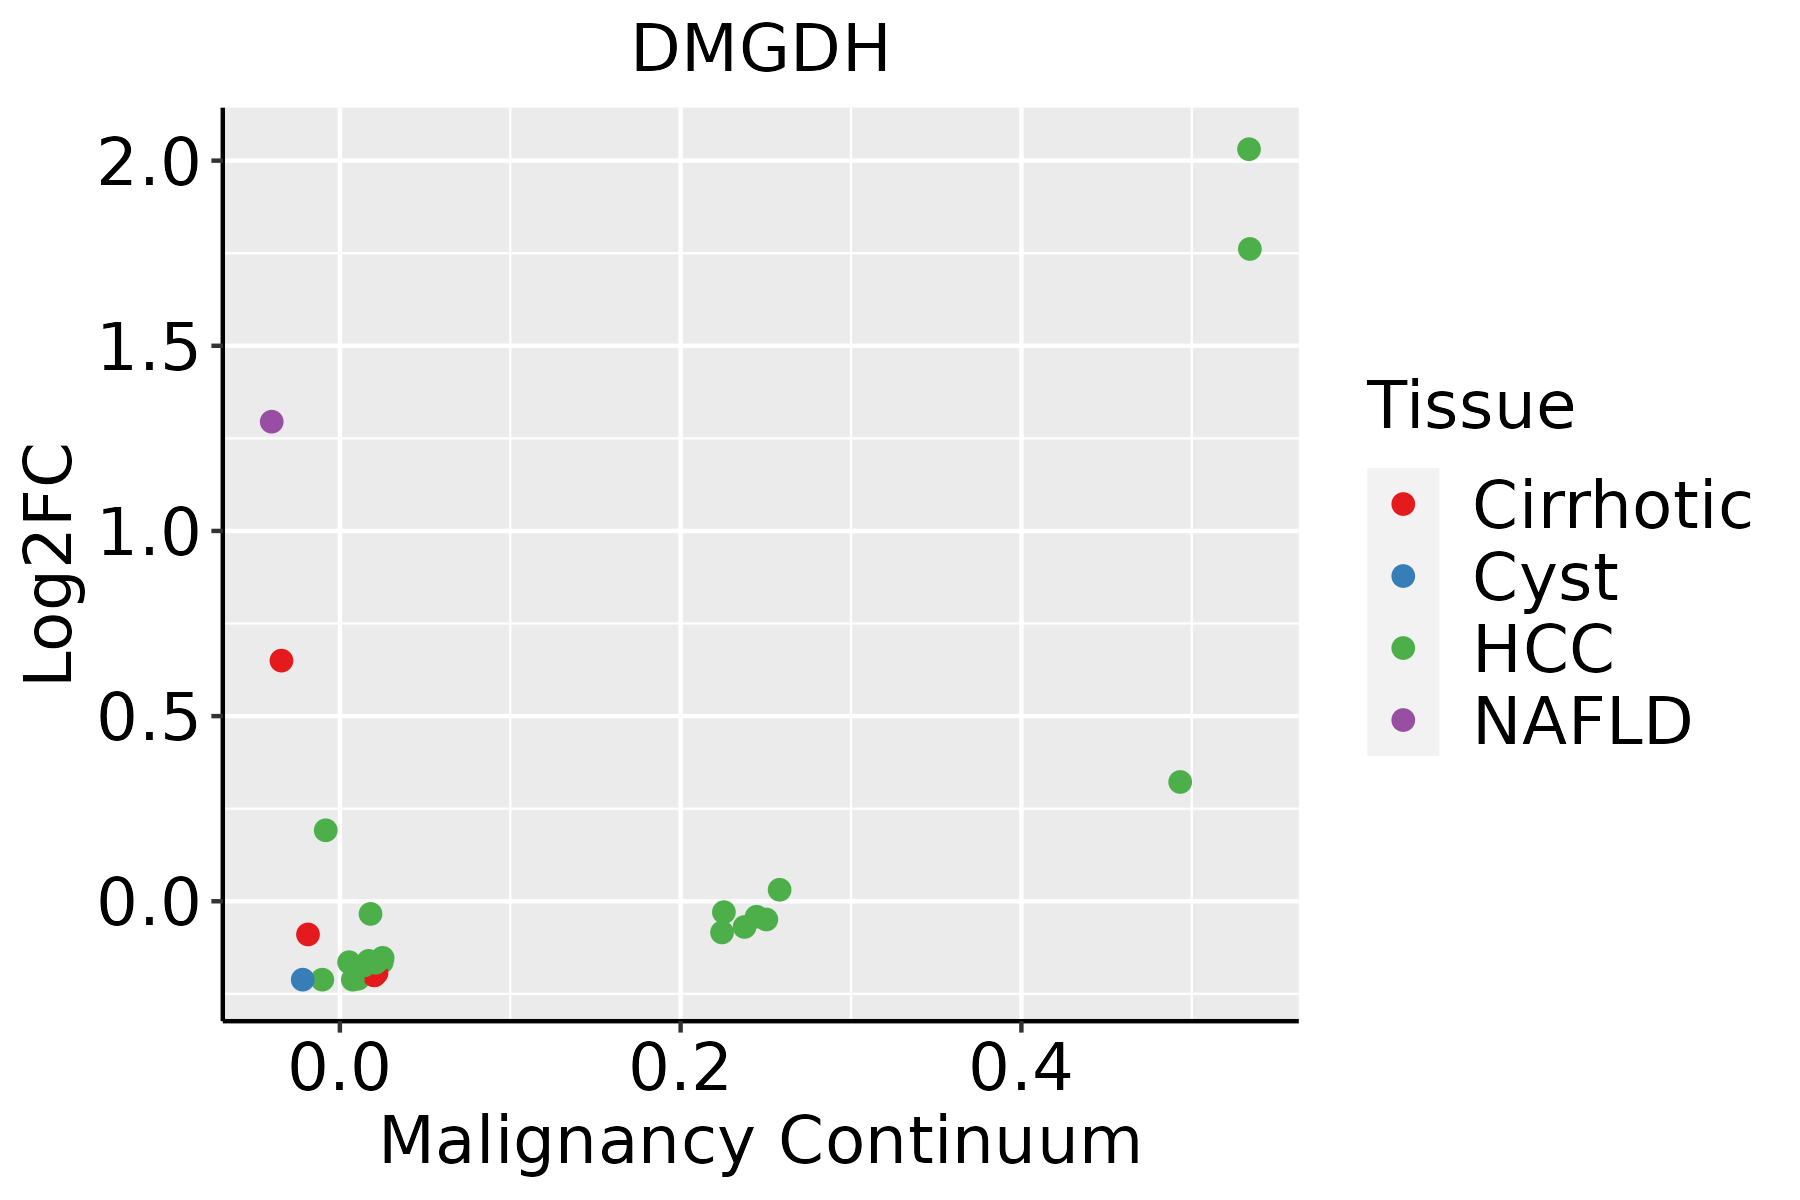 | HCC: Hepatocellular carcinoma |
| NAFLD: Non-alcoholic fatty liver disease |
| ∗log2FC in expression of this searched gene in stem-like cells from each diseased tissue sample relative to stem-like cells in normal samples in each tissue plotted against the malignancy continuum. Samples are colored based on if they are from different disease stage. |
Top |
Malignant transformation related pathway analysis |
| Find out the enriched GO biological processes and KEGG pathways involved in transition from healthy to precancer to cancer |
| Tissue | Disease Stage | Enriched GO biological Processes |
| Colorectum | AD |  |
| Colorectum | SER |  |
| Colorectum | MSS |  |
| Colorectum | MSI-H |  |
| Colorectum | FAP |  |
| ∗Top 15 enriched GO BP terms are showed in the bar plot of each disease state in each tissue. Each row represents a significant GO biological process which is colored according to the -log10(p.adjust). |
| Page: 1 2 3 4 5 6 7 8 9 |
| GO ID | Tissue | Disease Stage | Description | Gene Ratio | Bg Ratio | pvalue | p.adjust | Count |
| GO:0006091 | Colorectum | AD | generation of precursor metabolites and energy | 209/3918 | 490/18723 | 3.17e-28 | 6.61e-25 | 209 |
| GO:0022900 | Colorectum | AD | electron transport chain | 89/3918 | 175/18723 | 1.42e-18 | 8.91e-16 | 89 |
| GO:0044270 | Colorectum | AD | cellular nitrogen compound catabolic process | 147/3918 | 451/18723 | 3.35e-09 | 2.23e-07 | 147 |
| GO:0006575 | Colorectum | AD | cellular modified amino acid metabolic process | 59/3918 | 188/18723 | 4.80e-04 | 5.27e-03 | 59 |
| GO:00060911 | Colorectum | SER | generation of precursor metabolites and energy | 168/2897 | 490/18723 | 1.39e-25 | 1.70e-22 | 168 |
| GO:00229001 | Colorectum | SER | electron transport chain | 77/2897 | 175/18723 | 1.77e-19 | 1.36e-16 | 77 |
| GO:00442701 | Colorectum | SER | cellular nitrogen compound catabolic process | 99/2897 | 451/18723 | 1.46e-04 | 2.86e-03 | 99 |
| GO:00060912 | Colorectum | MSS | generation of precursor metabolites and energy | 186/3467 | 490/18723 | 1.14e-24 | 2.15e-21 | 186 |
| GO:00229002 | Colorectum | MSS | electron transport chain | 83/3467 | 175/18723 | 2.06e-18 | 1.17e-15 | 83 |
| GO:00442702 | Colorectum | MSS | cellular nitrogen compound catabolic process | 141/3467 | 451/18723 | 2.95e-11 | 3.83e-09 | 141 |
| GO:00065751 | Colorectum | MSS | cellular modified amino acid metabolic process | 55/3467 | 188/18723 | 2.16e-04 | 3.01e-03 | 55 |
| GO:00060914 | Colorectum | FAP | generation of precursor metabolites and energy | 128/2622 | 490/18723 | 5.58e-13 | 4.28e-10 | 128 |
| GO:00229004 | Colorectum | FAP | electron transport chain | 51/2622 | 175/18723 | 1.44e-07 | 9.03e-06 | 51 |
| GO:00442704 | Colorectum | FAP | cellular nitrogen compound catabolic process | 101/2622 | 451/18723 | 7.42e-07 | 3.44e-05 | 101 |
| GO:00442707 | Liver | NAFLD | cellular nitrogen compound catabolic process | 93/1882 | 451/18723 | 1.04e-11 | 4.34e-09 | 93 |
| GO:00060917 | Liver | NAFLD | generation of precursor metabolites and energy | 84/1882 | 490/18723 | 7.03e-07 | 3.95e-05 | 84 |
| GO:0009310 | Liver | NAFLD | amine catabolic process | 9/1882 | 29/18723 | 1.59e-03 | 1.71e-02 | 9 |
| GO:0042402 | Liver | NAFLD | cellular biogenic amine catabolic process | 8/1882 | 27/18723 | 3.97e-03 | 3.34e-02 | 8 |
| GO:00065754 | Liver | NAFLD | cellular modified amino acid metabolic process | 31/1882 | 188/18723 | 3.98e-03 | 3.34e-02 | 31 |
| GO:00229007 | Liver | NAFLD | electron transport chain | 29/1882 | 175/18723 | 4.87e-03 | 3.84e-02 | 29 |
| Page: 1 2 |
| Pathway ID | Tissue | Disease Stage | Description | Gene Ratio | Bg Ratio | pvalue | p.adjust | qvalue | Count |
| hsa00260 | Liver | Cirrhotic | Glycine, serine and threonine metabolism | 22/2530 | 40/8465 | 7.85e-04 | 4.51e-03 | 2.78e-03 | 22 |
| hsa002601 | Liver | Cirrhotic | Glycine, serine and threonine metabolism | 22/2530 | 40/8465 | 7.85e-04 | 4.51e-03 | 2.78e-03 | 22 |
| hsa002602 | Liver | HCC | Glycine, serine and threonine metabolism | 28/4020 | 40/8465 | 3.28e-03 | 1.07e-02 | 5.93e-03 | 28 |
| hsa002603 | Liver | HCC | Glycine, serine and threonine metabolism | 28/4020 | 40/8465 | 3.28e-03 | 1.07e-02 | 5.93e-03 | 28 |
| Page: 1 |
Top |
Cell-cell communication analysis |
| Identification of potential cell-cell interactions between two cell types and their ligand-receptor pairs for different disease states |
| Ligand | Receptor | LRpair | Pathway | Tissue | Disease Stage |
| Page: 1 |
Top |
Single-cell gene regulatory network inference analysis |
| Find out the significant the regulons (TFs) and the target genes of each regulon across cell types for different disease states |
| TF | Cell Type | Tissue | Disease Stage | Target Gene | RSS | Regulon Activity |
| ∗The dot plots of a searched regulon are shown for all cell subpopulations in each disease state of each tissue based on the regulon specific score inferred using pySCENIC and by calculating the average expression. |
| Page: 1 |
Top |
Somatic mutation of malignant transformation related genes |
| Annotation of somatic variants for genes involved in malignant transformation |
| Hugo Symbol | Variant Class | Variant Classification | dbSNP RS | HGVSc | HGVSp | HGVSp Short | SWISSPROT | BIOTYPE | SIFT | PolyPhen | Tumor Sample Barcode | Tissue | Histology | Sex | Age | Stage | Therapy Types | Drugs | Outcome |
| DMGDH | SNV | Missense_Mutation | c.331N>A | p.Asp111Asn | p.D111N | Q9UI17 | protein_coding | tolerated(0.99) | benign(0.005) | TCGA-A2-A0YK-01 | Breast | breast invasive carcinoma | Female | <65 | I/II | Chemotherapy | cytoxan | SD | |
| DMGDH | SNV | Missense_Mutation | novel | c.1615N>C | p.Lys539Gln | p.K539Q | Q9UI17 | protein_coding | deleterious(0) | probably_damaging(1) | TCGA-A7-A6VW-01 | Breast | breast invasive carcinoma | Female | <65 | I/II | Chemotherapy | doxorubicin | CR |
| DMGDH | SNV | Missense_Mutation | c.1708N>G | p.Met570Val | p.M570V | Q9UI17 | protein_coding | tolerated(0.1) | benign(0.34) | TCGA-AN-A041-01 | Breast | breast invasive carcinoma | Female | <65 | I/II | Unknown | Unknown | SD | |
| DMGDH | SNV | Missense_Mutation | c.362N>G | p.Glu121Gly | p.E121G | Q9UI17 | protein_coding | tolerated(0.06) | benign(0.285) | TCGA-AO-A128-01 | Breast | breast invasive carcinoma | Female | <65 | I/II | Chemotherapy | doxorubicin | SD | |
| DMGDH | SNV | Missense_Mutation | c.997T>A | p.Phe333Ile | p.F333I | Q9UI17 | protein_coding | deleterious(0) | possibly_damaging(0.506) | TCGA-AO-A1KR-01 | Breast | breast invasive carcinoma | Female | <65 | I/II | Chemotherapy | cyclophosphamide | SD | |
| DMGDH | SNV | Missense_Mutation | c.1017G>T | p.Glu339Asp | p.E339D | Q9UI17 | protein_coding | tolerated(0.07) | benign(0.098) | TCGA-BH-A0BZ-01 | Breast | breast invasive carcinoma | Female | <65 | III/IV | Chemotherapy | doxorubicin | CR | |
| DMGDH | SNV | Missense_Mutation | novel | c.397N>C | p.Gly133Arg | p.G133R | Q9UI17 | protein_coding | deleterious(0) | probably_damaging(1) | TCGA-GM-A2DO-01 | Breast | breast invasive carcinoma | Female | <65 | I/II | Hormone Therapy | tamoxiphen | CR |
| DMGDH | deletion | Frame_Shift_Del | novel | c.1504delN | p.Asp502ThrfsTer28 | p.D502Tfs*28 | Q9UI17 | protein_coding | TCGA-EW-A2FV-01 | Breast | breast invasive carcinoma | Female | <65 | III/IV | Chemotherapy | docetaxel | SD | ||
| DMGDH | SNV | Missense_Mutation | c.361G>A | p.Glu121Lys | p.E121K | Q9UI17 | protein_coding | tolerated(0.34) | benign(0.05) | TCGA-EK-A2PG-01 | Cervix | cervical & endocervical cancer | Female | >=65 | I/II | Unknown | Unknown | SD | |
| DMGDH | SNV | Missense_Mutation | novel | c.1973A>G | p.Gln658Arg | p.Q658R | Q9UI17 | protein_coding | tolerated(0.35) | benign(0.01) | TCGA-VS-A9UU-01 | Cervix | cervical & endocervical cancer | Female | <65 | I/II | Chemotherapy | cisplatin | CR |
| Page: 1 2 3 4 5 6 7 8 9 10 |
Top |
Related drugs of malignant transformation related genes |
| Identification of chemicals and drugs interact with genes involved in malignant transfromation |
| (DGIdb 4.0) |
| Entrez ID | Symbol | Category | Interaction Types | Drug Claim Name | Drug Name | PMIDs |
| Page: 1 |

Copyright 2023-Present -The University of Texas Health Science Center at Houston |