
|
|||||
|
 | |
| |
| |
| |
| |
| |
|
Gene: DMD |
Gene summary for DMD |
| Gene information | Species | Human | Gene symbol | DMD | Gene ID | 1756 |
| Gene name | dystrophin | |
| Gene Alias | BMD | |
| Cytomap | Xp21.2-p21.1 | |
| Gene Type | protein-coding | GO ID | GO:0001508 | UniProtAcc | P11532 |
Top |
Malignant transformation analysis |
| Identification of the aberrant gene expression in precancerous and cancerous lesions by comparing the gene expression of stem-like cells in diseased tissues with normal stem cells |
| Entrez ID | Symbol | Replicates | Species | Organ | Tissue | Adj P-value | Log2FC | Malignancy |
| 1756 | DMD | AEH-subject3 | Human | Endometrium | AEH | 8.07e-03 | 2.17e-01 | -0.2576 |
| 1756 | DMD | P2T-E | Human | Esophagus | ESCC | 7.44e-31 | 6.86e-01 | 0.1177 |
| 1756 | DMD | P5T-E | Human | Esophagus | ESCC | 8.69e-05 | 9.68e-02 | 0.1327 |
| 1756 | DMD | P10T-E | Human | Esophagus | ESCC | 2.17e-25 | 6.02e-01 | 0.116 |
| 1756 | DMD | P11T-E | Human | Esophagus | ESCC | 5.71e-04 | 2.89e-01 | 0.1426 |
| 1756 | DMD | P16T-E | Human | Esophagus | ESCC | 3.86e-22 | 4.30e-01 | 0.1153 |
| 1756 | DMD | P19T-E | Human | Esophagus | ESCC | 3.17e-07 | 6.15e-01 | 0.1662 |
| 1756 | DMD | P23T-E | Human | Esophagus | ESCC | 2.11e-08 | 3.42e-01 | 0.108 |
| 1756 | DMD | P26T-E | Human | Esophagus | ESCC | 2.75e-09 | 2.07e-01 | 0.1276 |
| 1756 | DMD | P28T-E | Human | Esophagus | ESCC | 3.51e-05 | 6.28e-02 | 0.1149 |
| 1756 | DMD | P37T-E | Human | Esophagus | ESCC | 3.04e-16 | 3.87e-01 | 0.1371 |
| 1756 | DMD | P44T-E | Human | Esophagus | ESCC | 1.98e-05 | 1.65e-01 | 0.1096 |
| 1756 | DMD | P52T-E | Human | Esophagus | ESCC | 1.33e-08 | 1.64e-01 | 0.1555 |
| 1756 | DMD | P57T-E | Human | Esophagus | ESCC | 6.92e-12 | 1.89e-01 | 0.0926 |
| 1756 | DMD | P61T-E | Human | Esophagus | ESCC | 7.74e-05 | 1.28e-01 | 0.099 |
| 1756 | DMD | P76T-E | Human | Esophagus | ESCC | 7.65e-19 | 3.83e-01 | 0.1207 |
| 1756 | DMD | P79T-E | Human | Esophagus | ESCC | 1.12e-10 | 2.13e-01 | 0.1154 |
| 1756 | DMD | P107T-E | Human | Esophagus | ESCC | 9.51e-05 | 1.01e-01 | 0.171 |
| 1756 | DMD | P128T-E | Human | Esophagus | ESCC | 1.87e-05 | 3.19e-01 | 0.1241 |
| 1756 | DMD | P130T-E | Human | Esophagus | ESCC | 1.65e-03 | 1.22e-01 | 0.1676 |
| Page: 1 2 3 |
| Tissue | Expression Dynamics | Abbreviation |
| Endometrium |  | AEH: Atypical endometrial hyperplasia |
| EEC: Endometrioid Cancer | ||
| Esophagus | 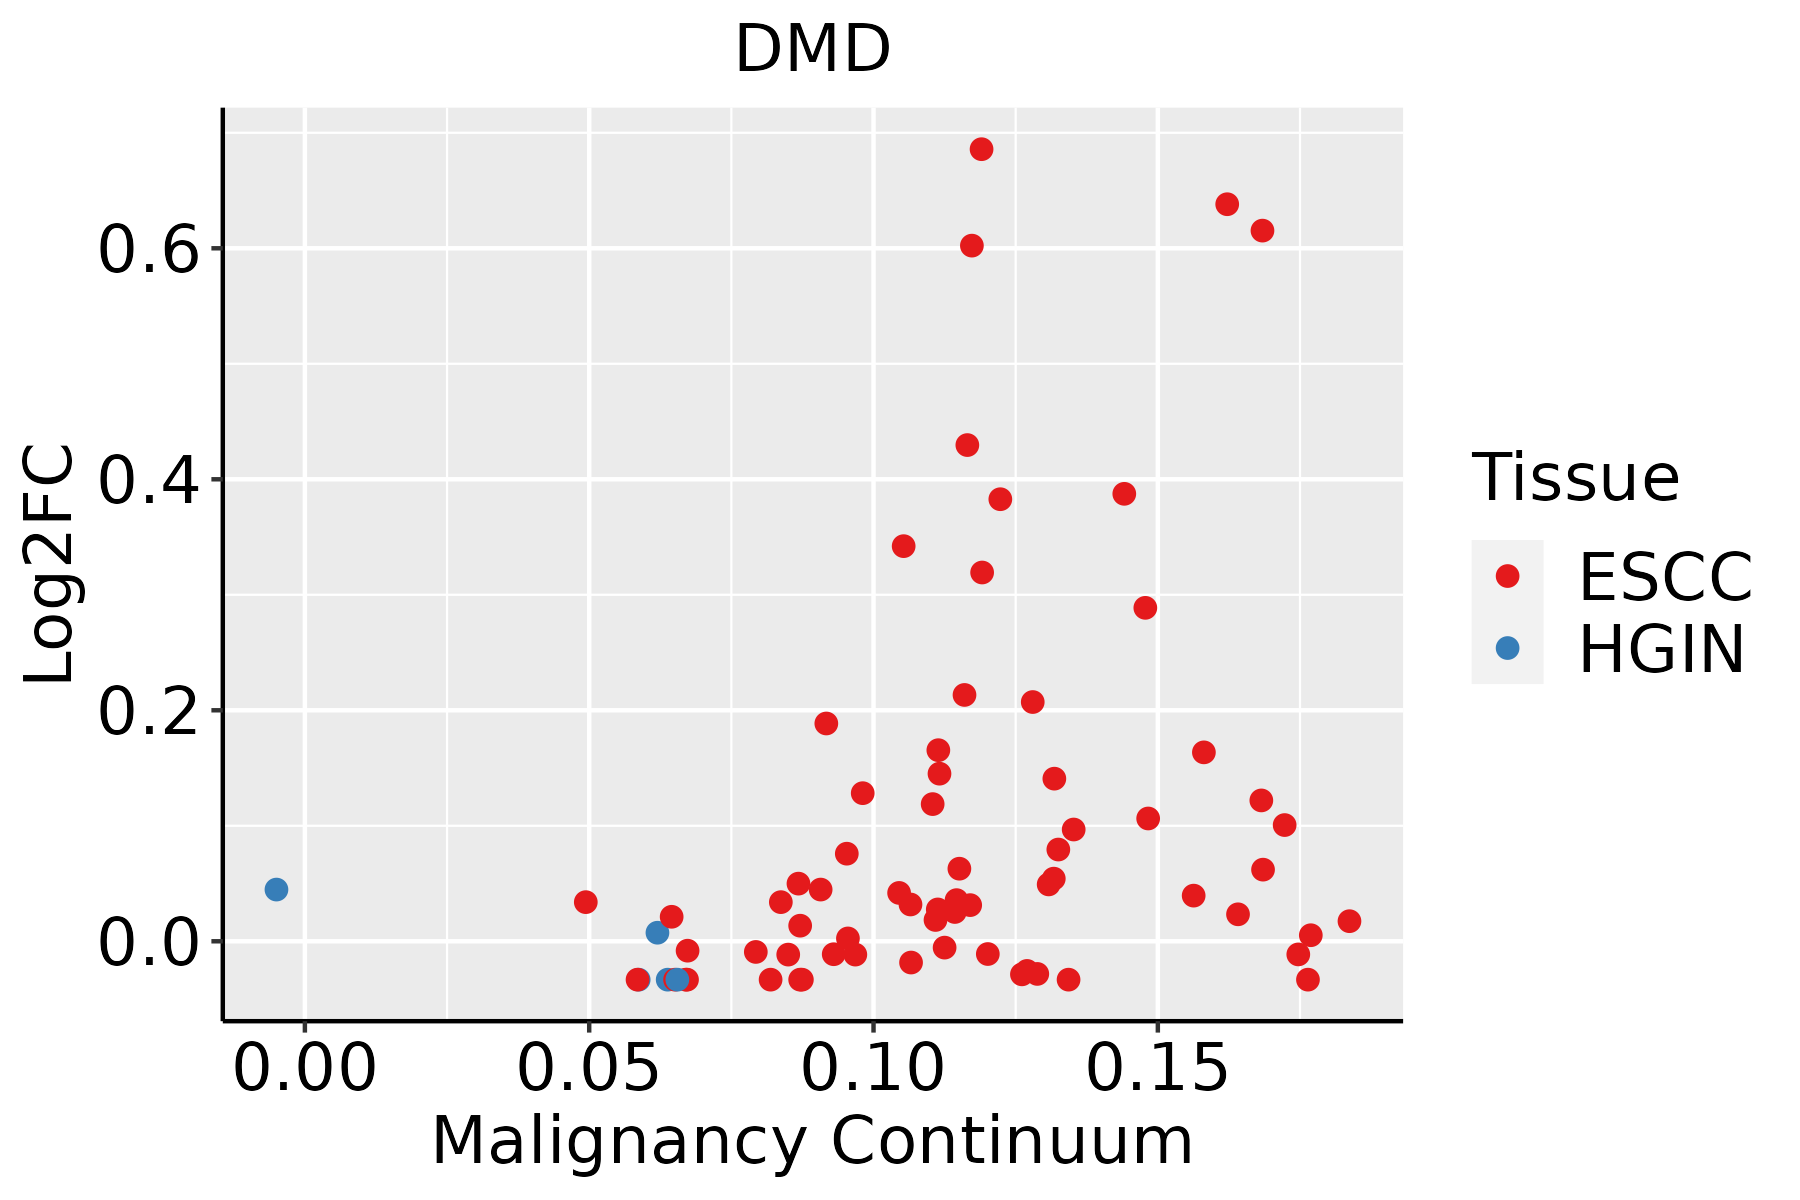 | ESCC: Esophageal squamous cell carcinoma |
| HGIN: High-grade intraepithelial neoplasias | ||
| LGIN: Low-grade intraepithelial neoplasias | ||
| Liver | 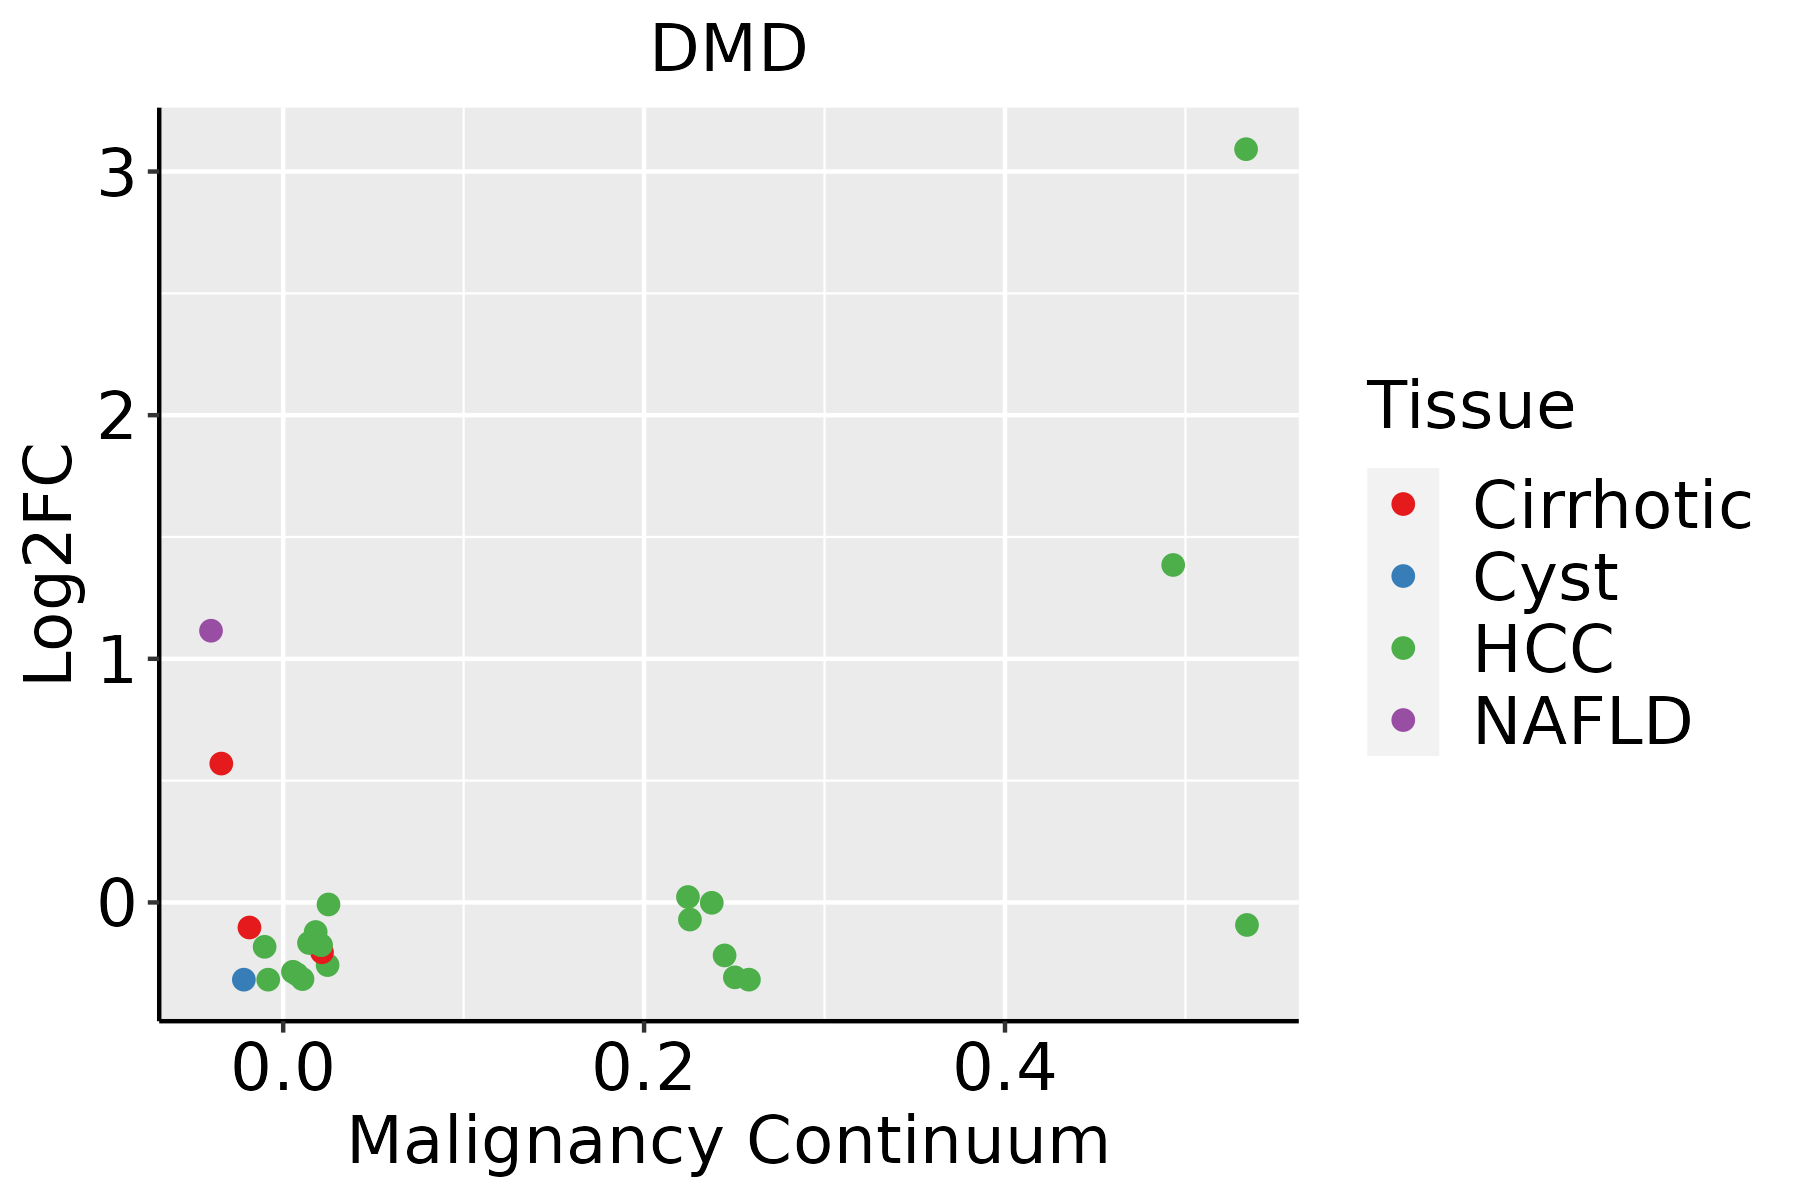 | HCC: Hepatocellular carcinoma |
| NAFLD: Non-alcoholic fatty liver disease | ||
| Lung | 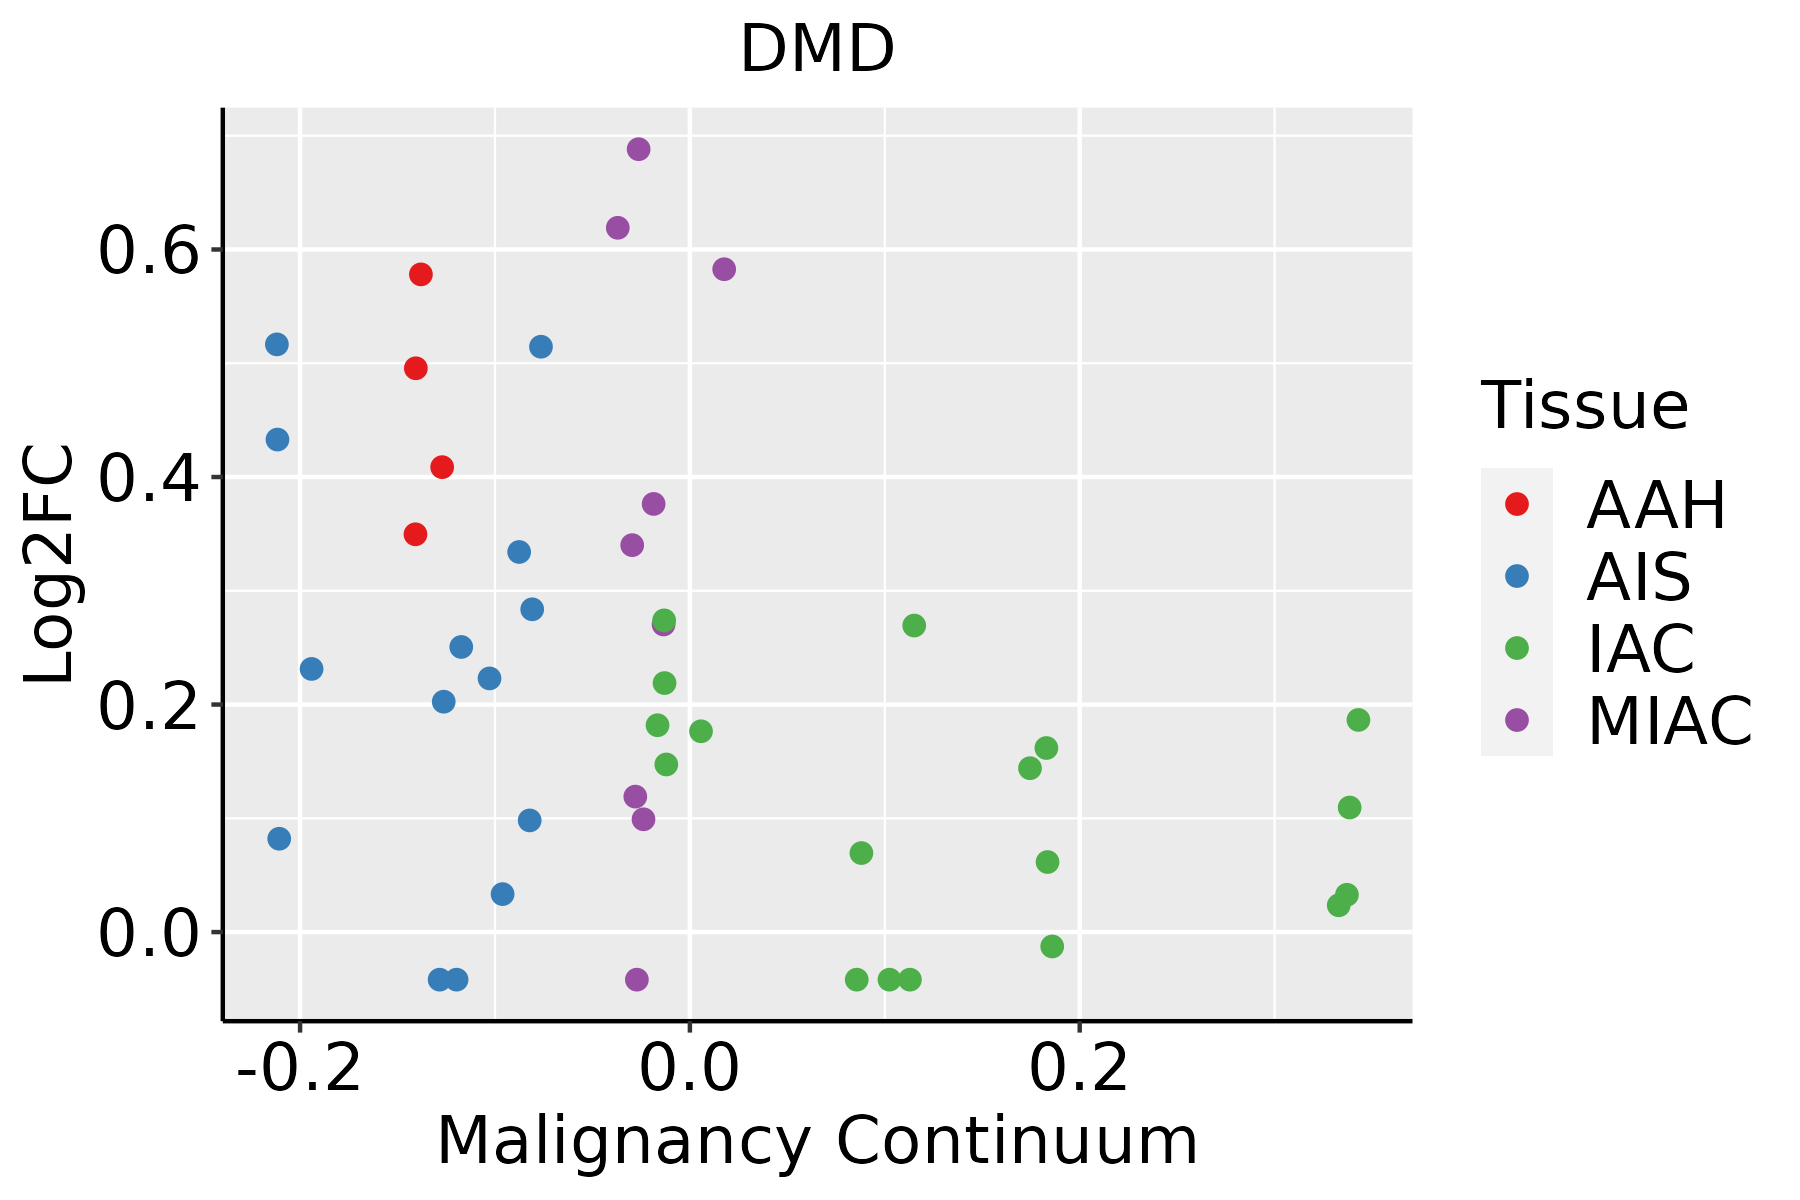 | AAH: Atypical adenomatous hyperplasia |
| AIS: Adenocarcinoma in situ | ||
| IAC: Invasive lung adenocarcinoma | ||
| MIA: Minimally invasive adenocarcinoma | ||
| Thyroid | 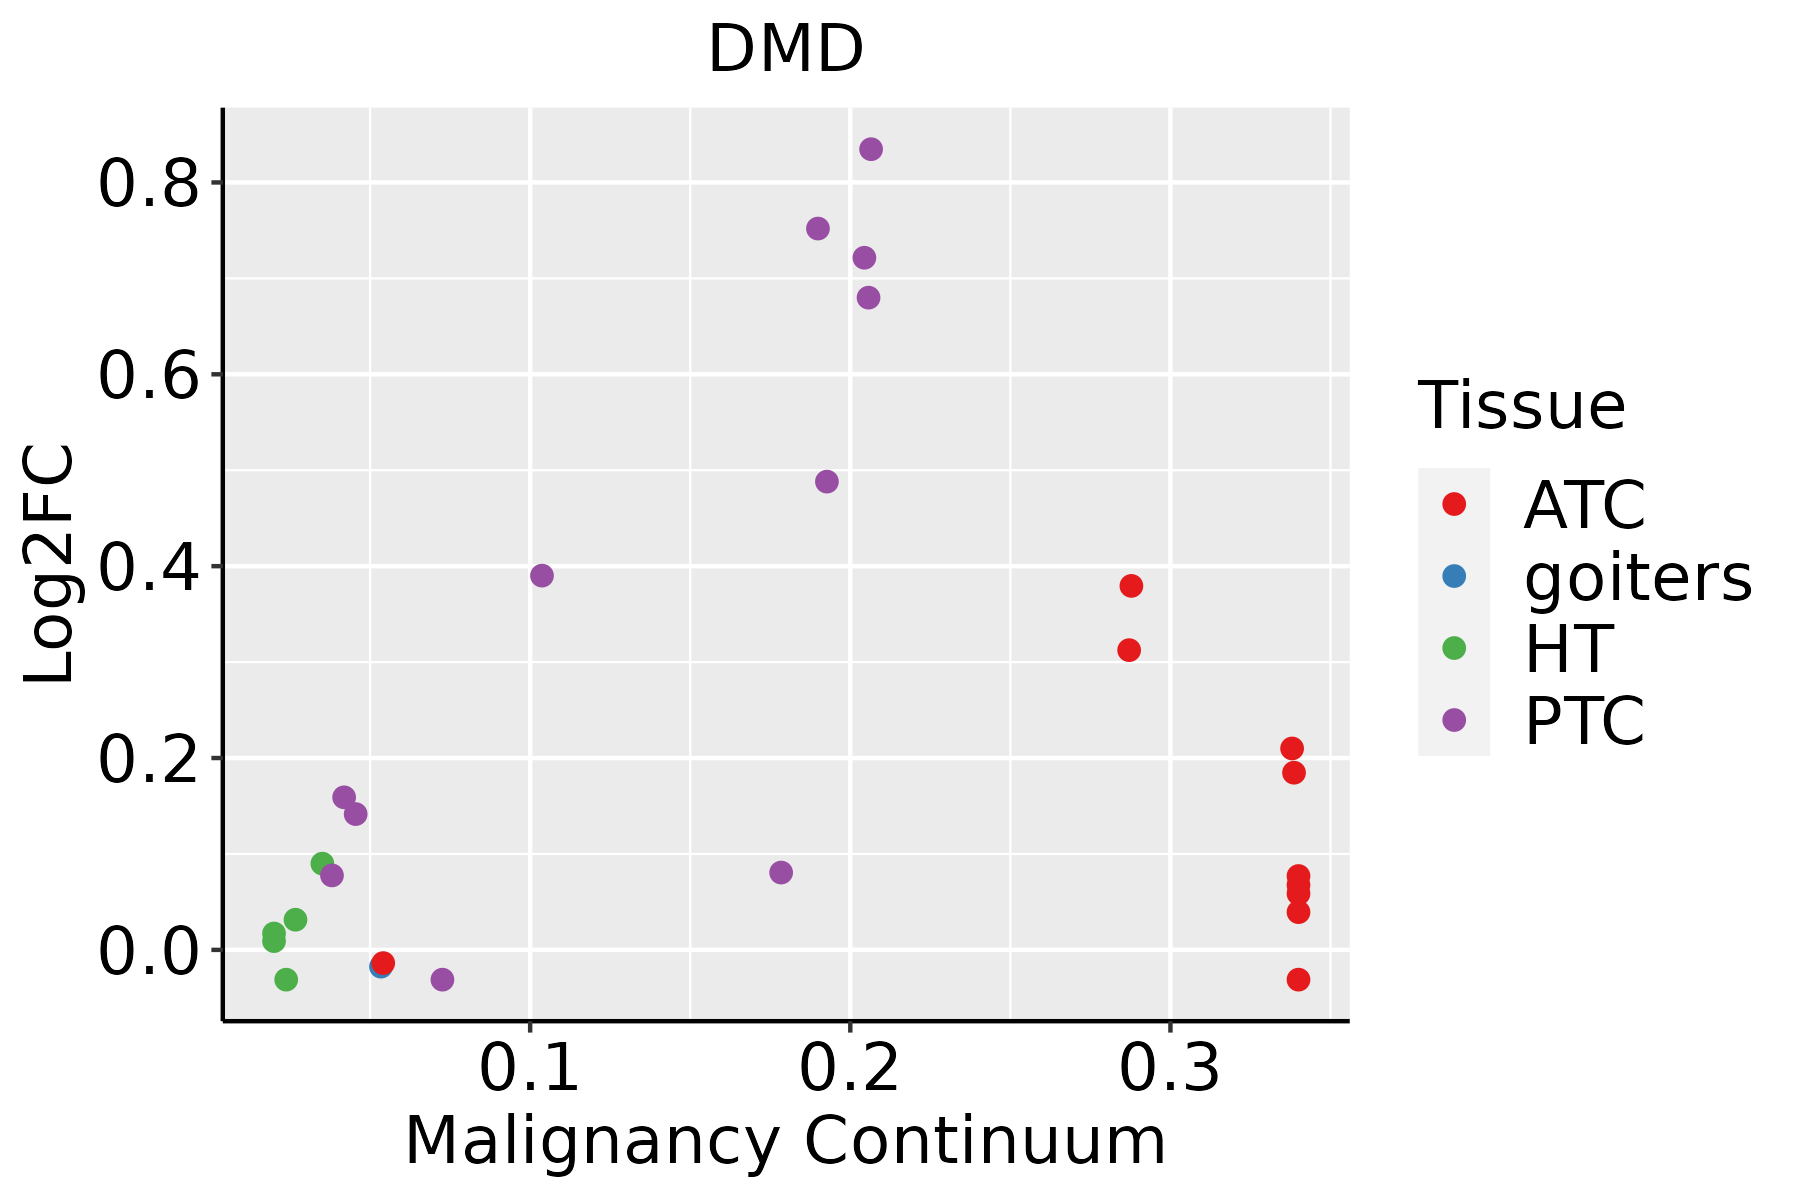 | ATC: Anaplastic thyroid cancer |
| HT: Hashimoto's thyroiditis | ||
| PTC: Papillary thyroid cancer |
| ∗log2FC in expression of this searched gene in stem-like cells from each diseased tissue sample relative to stem-like cells in normal samples in each tissue plotted against the malignancy continuum. Samples are colored based on if they are from different disease stage. |
Top |
Malignant transformation related pathway analysis |
| Find out the enriched GO biological processes and KEGG pathways involved in transition from healthy to precancer to cancer |
| Tissue | Disease Stage | Enriched GO biological Processes |
| Colorectum | AD |  |
| Colorectum | SER |  |
| Colorectum | MSS |  |
| Colorectum | MSI-H |  |
| Colorectum | FAP |  |
| ∗Top 15 enriched GO BP terms are showed in the bar plot of each disease state in each tissue. Each row represents a significant GO biological process which is colored according to the -log10(p.adjust). |
| Page: 1 2 3 4 5 6 7 8 9 |
| GO ID | Tissue | Disease Stage | Description | Gene Ratio | Bg Ratio | pvalue | p.adjust | Count |
| GO:00018196 | Breast | Precancer | positive regulation of cytokine production | 52/1080 | 467/18723 | 4.18e-06 | 1.29e-04 | 52 |
| GO:00714969 | Breast | Precancer | cellular response to external stimulus | 33/1080 | 320/18723 | 9.01e-04 | 1.03e-02 | 33 |
| GO:00316688 | Breast | Precancer | cellular response to extracellular stimulus | 27/1080 | 246/18723 | 1.02e-03 | 1.13e-02 | 27 |
| GO:0032732 | Breast | Precancer | positive regulation of interleukin-1 production | 11/1080 | 73/18723 | 2.96e-03 | 2.55e-02 | 11 |
| GO:000181911 | Breast | IDC | positive regulation of cytokine production | 61/1434 | 467/18723 | 2.81e-05 | 6.58e-04 | 61 |
| GO:007149614 | Breast | IDC | cellular response to external stimulus | 45/1434 | 320/18723 | 5.40e-05 | 1.15e-03 | 45 |
| GO:003166814 | Breast | IDC | cellular response to extracellular stimulus | 35/1434 | 246/18723 | 2.79e-04 | 4.26e-03 | 35 |
| GO:00358214 | Breast | IDC | modulation of process of other organism | 16/1434 | 106/18723 | 6.70e-03 | 4.66e-02 | 16 |
| GO:000181921 | Breast | DCIS | positive regulation of cytokine production | 63/1390 | 467/18723 | 2.76e-06 | 9.42e-05 | 63 |
| GO:007149623 | Breast | DCIS | cellular response to external stimulus | 45/1390 | 320/18723 | 2.55e-05 | 5.87e-04 | 45 |
| GO:003166822 | Breast | DCIS | cellular response to extracellular stimulus | 35/1390 | 246/18723 | 1.54e-04 | 2.59e-03 | 35 |
| GO:00327321 | Breast | DCIS | positive regulation of interleukin-1 production | 13/1390 | 73/18723 | 2.57e-03 | 2.30e-02 | 13 |
| GO:0071496 | Colorectum | AD | cellular response to external stimulus | 94/3918 | 320/18723 | 1.98e-04 | 2.64e-03 | 94 |
| GO:0031668 | Colorectum | AD | cellular response to extracellular stimulus | 71/3918 | 246/18723 | 1.86e-03 | 1.52e-02 | 71 |
| GO:0035821 | Colorectum | AD | modulation of process of other organism | 34/3918 | 106/18723 | 4.73e-03 | 3.22e-02 | 34 |
| GO:00714961 | Colorectum | SER | cellular response to external stimulus | 70/2897 | 320/18723 | 1.40e-03 | 1.53e-02 | 70 |
| GO:00316681 | Colorectum | SER | cellular response to extracellular stimulus | 54/2897 | 246/18723 | 4.26e-03 | 3.45e-02 | 54 |
| GO:00714962 | Colorectum | MSS | cellular response to external stimulus | 82/3467 | 320/18723 | 9.30e-04 | 9.44e-03 | 82 |
| GO:00358211 | Colorectum | MSS | modulation of process of other organism | 33/3467 | 106/18723 | 1.18e-03 | 1.14e-02 | 33 |
| GO:00316682 | Colorectum | MSS | cellular response to extracellular stimulus | 62/3467 | 246/18723 | 5.39e-03 | 3.67e-02 | 62 |
| Page: 1 2 3 4 5 6 7 8 9 10 11 12 13 14 |
| Pathway ID | Tissue | Disease Stage | Description | Gene Ratio | Bg Ratio | pvalue | p.adjust | qvalue | Count |
| hsa0541625 | Endometrium | AEH | Viral myocarditis | 27/1197 | 60/8465 | 6.98e-09 | 1.13e-07 | 8.30e-08 | 27 |
| hsa05416111 | Endometrium | AEH | Viral myocarditis | 27/1197 | 60/8465 | 6.98e-09 | 1.13e-07 | 8.30e-08 | 27 |
| hsa0541630 | Esophagus | ESCC | Viral myocarditis | 41/4205 | 60/8465 | 2.59e-03 | 7.05e-03 | 3.61e-03 | 41 |
| hsa05416114 | Esophagus | ESCC | Viral myocarditis | 41/4205 | 60/8465 | 2.59e-03 | 7.05e-03 | 3.61e-03 | 41 |
| hsa0541614 | Liver | Cirrhotic | Viral myocarditis | 28/2530 | 60/8465 | 4.38e-03 | 1.68e-02 | 1.03e-02 | 28 |
| hsa0541615 | Liver | Cirrhotic | Viral myocarditis | 28/2530 | 60/8465 | 4.38e-03 | 1.68e-02 | 1.03e-02 | 28 |
| hsa0541616 | Lung | IAC | Viral myocarditis | 21/1053 | 60/8465 | 5.30e-06 | 1.57e-04 | 1.04e-04 | 21 |
| hsa054126 | Lung | IAC | Arrhythmogenic right ventricular cardiomyopathy | 22/1053 | 77/8465 | 1.15e-04 | 1.49e-03 | 9.88e-04 | 22 |
| hsa05410 | Lung | IAC | Hypertrophic cardiomyopathy | 20/1053 | 90/8465 | 6.44e-03 | 2.68e-02 | 1.78e-02 | 20 |
| hsa05414 | Lung | IAC | Dilated cardiomyopathy | 20/1053 | 96/8465 | 1.33e-02 | 4.64e-02 | 3.08e-02 | 20 |
| hsa0541617 | Lung | IAC | Viral myocarditis | 21/1053 | 60/8465 | 5.30e-06 | 1.57e-04 | 1.04e-04 | 21 |
| hsa0541211 | Lung | IAC | Arrhythmogenic right ventricular cardiomyopathy | 22/1053 | 77/8465 | 1.15e-04 | 1.49e-03 | 9.88e-04 | 22 |
| hsa054101 | Lung | IAC | Hypertrophic cardiomyopathy | 20/1053 | 90/8465 | 6.44e-03 | 2.68e-02 | 1.78e-02 | 20 |
| hsa054141 | Lung | IAC | Dilated cardiomyopathy | 20/1053 | 96/8465 | 1.33e-02 | 4.64e-02 | 3.08e-02 | 20 |
| hsa0541622 | Lung | AIS | Viral myocarditis | 19/961 | 60/8465 | 2.01e-05 | 4.08e-04 | 2.61e-04 | 19 |
| hsa0541221 | Lung | AIS | Arrhythmogenic right ventricular cardiomyopathy | 21/961 | 77/8465 | 9.05e-05 | 1.18e-03 | 7.57e-04 | 21 |
| hsa054142 | Lung | AIS | Dilated cardiomyopathy | 22/961 | 96/8465 | 9.02e-04 | 7.11e-03 | 4.55e-03 | 22 |
| hsa054102 | Lung | AIS | Hypertrophic cardiomyopathy | 20/961 | 90/8465 | 2.25e-03 | 1.37e-02 | 8.80e-03 | 20 |
| hsa0541632 | Lung | AIS | Viral myocarditis | 19/961 | 60/8465 | 2.01e-05 | 4.08e-04 | 2.61e-04 | 19 |
| hsa0541231 | Lung | AIS | Arrhythmogenic right ventricular cardiomyopathy | 21/961 | 77/8465 | 9.05e-05 | 1.18e-03 | 7.57e-04 | 21 |
| Page: 1 2 |
Top |
Cell-cell communication analysis |
| Identification of potential cell-cell interactions between two cell types and their ligand-receptor pairs for different disease states |
| Ligand | Receptor | LRpair | Pathway | Tissue | Disease Stage |
| Page: 1 |
Top |
Single-cell gene regulatory network inference analysis |
| Find out the significant the regulons (TFs) and the target genes of each regulon across cell types for different disease states |
| TF | Cell Type | Tissue | Disease Stage | Target Gene | RSS | Regulon Activity |
| ∗The dot plots of a searched regulon are shown for all cell subpopulations in each disease state of each tissue based on the regulon specific score inferred using pySCENIC and by calculating the average expression. |
| Page: 1 |
Top |
Somatic mutation of malignant transformation related genes |
| Annotation of somatic variants for genes involved in malignant transformation |
| Hugo Symbol | Variant Class | Variant Classification | dbSNP RS | HGVSc | HGVSp | HGVSp Short | SWISSPROT | BIOTYPE | SIFT | PolyPhen | Tumor Sample Barcode | Tissue | Histology | Sex | Age | Stage | Therapy Types | Drugs | Outcome |
| DMD | SNV | Missense_Mutation | c.7468N>A | p.Asp2490Asn | p.D2490N | protein_coding | deleterious(0.01) | benign(0.343) | TCGA-A1-A0SH-01 | Breast | breast invasive carcinoma | Female | <65 | I/II | Chemotherapy | tc | SD | ||
| DMD | SNV | Missense_Mutation | c.811C>G | p.Gln271Glu | p.Q271E | protein_coding | tolerated(0.21) | benign(0.007) | TCGA-A1-A0SI-01 | Breast | breast invasive carcinoma | Female | <65 | I/II | Unknown | Unknown | SD | ||
| DMD | SNV | Missense_Mutation | c.3220G>A | p.Glu1074Lys | p.E1074K | protein_coding | deleterious(0) | probably_damaging(0.915) | TCGA-A2-A0CO-01 | Breast | breast invasive carcinoma | Female | >=65 | I/II | Hormone Therapy | tamoxiphen | CR | ||
| DMD | SNV | Missense_Mutation | c.5093N>A | p.Ala1698Asp | p.A1698D | protein_coding | deleterious(0) | possibly_damaging(0.739) | TCGA-A2-A25A-01 | Breast | breast invasive carcinoma | Female | <65 | I/II | Unspecific | Cytoxan | SD | ||
| DMD | SNV | Missense_Mutation | novel | c.6703N>T | p.Ser2235Cys | p.S2235C | protein_coding | tolerated(0.07) | benign(0.003) | TCGA-A2-A3XU-01 | Breast | breast invasive carcinoma | Female | <65 | I/II | Hormone Therapy | arimidex | PD | |
| DMD | SNV | Missense_Mutation | c.3215N>G | p.Lys1072Arg | p.K1072R | protein_coding | tolerated(0.49) | benign(0.358) | TCGA-A8-A08L-01 | Breast | breast invasive carcinoma | Female | >=65 | III/IV | Unknown | Unknown | SD | ||
| DMD | SNV | Missense_Mutation | rs772695216 | c.8999G>A | p.Arg3000His | p.R3000H | protein_coding | tolerated(0.33) | benign(0.001) | TCGA-A8-A09X-01 | Breast | breast invasive carcinoma | Female | <65 | III/IV | Unknown | Unknown | SD | |
| DMD | SNV | Missense_Mutation | c.3329A>C | p.Glu1110Ala | p.E1110A | protein_coding | deleterious(0) | possibly_damaging(0.883) | TCGA-A8-A09X-01 | Breast | breast invasive carcinoma | Female | <65 | III/IV | Unknown | Unknown | SD | ||
| DMD | SNV | Missense_Mutation | c.7687N>A | p.Glu2563Lys | p.E2563K | protein_coding | tolerated(0.22) | possibly_damaging(0.79) | TCGA-AC-A23H-01 | Breast | breast invasive carcinoma | Female | >=65 | I/II | Unknown | Unknown | PD | ||
| DMD | SNV | Missense_Mutation | c.5116N>A | p.Glu1706Lys | p.E1706K | protein_coding | tolerated(0.1) | probably_damaging(0.991) | TCGA-AC-A23H-01 | Breast | breast invasive carcinoma | Female | >=65 | I/II | Unknown | Unknown | PD |
| Page: 1 2 3 4 5 6 7 8 9 10 11 12 13 14 15 16 17 18 19 20 21 22 23 24 25 26 27 28 29 30 31 32 33 34 35 36 37 38 39 40 41 42 43 44 45 46 47 48 49 50 51 52 53 54 55 56 57 58 59 60 61 62 63 64 65 66 67 68 69 70 71 72 73 74 75 |
Top |
Related drugs of malignant transformation related genes |
| Identification of chemicals and drugs interact with genes involved in malignant transfromation |
| (DGIdb 4.0) |
| Entrez ID | Symbol | Category | Interaction Types | Drug Claim Name | Drug Name | PMIDs |
| 1756 | DMD | CELL SURFACE, TRANSPORTER, DRUGGABLE GENOME | Ataluren | ATALUREN | ||
| 1756 | DMD | CELL SURFACE, TRANSPORTER, DRUGGABLE GENOME | WVE-210201 | |||
| 1756 | DMD | CELL SURFACE, TRANSPORTER, DRUGGABLE GENOME | Golodirsen | GOLODIRSEN | ||
| 1756 | DMD | CELL SURFACE, TRANSPORTER, DRUGGABLE GENOME | PRO044 | |||
| 1756 | DMD | CELL SURFACE, TRANSPORTER, DRUGGABLE GENOME | eteplirsen | ETEPLIRSEN | ||
| 1756 | DMD | CELL SURFACE, TRANSPORTER, DRUGGABLE GENOME | DYSTROPHIN | |||
| 1756 | DMD | CELL SURFACE, TRANSPORTER, DRUGGABLE GENOME | MyoDys | |||
| 1756 | DMD | CELL SURFACE, TRANSPORTER, DRUGGABLE GENOME | Biostrophin | |||
| 1756 | DMD | CELL SURFACE, TRANSPORTER, DRUGGABLE GENOME | Eteplirsen | ETEPLIRSEN | ||
| 1756 | DMD | CELL SURFACE, TRANSPORTER, DRUGGABLE GENOME | Golodirsen | GOLODIRSEN |
| Page: 1 |

Copyright 2023-Present -The University of Texas Health Science Center at Houston |