
|
|||||
|
 | |
| |
| |
| |
| |
| |
|
Gene: DMBT1 |
Gene summary for DMBT1 |
| Gene information | Species | Human | Gene symbol | DMBT1 | Gene ID | 1755 |
| Gene name | deleted in malignant brain tumors 1 | |
| Gene Alias | GP340 | |
| Cytomap | 10q26.13 | |
| Gene Type | protein-coding | GO ID | GO:0002237 | UniProtAcc | Q9UGM3 |
Top |
Malignant transformation analysis |
| Identification of the aberrant gene expression in precancerous and cancerous lesions by comparing the gene expression of stem-like cells in diseased tissues with normal stem cells |
| Entrez ID | Symbol | Replicates | Species | Organ | Tissue | Adj P-value | Log2FC | Malignancy |
| 1755 | DMBT1 | HTA11_78_2000001011 | Human | Colorectum | AD | 3.36e-02 | -3.00e-01 | -0.1088 |
| 1755 | DMBT1 | HTA11_347_2000001011 | Human | Colorectum | AD | 1.32e-05 | -4.99e-02 | -0.1954 |
| 1755 | DMBT1 | HTA11_1391_2000001011 | Human | Colorectum | AD | 3.34e-20 | 2.56e+00 | -0.059 |
| 1755 | DMBT1 | HTA11_866_3004761011 | Human | Colorectum | AD | 5.01e-05 | 8.03e-01 | 0.096 |
| 1755 | DMBT1 | HTA11_7696_3000711011 | Human | Colorectum | AD | 1.94e-06 | -3.27e-01 | 0.0674 |
| 1755 | DMBT1 | HTA11_99999965104_69814 | Human | Colorectum | MSS | 1.70e-03 | 8.66e-01 | 0.281 |
| 1755 | DMBT1 | HTA11_99999971662_82457 | Human | Colorectum | MSS | 6.51e-13 | -4.04e-01 | 0.3859 |
| 1755 | DMBT1 | HTA11_99999974143_84620 | Human | Colorectum | MSS | 6.58e-17 | -4.18e-01 | 0.3005 |
| 1755 | DMBT1 | F007 | Human | Colorectum | FAP | 2.60e-03 | -4.03e-01 | 0.1176 |
| 1755 | DMBT1 | A002-C-010 | Human | Colorectum | FAP | 4.40e-05 | -2.20e-01 | 0.242 |
| 1755 | DMBT1 | A001-C-207 | Human | Colorectum | FAP | 1.78e-08 | -4.22e-01 | 0.1278 |
| 1755 | DMBT1 | A015-C-203 | Human | Colorectum | FAP | 7.63e-19 | -4.22e-01 | -0.1294 |
| 1755 | DMBT1 | A015-C-204 | Human | Colorectum | FAP | 1.18e-08 | -4.22e-01 | -0.0228 |
| 1755 | DMBT1 | A001-C-119 | Human | Colorectum | FAP | 8.75e-07 | -4.22e-01 | -0.1557 |
| 1755 | DMBT1 | A001-C-108 | Human | Colorectum | FAP | 3.65e-16 | -4.16e-01 | -0.0272 |
| 1755 | DMBT1 | A002-C-021 | Human | Colorectum | FAP | 2.54e-05 | -3.26e-01 | 0.1171 |
| 1755 | DMBT1 | A002-C-205 | Human | Colorectum | FAP | 4.12e-12 | -4.22e-01 | -0.1236 |
| 1755 | DMBT1 | A014-C-108 | Human | Colorectum | FAP | 3.34e-08 | -4.22e-01 | -0.124 |
| 1755 | DMBT1 | A001-C-104 | Human | Colorectum | FAP | 1.75e-18 | -4.22e-01 | 0.0184 |
| 1755 | DMBT1 | A015-C-005 | Human | Colorectum | FAP | 3.46e-07 | -4.05e-01 | -0.0336 |
| Page: 1 2 3 4 |
| Tissue | Expression Dynamics | Abbreviation |
| Colorectum (GSE201348) |  | FAP: Familial adenomatous polyposis |
| CRC: Colorectal cancer | ||
| Colorectum (HTA11) |  | AD: Adenomas |
| SER: Sessile serrated lesions | ||
| MSI-H: Microsatellite-high colorectal cancer | ||
| MSS: Microsatellite stable colorectal cancer | ||
| Endometrium | 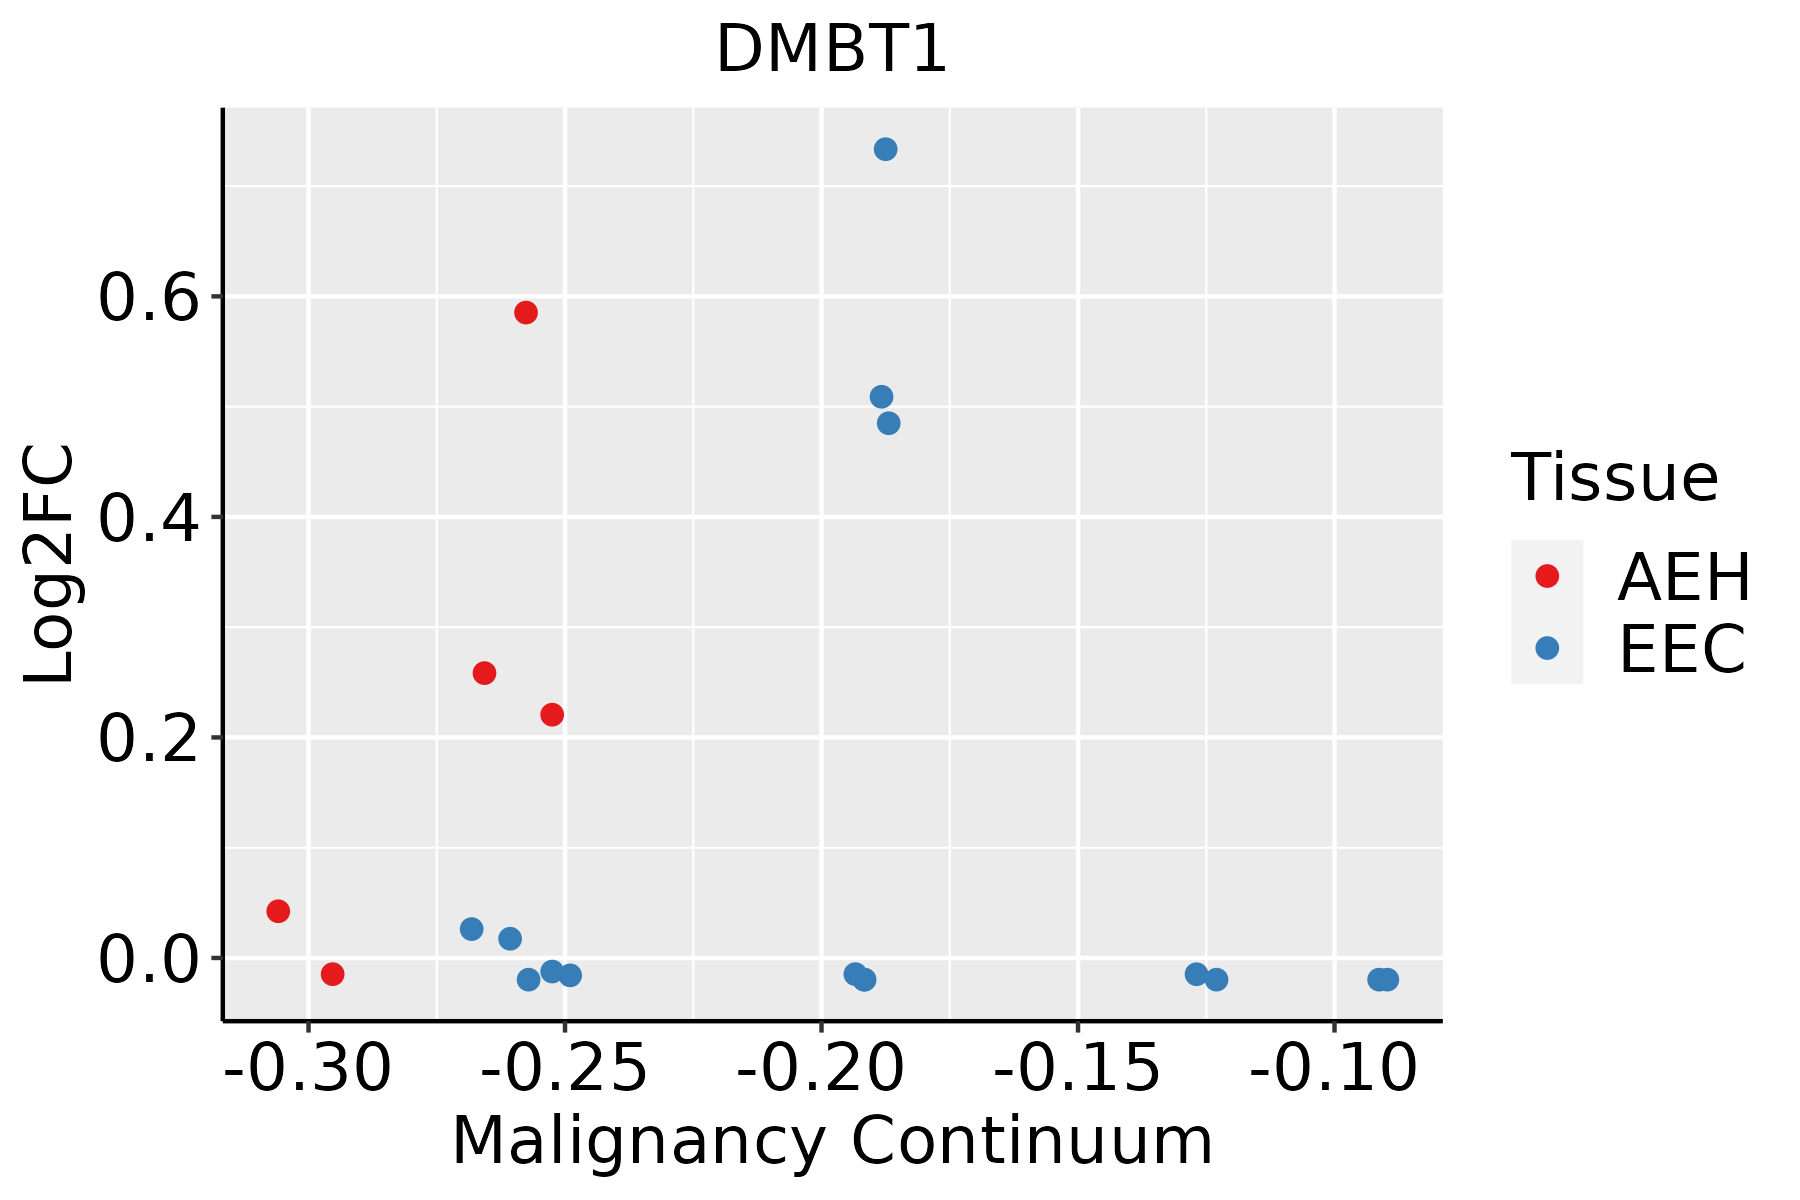 | AEH: Atypical endometrial hyperplasia |
| EEC: Endometrioid Cancer | ||
| GC | 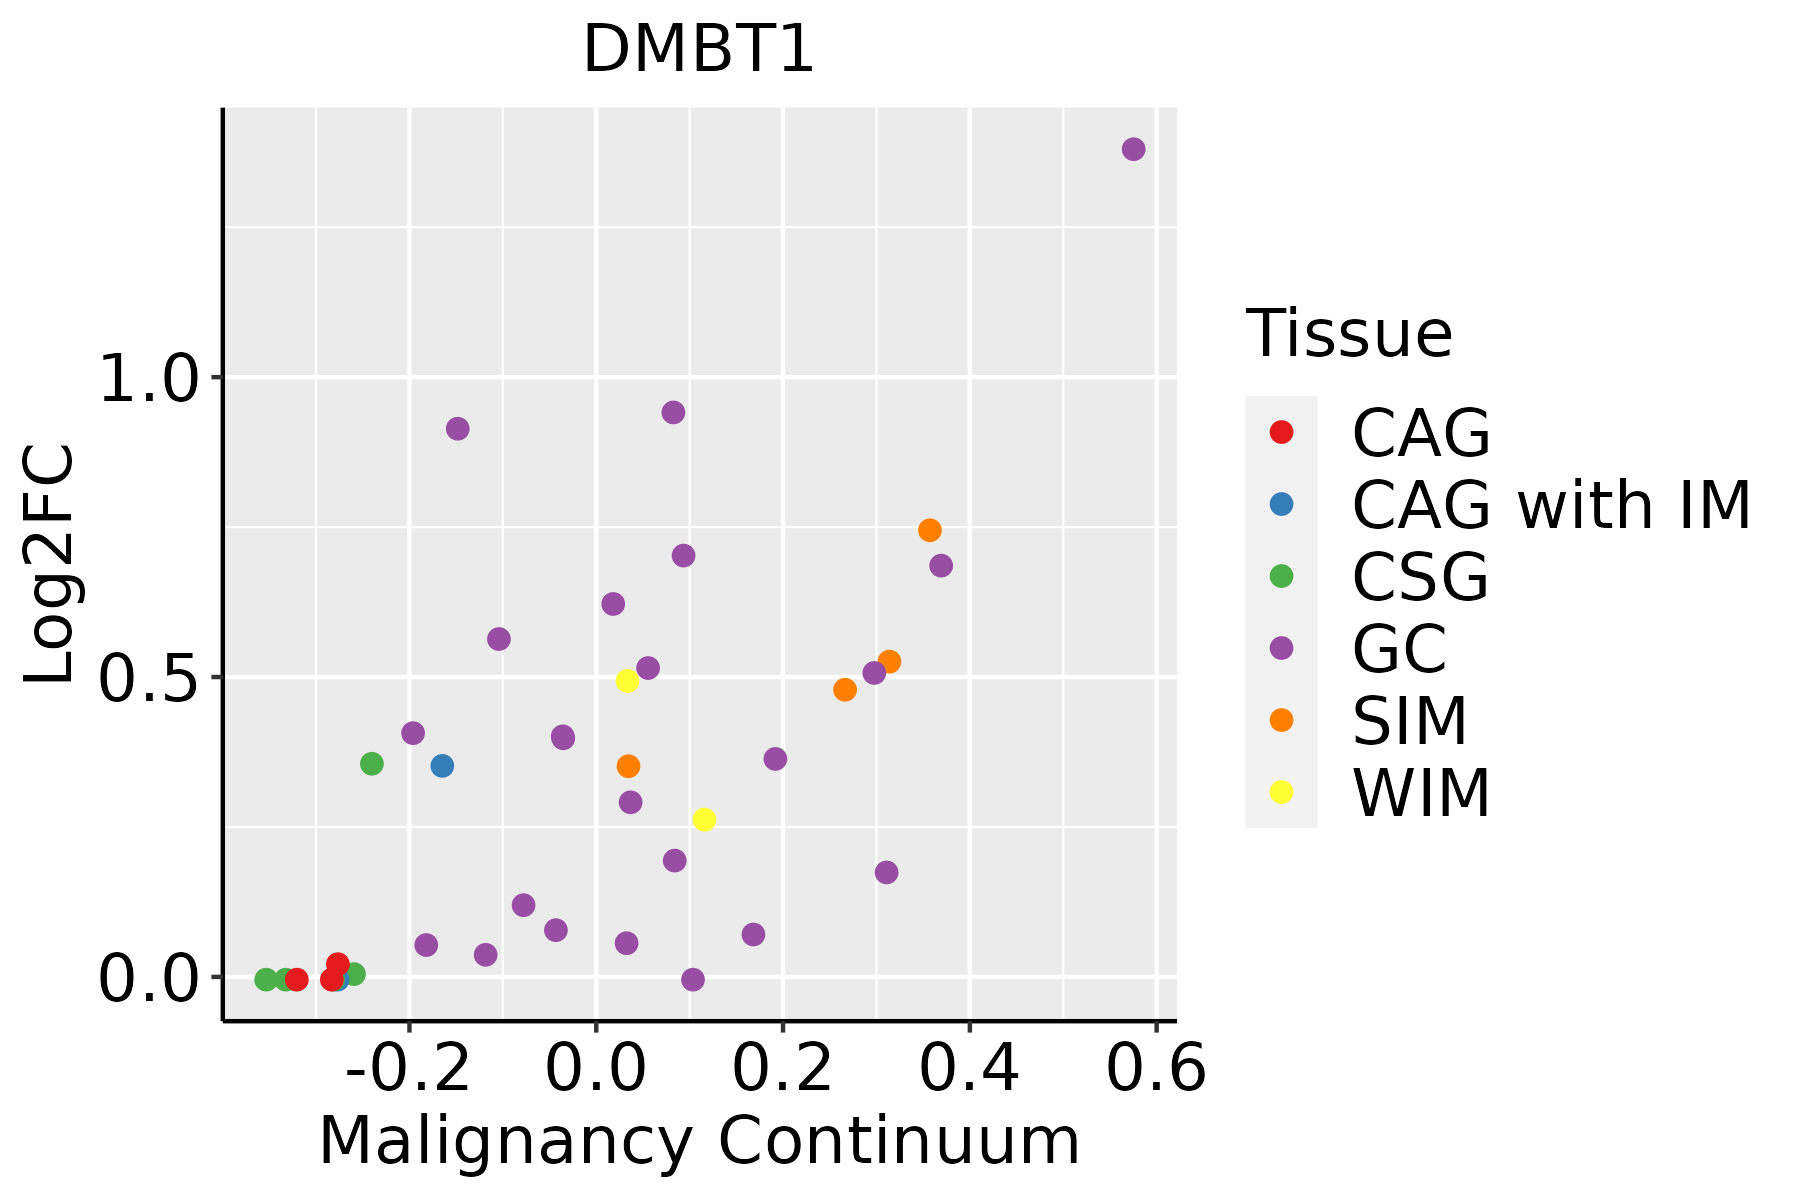 | CAG: Chronic atrophic gastritis |
| CAG with IM: Chronic atrophic gastritis with intestinal metaplasia | ||
| CSG: Chronic superficial gastritis | ||
| GC: Gastric cancer | ||
| SIM: Severe intestinal metaplasia | ||
| WIM: Wild intestinal metaplasia | ||
| Lung | 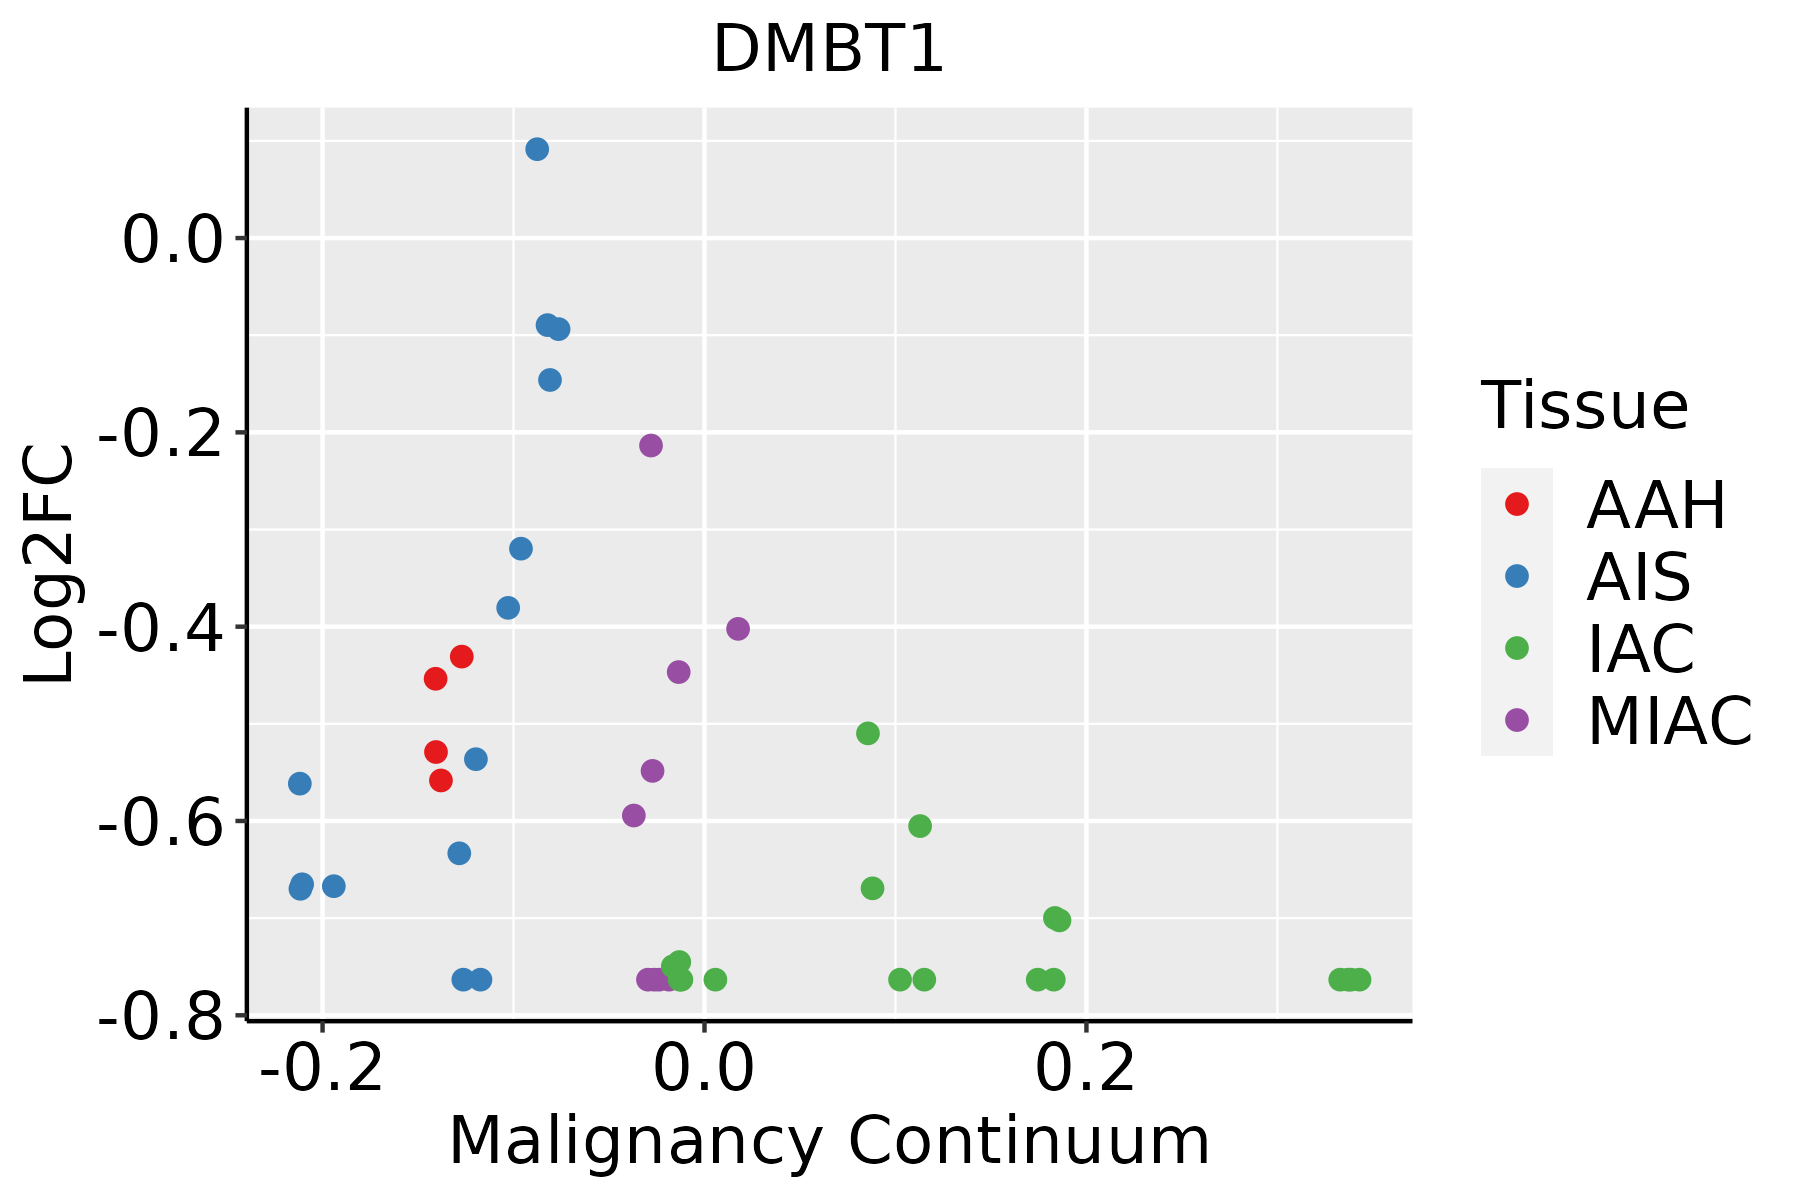 | AAH: Atypical adenomatous hyperplasia |
| AIS: Adenocarcinoma in situ | ||
| IAC: Invasive lung adenocarcinoma | ||
| MIA: Minimally invasive adenocarcinoma |
| ∗log2FC in expression of this searched gene in stem-like cells from each diseased tissue sample relative to stem-like cells in normal samples in each tissue plotted against the malignancy continuum. Samples are colored based on if they are from different disease stage. |
Top |
Malignant transformation related pathway analysis |
| Find out the enriched GO biological processes and KEGG pathways involved in transition from healthy to precancer to cancer |
| Tissue | Disease Stage | Enriched GO biological Processes |
| Colorectum | AD |  |
| Colorectum | SER |  |
| Colorectum | MSS |  |
| Colorectum | MSI-H |  |
| Colorectum | FAP |  |
| ∗Top 15 enriched GO BP terms are showed in the bar plot of each disease state in each tissue. Each row represents a significant GO biological process which is colored according to the -log10(p.adjust). |
| Page: 1 2 3 4 5 6 7 8 9 |
| GO ID | Tissue | Disease Stage | Description | Gene Ratio | Bg Ratio | pvalue | p.adjust | Count |
| GO:000223710 | Endometrium | AEH | response to molecule of bacterial origin | 65/2100 | 363/18723 | 9.00e-05 | 1.30e-03 | 65 |
| GO:00096159 | Endometrium | AEH | response to virus | 63/2100 | 367/18723 | 3.81e-04 | 4.10e-03 | 63 |
| GO:000223714 | Endometrium | EEC | response to molecule of bacterial origin | 68/2168 | 363/18723 | 3.96e-05 | 6.64e-04 | 68 |
| GO:000961513 | Endometrium | EEC | response to virus | 66/2168 | 367/18723 | 1.78e-04 | 2.20e-03 | 66 |
| GO:00096156 | Lung | IAC | response to virus | 61/2061 | 367/18723 | 6.75e-04 | 9.12e-03 | 61 |
| GO:00022377 | Lung | IAC | response to molecule of bacterial origin | 56/2061 | 363/18723 | 5.78e-03 | 4.21e-02 | 56 |
| GO:0019730 | Stomach | GC | antimicrobial humoral response | 25/1159 | 122/18723 | 9.62e-08 | 6.08e-06 | 25 |
| GO:0006959 | Stomach | GC | humoral immune response | 42/1159 | 317/18723 | 2.59e-06 | 1.10e-04 | 42 |
| GO:0002237 | Stomach | GC | response to molecule of bacterial origin | 45/1159 | 363/18723 | 6.89e-06 | 2.57e-04 | 45 |
| GO:0019731 | Stomach | GC | antibacterial humoral response | 13/1159 | 60/18723 | 6.18e-05 | 1.40e-03 | 13 |
| GO:0042742 | Stomach | GC | defense response to bacterium | 37/1159 | 350/18723 | 1.05e-03 | 1.23e-02 | 37 |
| GO:00096154 | Stomach | GC | response to virus | 37/1159 | 367/18723 | 2.41e-03 | 2.30e-02 | 37 |
| GO:00197301 | Stomach | CAG with IM | antimicrobial humoral response | 23/1050 | 122/18723 | 2.62e-07 | 1.61e-05 | 23 |
| GO:00069591 | Stomach | CAG with IM | humoral immune response | 39/1050 | 317/18723 | 3.43e-06 | 1.36e-04 | 39 |
| GO:00022371 | Stomach | CAG with IM | response to molecule of bacterial origin | 39/1050 | 363/18723 | 7.73e-05 | 1.82e-03 | 39 |
| GO:00197311 | Stomach | CAG with IM | antibacterial humoral response | 12/1050 | 60/18723 | 1.04e-04 | 2.28e-03 | 12 |
| GO:00096151 | Stomach | CAG with IM | response to virus | 36/1050 | 367/18723 | 8.12e-04 | 1.08e-02 | 36 |
| GO:00427421 | Stomach | CAG with IM | defense response to bacterium | 34/1050 | 350/18723 | 1.32e-03 | 1.56e-02 | 34 |
| GO:00197302 | Stomach | CSG | antimicrobial humoral response | 23/1034 | 122/18723 | 1.99e-07 | 1.30e-05 | 23 |
| GO:00069592 | Stomach | CSG | humoral immune response | 40/1034 | 317/18723 | 9.26e-07 | 4.76e-05 | 40 |
| Page: 1 2 |
| Pathway ID | Tissue | Disease Stage | Description | Gene Ratio | Bg Ratio | pvalue | p.adjust | qvalue | Count |
| hsa04970 | Colorectum | FAP | Salivary secretion | 24/1404 | 93/8465 | 1.52e-02 | 4.99e-02 | 3.03e-02 | 24 |
| hsa049701 | Colorectum | FAP | Salivary secretion | 24/1404 | 93/8465 | 1.52e-02 | 4.99e-02 | 3.03e-02 | 24 |
| hsa049702 | Colorectum | CRC | Salivary secretion | 22/1091 | 93/8465 | 3.03e-03 | 1.91e-02 | 1.29e-02 | 22 |
| hsa049703 | Colorectum | CRC | Salivary secretion | 22/1091 | 93/8465 | 3.03e-03 | 1.91e-02 | 1.29e-02 | 22 |
| Page: 1 |
Top |
Cell-cell communication analysis |
| Identification of potential cell-cell interactions between two cell types and their ligand-receptor pairs for different disease states |
| Ligand | Receptor | LRpair | Pathway | Tissue | Disease Stage |
| Page: 1 |
Top |
Single-cell gene regulatory network inference analysis |
| Find out the significant the regulons (TFs) and the target genes of each regulon across cell types for different disease states |
| TF | Cell Type | Tissue | Disease Stage | Target Gene | RSS | Regulon Activity |
| ∗The dot plots of a searched regulon are shown for all cell subpopulations in each disease state of each tissue based on the regulon specific score inferred using pySCENIC and by calculating the average expression. |
| Page: 1 |
Top |
Somatic mutation of malignant transformation related genes |
| Annotation of somatic variants for genes involved in malignant transformation |
| Hugo Symbol | Variant Class | Variant Classification | dbSNP RS | HGVSc | HGVSp | HGVSp Short | SWISSPROT | BIOTYPE | SIFT | PolyPhen | Tumor Sample Barcode | Tissue | Histology | Sex | Age | Stage | Therapy Types | Drugs | Outcome |
| DMBT1 | SNV | Missense_Mutation | novel | c.3410T>G | p.Val1137Gly | p.V1137G | Q9UGM3 | protein_coding | deleterious(0) | probably_damaging(0.96) | TCGA-A2-A1G4-01 | Breast | breast invasive carcinoma | Female | >=65 | III/IV | Chemotherapy | adriamycin | SD |
| DMBT1 | SNV | Missense_Mutation | novel | c.6247G>T | p.Gly2083Trp | p.G2083W | Q9UGM3 | protein_coding | deleterious(0) | probably_damaging(0.99) | TCGA-A7-A0DB-01 | Breast | breast invasive carcinoma | Female | <65 | I/II | Hormone Therapy | arimidex | SD |
| DMBT1 | SNV | Missense_Mutation | c.7058T>A | p.Phe2353Tyr | p.F2353Y | Q9UGM3 | protein_coding | tolerated(0.45) | benign(0.1) | TCGA-A8-A06Z-01 | Breast | breast invasive carcinoma | Female | >=65 | I/II | Unknown | Unknown | SD | |
| DMBT1 | SNV | Missense_Mutation | rs761641632 | c.2168C>T | p.Ser723Leu | p.S723L | Q9UGM3 | protein_coding | tolerated(0.17) | benign(0) | TCGA-A8-A09G-01 | Breast | breast invasive carcinoma | Female | >=65 | III/IV | Unknown | Unknown | SD |
| DMBT1 | SNV | Missense_Mutation | c.4662N>T | p.Trp1554Cys | p.W1554C | Q9UGM3 | protein_coding | tolerated(0.17) | probably_damaging(0.997) | TCGA-AN-A0FZ-01 | Breast | breast invasive carcinoma | Female | <65 | III/IV | Unknown | Unknown | SD | |
| DMBT1 | SNV | Missense_Mutation | rs545733226 | c.5080N>T | p.Arg1694Trp | p.R1694W | Q9UGM3 | protein_coding | tolerated(0.2) | probably_damaging(0.985) | TCGA-AN-A0XW-01 | Breast | breast invasive carcinoma | Female | <65 | III/IV | Unknown | Unknown | SD |
| DMBT1 | SNV | Missense_Mutation | novel | c.2207T>G | p.Val736Gly | p.V736G | Q9UGM3 | protein_coding | deleterious(0) | possibly_damaging(0.598) | TCGA-AR-A2LH-01 | Breast | breast invasive carcinoma | Female | <65 | III/IV | Chemotherapy | adriamycin | PD |
| DMBT1 | SNV | Missense_Mutation | c.5549N>G | p.Ser1850Cys | p.S1850C | Q9UGM3 | protein_coding | deleterious(0.02) | probably_damaging(0.993) | TCGA-C8-A27B-01 | Breast | breast invasive carcinoma | Female | <65 | I/II | Chemotherapy | 5-fluorouracil | CR | |
| DMBT1 | SNV | Missense_Mutation | novel | c.4774G>A | p.Gly1592Ser | p.G1592S | Q9UGM3 | protein_coding | tolerated(0.09) | probably_damaging(0.999) | TCGA-D8-A1J8-01 | Breast | breast invasive carcinoma | Female | >=65 | I/II | Hormone Therapy | nolvadex | SD |
| DMBT1 | SNV | Missense_Mutation | c.2392N>T | p.Asp798Tyr | p.D798Y | Q9UGM3 | protein_coding | deleterious(0) | probably_damaging(1) | TCGA-D8-A1Y0-01 | Breast | breast invasive carcinoma | Female | >=65 | III/IV | Chemotherapy | cyclophosphamide+methotrexatum+fluorouracillum | SD |
| Page: 1 2 3 4 5 6 7 8 9 10 11 12 13 14 15 16 17 18 19 20 21 22 23 24 25 26 27 28 |
Top |
Related drugs of malignant transformation related genes |
| Identification of chemicals and drugs interact with genes involved in malignant transfromation |
| (DGIdb 4.0) |
| Entrez ID | Symbol | Category | Interaction Types | Drug Claim Name | Drug Name | PMIDs |
| Page: 1 |

Copyright 2023-Present -The University of Texas Health Science Center at Houston |