
|
|||||
|
 | |
| |
| |
| |
| |
| |
|
Gene: DMAP1 |
Gene summary for DMAP1 |
| Gene information | Species | Human | Gene symbol | DMAP1 | Gene ID | 55929 |
| Gene name | DNA methyltransferase 1 associated protein 1 | |
| Gene Alias | DNMAP1 | |
| Cytomap | 1p34.1 | |
| Gene Type | protein-coding | GO ID | GO:0000122 | UniProtAcc | Q9NPF5 |
Top |
Malignant transformation analysis |
| Identification of the aberrant gene expression in precancerous and cancerous lesions by comparing the gene expression of stem-like cells in diseased tissues with normal stem cells |
| Entrez ID | Symbol | Replicates | Species | Organ | Tissue | Adj P-value | Log2FC | Malignancy |
| 55929 | DMAP1 | LZE4T | Human | Esophagus | ESCC | 8.31e-10 | 1.57e-01 | 0.0811 |
| 55929 | DMAP1 | LZE7T | Human | Esophagus | ESCC | 4.38e-11 | 5.03e-01 | 0.0667 |
| 55929 | DMAP1 | LZE8T | Human | Esophagus | ESCC | 6.34e-04 | 9.18e-02 | 0.067 |
| 55929 | DMAP1 | LZE20T | Human | Esophagus | ESCC | 1.99e-03 | 1.86e-01 | 0.0662 |
| 55929 | DMAP1 | LZE21D1 | Human | Esophagus | HGIN | 2.40e-03 | 1.88e-01 | 0.0632 |
| 55929 | DMAP1 | LZE22T | Human | Esophagus | ESCC | 4.53e-06 | 3.90e-01 | 0.068 |
| 55929 | DMAP1 | LZE24T | Human | Esophagus | ESCC | 2.82e-17 | 3.98e-01 | 0.0596 |
| 55929 | DMAP1 | LZE6T | Human | Esophagus | ESCC | 1.08e-04 | 1.13e-01 | 0.0845 |
| 55929 | DMAP1 | P1T-E | Human | Esophagus | ESCC | 1.41e-07 | 3.07e-01 | 0.0875 |
| 55929 | DMAP1 | P2T-E | Human | Esophagus | ESCC | 3.65e-32 | 5.23e-01 | 0.1177 |
| 55929 | DMAP1 | P4T-E | Human | Esophagus | ESCC | 2.38e-14 | 2.53e-01 | 0.1323 |
| 55929 | DMAP1 | P5T-E | Human | Esophagus | ESCC | 8.37e-08 | 2.04e-01 | 0.1327 |
| 55929 | DMAP1 | P8T-E | Human | Esophagus | ESCC | 8.67e-28 | 3.57e-01 | 0.0889 |
| 55929 | DMAP1 | P9T-E | Human | Esophagus | ESCC | 7.25e-16 | 1.78e-01 | 0.1131 |
| 55929 | DMAP1 | P10T-E | Human | Esophagus | ESCC | 4.31e-35 | 4.57e-01 | 0.116 |
| 55929 | DMAP1 | P11T-E | Human | Esophagus | ESCC | 1.04e-07 | 3.78e-01 | 0.1426 |
| 55929 | DMAP1 | P12T-E | Human | Esophagus | ESCC | 7.29e-21 | 3.05e-01 | 0.1122 |
| 55929 | DMAP1 | P15T-E | Human | Esophagus | ESCC | 7.62e-14 | 2.81e-01 | 0.1149 |
| 55929 | DMAP1 | P16T-E | Human | Esophagus | ESCC | 2.10e-18 | 2.51e-01 | 0.1153 |
| 55929 | DMAP1 | P17T-E | Human | Esophagus | ESCC | 7.47e-09 | 3.81e-01 | 0.1278 |
| Page: 1 2 3 4 5 6 |
| Tissue | Expression Dynamics | Abbreviation |
| Esophagus |  | ESCC: Esophageal squamous cell carcinoma |
| HGIN: High-grade intraepithelial neoplasias | ||
| LGIN: Low-grade intraepithelial neoplasias | ||
| Liver | 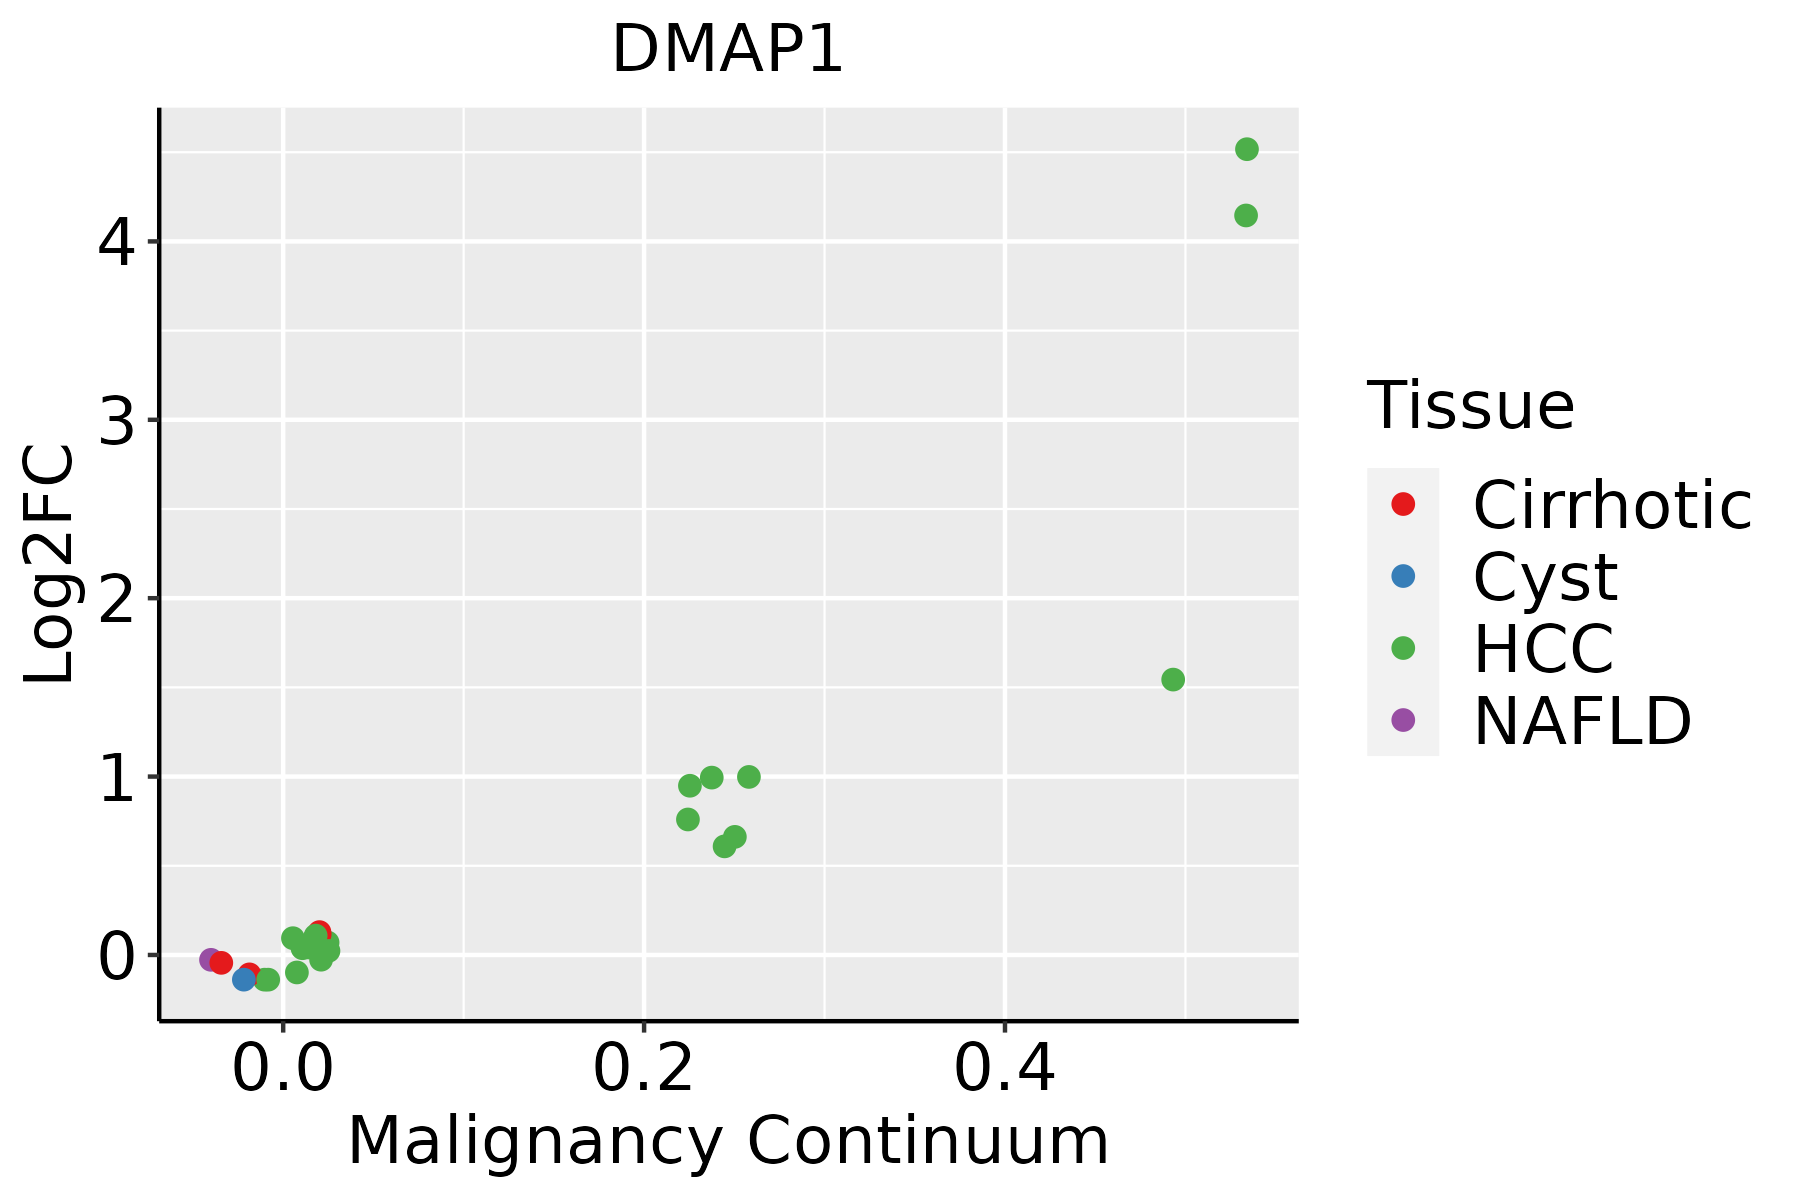 | HCC: Hepatocellular carcinoma |
| NAFLD: Non-alcoholic fatty liver disease | ||
| Oral Cavity |  | EOLP: Erosive Oral lichen planus |
| LP: leukoplakia | ||
| NEOLP: Non-erosive oral lichen planus | ||
| OSCC: Oral squamous cell carcinoma | ||
| Skin | 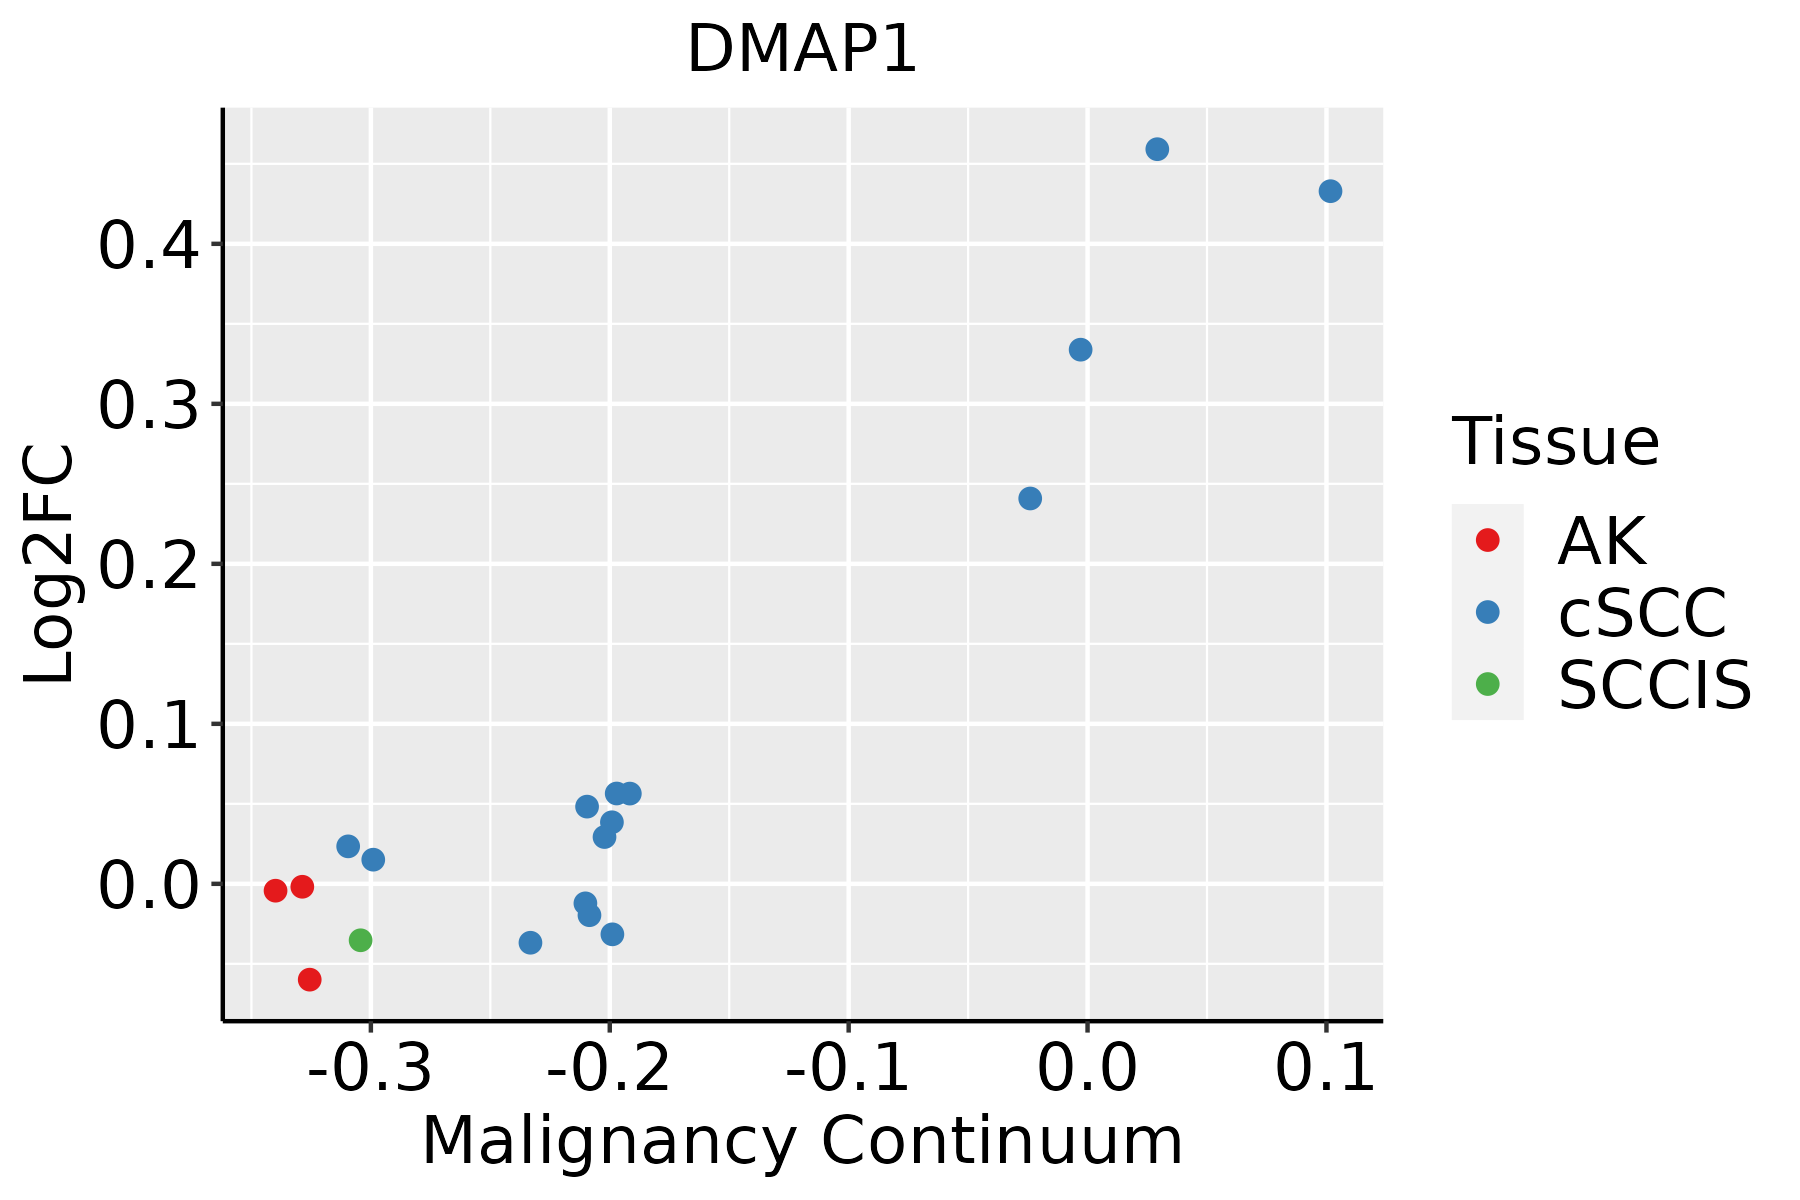 | AK: Actinic keratosis |
| cSCC: Cutaneous squamous cell carcinoma | ||
| SCCIS:squamous cell carcinoma in situ | ||
| Thyroid |  | ATC: Anaplastic thyroid cancer |
| HT: Hashimoto's thyroiditis | ||
| PTC: Papillary thyroid cancer |
| ∗log2FC in expression of this searched gene in stem-like cells from each diseased tissue sample relative to stem-like cells in normal samples in each tissue plotted against the malignancy continuum. Samples are colored based on if they are from different disease stage. |
Top |
Malignant transformation related pathway analysis |
| Find out the enriched GO biological processes and KEGG pathways involved in transition from healthy to precancer to cancer |
| Tissue | Disease Stage | Enriched GO biological Processes |
| Colorectum | AD |  |
| Colorectum | SER |  |
| Colorectum | MSS |  |
| Colorectum | MSI-H |  |
| Colorectum | FAP |  |
| ∗Top 15 enriched GO BP terms are showed in the bar plot of each disease state in each tissue. Each row represents a significant GO biological process which is colored according to the -log10(p.adjust). |
| Page: 1 2 3 4 5 6 7 8 9 |
| GO ID | Tissue | Disease Stage | Description | Gene Ratio | Bg Ratio | pvalue | p.adjust | Count |
| GO:007259420 | Esophagus | HGIN | establishment of protein localization to organelle | 120/2587 | 422/18723 | 1.73e-15 | 4.00e-13 | 120 |
| GO:003450417 | Esophagus | HGIN | protein localization to nucleus | 84/2587 | 290/18723 | 1.06e-11 | 1.24e-09 | 84 |
| GO:000691319 | Esophagus | HGIN | nucleocytoplasmic transport | 83/2587 | 301/18723 | 2.14e-10 | 1.97e-08 | 83 |
| GO:005116919 | Esophagus | HGIN | nuclear transport | 83/2587 | 301/18723 | 2.14e-10 | 1.97e-08 | 83 |
| GO:190382926 | Esophagus | HGIN | positive regulation of cellular protein localization | 75/2587 | 276/18723 | 3.19e-09 | 2.30e-07 | 75 |
| GO:00182057 | Esophagus | HGIN | peptidyl-lysine modification | 88/2587 | 376/18723 | 2.99e-07 | 1.39e-05 | 88 |
| GO:004682219 | Esophagus | HGIN | regulation of nucleocytoplasmic transport | 35/2587 | 106/18723 | 3.69e-07 | 1.69e-05 | 35 |
| GO:190018216 | Esophagus | HGIN | positive regulation of protein localization to nucleus | 30/2587 | 87/18723 | 8.74e-07 | 3.59e-05 | 30 |
| GO:000632516 | Esophagus | HGIN | chromatin organization | 92/2587 | 409/18723 | 1.05e-06 | 4.16e-05 | 92 |
| GO:003238617 | Esophagus | HGIN | regulation of intracellular transport | 79/2587 | 337/18723 | 1.11e-06 | 4.36e-05 | 79 |
| GO:190018017 | Esophagus | HGIN | regulation of protein localization to nucleus | 40/2587 | 136/18723 | 1.69e-06 | 6.31e-05 | 40 |
| GO:003315720 | Esophagus | HGIN | regulation of intracellular protein transport | 58/2587 | 229/18723 | 2.29e-06 | 8.29e-05 | 58 |
| GO:004682416 | Esophagus | HGIN | positive regulation of nucleocytoplasmic transport | 23/2587 | 62/18723 | 3.94e-06 | 1.32e-04 | 23 |
| GO:190495120 | Esophagus | HGIN | positive regulation of establishment of protein localization | 73/2587 | 319/18723 | 6.99e-06 | 2.14e-04 | 73 |
| GO:003238820 | Esophagus | HGIN | positive regulation of intracellular transport | 51/2587 | 202/18723 | 1.00e-05 | 2.92e-04 | 51 |
| GO:001703817 | Esophagus | HGIN | protein import | 51/2587 | 206/18723 | 1.79e-05 | 4.86e-04 | 51 |
| GO:009031616 | Esophagus | HGIN | positive regulation of intracellular protein transport | 42/2587 | 160/18723 | 2.18e-05 | 5.78e-04 | 42 |
| GO:005117010 | Esophagus | HGIN | import into nucleus | 41/2587 | 159/18723 | 4.24e-05 | 1.04e-03 | 41 |
| GO:005122220 | Esophagus | HGIN | positive regulation of protein transport | 67/2587 | 303/18723 | 5.13e-05 | 1.22e-03 | 67 |
| GO:19045919 | Esophagus | HGIN | positive regulation of protein import | 16/2587 | 43/18723 | 1.10e-04 | 2.33e-03 | 16 |
| Page: 1 2 3 4 5 6 7 8 9 10 11 12 13 14 15 16 17 |
| Pathway ID | Tissue | Disease Stage | Description | Gene Ratio | Bg Ratio | pvalue | p.adjust | qvalue | Count |
| Page: 1 |
Top |
Cell-cell communication analysis |
| Identification of potential cell-cell interactions between two cell types and their ligand-receptor pairs for different disease states |
| Ligand | Receptor | LRpair | Pathway | Tissue | Disease Stage |
| Page: 1 |
Top |
Single-cell gene regulatory network inference analysis |
| Find out the significant the regulons (TFs) and the target genes of each regulon across cell types for different disease states |
| TF | Cell Type | Tissue | Disease Stage | Target Gene | RSS | Regulon Activity |
| ∗The dot plots of a searched regulon are shown for all cell subpopulations in each disease state of each tissue based on the regulon specific score inferred using pySCENIC and by calculating the average expression. |
| Page: 1 |
Top |
Somatic mutation of malignant transformation related genes |
| Annotation of somatic variants for genes involved in malignant transformation |
| Hugo Symbol | Variant Class | Variant Classification | dbSNP RS | HGVSc | HGVSp | HGVSp Short | SWISSPROT | BIOTYPE | SIFT | PolyPhen | Tumor Sample Barcode | Tissue | Histology | Sex | Age | Stage | Therapy Types | Drugs | Outcome |
| DMAP1 | SNV | Missense_Mutation | novel | c.853G>A | p.Glu285Lys | p.E285K | Q9NPF5 | protein_coding | tolerated(0.31) | benign(0.333) | TCGA-D8-A1J8-01 | Breast | breast invasive carcinoma | Female | >=65 | I/II | Hormone Therapy | nolvadex | SD |
| DMAP1 | deletion | Frame_Shift_Del | novel | c.1016delA | p.Lys339ArgfsTer14 | p.K339Rfs*14 | Q9NPF5 | protein_coding | TCGA-D8-A27V-01 | Breast | breast invasive carcinoma | Female | <65 | I/II | Hormone Therapy | tamoxiphen | SD | ||
| DMAP1 | SNV | Missense_Mutation | c.807N>C | p.Gln269His | p.Q269H | Q9NPF5 | protein_coding | deleterious(0.02) | probably_damaging(0.995) | TCGA-DS-A0VM-01 | Cervix | cervical & endocervical cancer | Female | <65 | I/II | Chemotherapy | cisplatin | PD | |
| DMAP1 | SNV | Missense_Mutation | novel | c.448N>C | p.Asp150His | p.D150H | Q9NPF5 | protein_coding | deleterious(0.01) | possibly_damaging(0.737) | TCGA-HM-A4S6-01 | Cervix | cervical & endocervical cancer | Female | <65 | III/IV | Chemotherapy | cisplatin | CR |
| DMAP1 | SNV | Missense_Mutation | c.904C>G | p.Pro302Ala | p.P302A | Q9NPF5 | protein_coding | tolerated(0.42) | benign(0.023) | TCGA-A6-5665-01 | Colorectum | colon adenocarcinoma | Female | >=65 | I/II | Unknown | Unknown | PD | |
| DMAP1 | SNV | Missense_Mutation | c.70N>T | p.Thr24Ser | p.T24S | Q9NPF5 | protein_coding | tolerated(0.72) | benign(0.005) | TCGA-A6-6141-01 | Colorectum | colon adenocarcinoma | Male | <65 | I/II | Chemotherapy | 5-fu | SD | |
| DMAP1 | SNV | Missense_Mutation | c.402N>T | p.Gln134His | p.Q134H | Q9NPF5 | protein_coding | tolerated(0.13) | benign(0.013) | TCGA-A6-A565-01 | Colorectum | colon adenocarcinoma | Female | <65 | III/IV | Unspecific | 5FU | PD | |
| DMAP1 | SNV | Missense_Mutation | novel | c.1126G>A | p.Glu376Lys | p.E376K | Q9NPF5 | protein_coding | deleterious(0) | probably_damaging(0.94) | TCGA-AA-3510-01 | Colorectum | colon adenocarcinoma | Male | >=65 | I/II | Unknown | Unknown | SD |
| DMAP1 | SNV | Missense_Mutation | rs767182825 | c.1103G>A | p.Arg368Gln | p.R368Q | Q9NPF5 | protein_coding | deleterious(0) | probably_damaging(1) | TCGA-AA-A00N-01 | Colorectum | colon adenocarcinoma | Male | >=65 | I/II | Unknown | Unknown | PD |
| DMAP1 | SNV | Missense_Mutation | rs767182825 | c.1103G>A | p.Arg368Gln | p.R368Q | Q9NPF5 | protein_coding | deleterious(0) | probably_damaging(1) | TCGA-AZ-4315-01 | Colorectum | colon adenocarcinoma | Male | <65 | I/II | Unknown | Unknown | SD |
| Page: 1 2 3 4 5 |
Top |
Related drugs of malignant transformation related genes |
| Identification of chemicals and drugs interact with genes involved in malignant transfromation |
| (DGIdb 4.0) |
| Entrez ID | Symbol | Category | Interaction Types | Drug Claim Name | Drug Name | PMIDs |
| Page: 1 |

Copyright 2023-Present -The University of Texas Health Science Center at Houston |