
|
|||||
|
 | |
| |
| |
| |
| |
| |
|
Gene: DLX3 |
Gene summary for DLX3 |
| Gene information | Species | Human | Gene symbol | DLX3 | Gene ID | 1747 |
| Gene name | distal-less homeobox 3 | |
| Gene Alias | AI4 | |
| Cytomap | 17q21.33 | |
| Gene Type | protein-coding | GO ID | GO:0000003 | UniProtAcc | O60479 |
Top |
Malignant transformation analysis |
| Identification of the aberrant gene expression in precancerous and cancerous lesions by comparing the gene expression of stem-like cells in diseased tissues with normal stem cells |
| Entrez ID | Symbol | Replicates | Species | Organ | Tissue | Adj P-value | Log2FC | Malignancy |
| 1747 | DLX3 | P2T-E | Human | Esophagus | ESCC | 7.40e-13 | 2.36e-01 | 0.1177 |
| 1747 | DLX3 | P4T-E | Human | Esophagus | ESCC | 4.48e-22 | 5.24e-01 | 0.1323 |
| 1747 | DLX3 | P5T-E | Human | Esophagus | ESCC | 4.30e-03 | 1.08e-01 | 0.1327 |
| 1747 | DLX3 | P10T-E | Human | Esophagus | ESCC | 1.13e-16 | 2.84e-01 | 0.116 |
| 1747 | DLX3 | P11T-E | Human | Esophagus | ESCC | 1.06e-12 | 5.93e-01 | 0.1426 |
| 1747 | DLX3 | P12T-E | Human | Esophagus | ESCC | 7.55e-04 | 1.83e-01 | 0.1122 |
| 1747 | DLX3 | P15T-E | Human | Esophagus | ESCC | 1.31e-02 | 7.81e-02 | 0.1149 |
| 1747 | DLX3 | P16T-E | Human | Esophagus | ESCC | 2.56e-16 | 3.23e-01 | 0.1153 |
| 1747 | DLX3 | P20T-E | Human | Esophagus | ESCC | 5.73e-03 | 9.94e-02 | 0.1124 |
| 1747 | DLX3 | P21T-E | Human | Esophagus | ESCC | 4.12e-11 | 2.06e-01 | 0.1617 |
| 1747 | DLX3 | P22T-E | Human | Esophagus | ESCC | 2.72e-10 | 2.57e-01 | 0.1236 |
| 1747 | DLX3 | P26T-E | Human | Esophagus | ESCC | 1.69e-07 | 1.75e-01 | 0.1276 |
| 1747 | DLX3 | P27T-E | Human | Esophagus | ESCC | 9.35e-10 | 2.32e-01 | 0.1055 |
| 1747 | DLX3 | P28T-E | Human | Esophagus | ESCC | 6.14e-04 | 9.72e-02 | 0.1149 |
| 1747 | DLX3 | P30T-E | Human | Esophagus | ESCC | 1.02e-02 | 1.32e-01 | 0.137 |
| 1747 | DLX3 | P31T-E | Human | Esophagus | ESCC | 6.98e-19 | 2.93e-01 | 0.1251 |
| 1747 | DLX3 | P37T-E | Human | Esophagus | ESCC | 8.12e-03 | 9.31e-02 | 0.1371 |
| 1747 | DLX3 | P42T-E | Human | Esophagus | ESCC | 2.62e-05 | 1.87e-01 | 0.1175 |
| 1747 | DLX3 | P47T-E | Human | Esophagus | ESCC | 3.50e-02 | 7.74e-02 | 0.1067 |
| 1747 | DLX3 | P49T-E | Human | Esophagus | ESCC | 7.48e-03 | 2.67e-01 | 0.1768 |
| Page: 1 2 |
| Tissue | Expression Dynamics | Abbreviation |
| Esophagus | 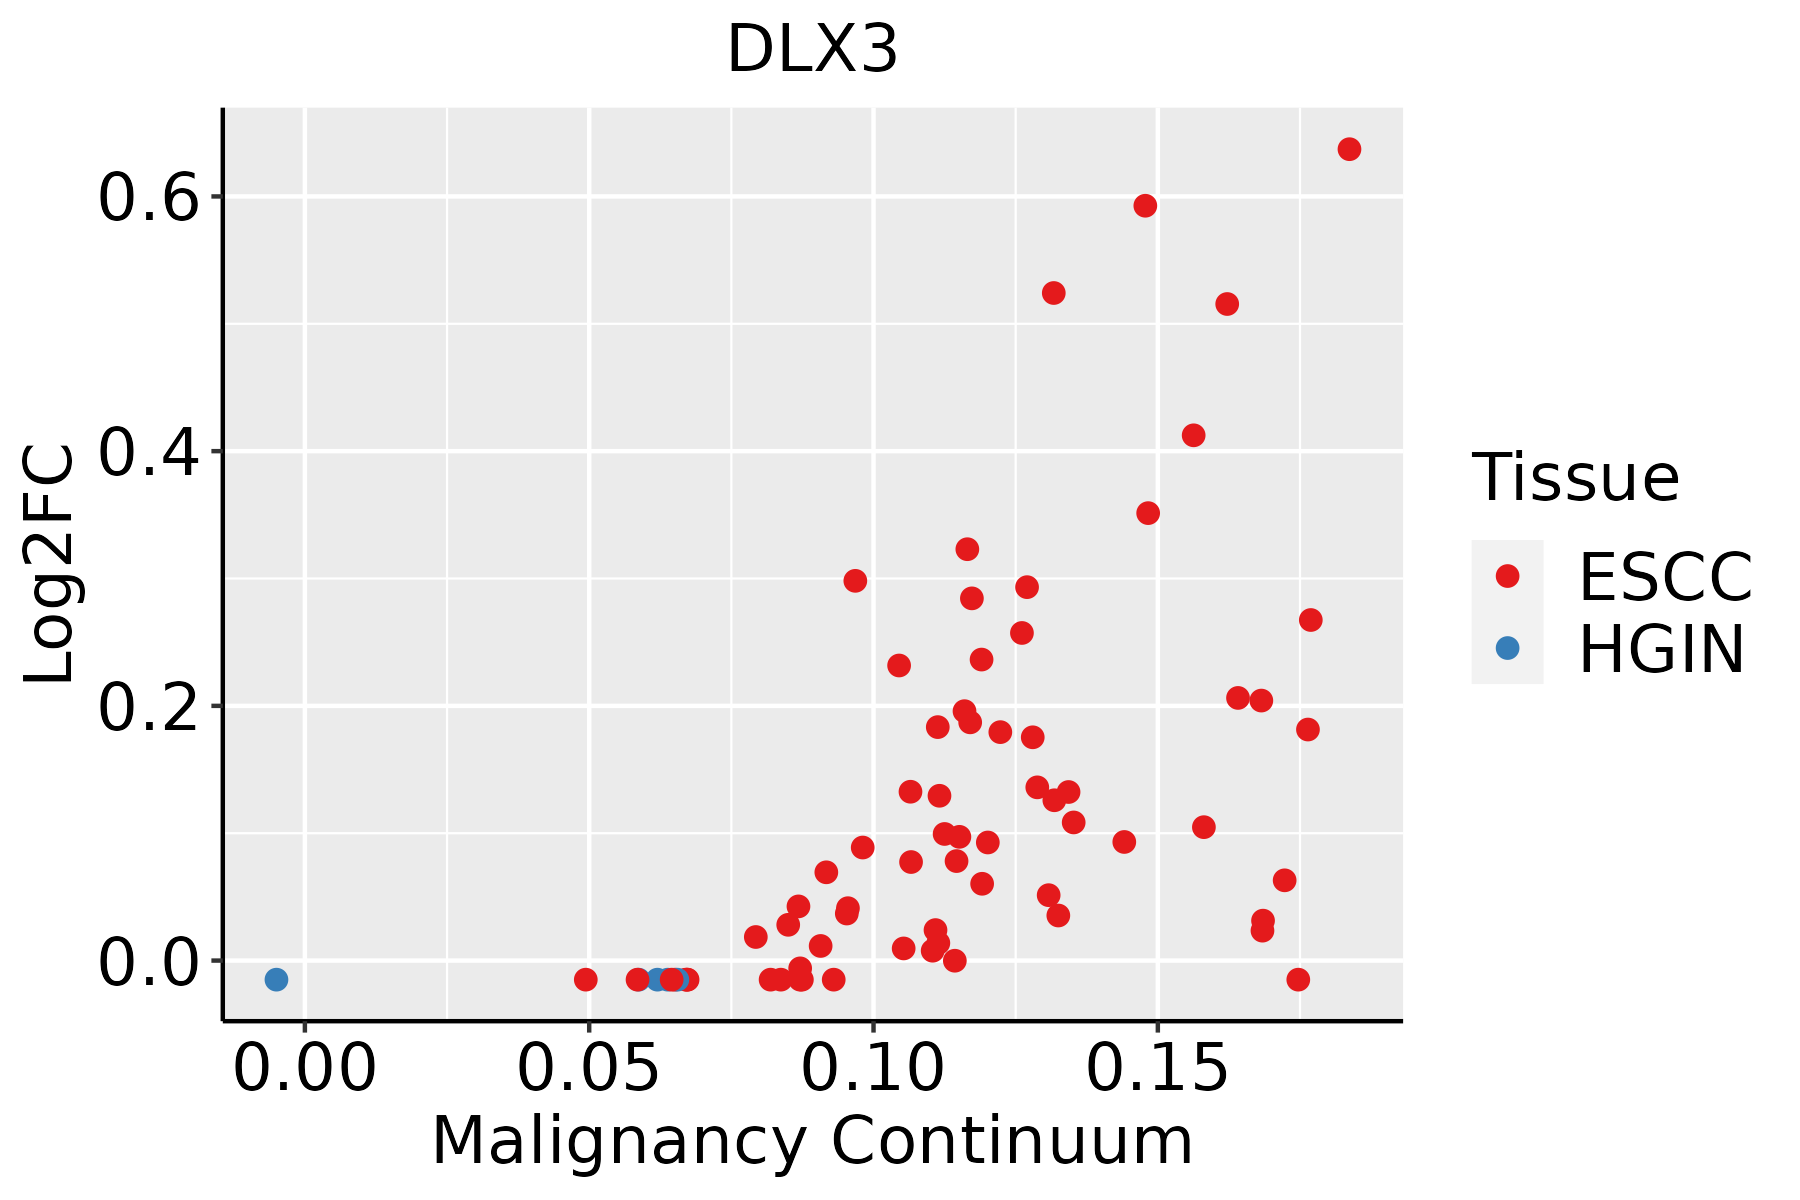 | ESCC: Esophageal squamous cell carcinoma |
| HGIN: High-grade intraepithelial neoplasias | ||
| LGIN: Low-grade intraepithelial neoplasias |
| ∗log2FC in expression of this searched gene in stem-like cells from each diseased tissue sample relative to stem-like cells in normal samples in each tissue plotted against the malignancy continuum. Samples are colored based on if they are from different disease stage. |
Top |
Malignant transformation related pathway analysis |
| Find out the enriched GO biological processes and KEGG pathways involved in transition from healthy to precancer to cancer |
| Tissue | Disease Stage | Enriched GO biological Processes |
| Colorectum | AD |  |
| Colorectum | SER |  |
| Colorectum | MSS |  |
| Colorectum | MSI-H |  |
| Colorectum | FAP |  |
| ∗Top 15 enriched GO BP terms are showed in the bar plot of each disease state in each tissue. Each row represents a significant GO biological process which is colored according to the -log10(p.adjust). |
| Page: 1 2 3 4 5 6 7 8 9 |
| GO ID | Tissue | Disease Stage | Description | Gene Ratio | Bg Ratio | pvalue | p.adjust | Count |
| GO:0001890110 | Esophagus | ESCC | placenta development | 98/8552 | 144/18723 | 4.46e-08 | 8.11e-07 | 98 |
| GO:0061458110 | Esophagus | ESCC | reproductive system development | 247/8552 | 427/18723 | 2.24e-07 | 3.42e-06 | 247 |
| GO:004860818 | Esophagus | ESCC | reproductive structure development | 245/8552 | 424/18723 | 2.82e-07 | 4.14e-06 | 245 |
| Page: 1 |
| Pathway ID | Tissue | Disease Stage | Description | Gene Ratio | Bg Ratio | pvalue | p.adjust | qvalue | Count |
| Page: 1 |
Top |
Cell-cell communication analysis |
| Identification of potential cell-cell interactions between two cell types and their ligand-receptor pairs for different disease states |
| Ligand | Receptor | LRpair | Pathway | Tissue | Disease Stage |
| Page: 1 |
Top |
Single-cell gene regulatory network inference analysis |
| Find out the significant the regulons (TFs) and the target genes of each regulon across cell types for different disease states |
| TF | Cell Type | Tissue | Disease Stage | Target Gene | RSS | Regulon Activity |
| DLX3 | COR | Oral cavity | OSCC | TMEM45A,MSX2,ALDH1A1, etc. | 3.47e-01 |  |
| ∗The dot plots of a searched regulon are shown for all cell subpopulations in each disease state of each tissue based on the regulon specific score inferred using pySCENIC and by calculating the average expression. |
| Page: 1 |
Top |
Somatic mutation of malignant transformation related genes |
| Annotation of somatic variants for genes involved in malignant transformation |
| Hugo Symbol | Variant Class | Variant Classification | dbSNP RS | HGVSc | HGVSp | HGVSp Short | SWISSPROT | BIOTYPE | SIFT | PolyPhen | Tumor Sample Barcode | Tissue | Histology | Sex | Age | Stage | Therapy Types | Drugs | Outcome |
| DLX3 | insertion | Nonsense_Mutation | novel | c.80_81insAATCTAGGAAAACTTCTAAGAAAAGTACTGTCT | p.Lys27_Asp28insIleTerGluAsnPheTerGluLysTyrCysLeu | p.K27_D28insI*ENF*EKYCL | O60479 | protein_coding | TCGA-B6-A0IC-01 | Breast | breast invasive carcinoma | Female | >=65 | I/II | Unknown | Unknown | SD | ||
| DLX3 | SNV | Missense_Mutation | c.760G>A | p.Ala254Thr | p.A254T | O60479 | protein_coding | tolerated(0.23) | benign(0) | TCGA-VS-A9U6-01 | Cervix | cervical & endocervical cancer | Female | <65 | I/II | Chemotherapy | cisplatin | PD | |
| DLX3 | SNV | Missense_Mutation | rs766585893 | c.701C>T | p.Pro234Leu | p.P234L | O60479 | protein_coding | deleterious(0.01) | benign(0.182) | TCGA-AA-3821-01 | Colorectum | colon adenocarcinoma | Female | >=65 | I/II | Unknown | Unknown | SD |
| DLX3 | SNV | Missense_Mutation | c.760G>A | p.Ala254Thr | p.A254T | O60479 | protein_coding | tolerated(0.23) | benign(0) | TCGA-AA-3833-01 | Colorectum | colon adenocarcinoma | Female | <65 | I/II | Unknown | Unknown | SD | |
| DLX3 | SNV | Missense_Mutation | rs762788082 | c.539G>A | p.Arg180His | p.R180H | O60479 | protein_coding | deleterious(0) | probably_damaging(0.998) | TCGA-AA-A010-01 | Colorectum | colon adenocarcinoma | Female | <65 | I/II | Chemotherapy | folinic | CR |
| DLX3 | SNV | Missense_Mutation | c.265N>A | p.Gly89Arg | p.G89R | O60479 | protein_coding | deleterious(0.02) | benign(0.147) | TCGA-CA-6717-01 | Colorectum | colon adenocarcinoma | Male | <65 | I/II | Chemotherapy | oxaliplatin | CR | |
| DLX3 | SNV | Missense_Mutation | novel | c.250T>C | p.Ser84Pro | p.S84P | O60479 | protein_coding | deleterious(0.05) | probably_damaging(0.917) | TCGA-F4-6856-01 | Colorectum | colon adenocarcinoma | Male | <65 | I/II | Ancillary | leucovorin | CR |
| DLX3 | deletion | Frame_Shift_Del | c.839delN | p.Pro280ArgfsTer17 | p.P280Rfs*17 | O60479 | protein_coding | TCGA-CM-6171-01 | Colorectum | colon adenocarcinoma | Female | >=65 | I/II | Unknown | Unknown | SD | |||
| DLX3 | SNV | Missense_Mutation | rs376543839 | c.640N>A | p.Ala214Thr | p.A214T | O60479 | protein_coding | tolerated(0.08) | benign(0.023) | TCGA-AP-A059-01 | Endometrium | uterine corpus endometrioid carcinoma | Female | >=65 | I/II | Unknown | Unknown | SD |
| DLX3 | SNV | Missense_Mutation | c.29G>T | p.Ser10Ile | p.S10I | O60479 | protein_coding | deleterious(0.02) | benign(0.154) | TCGA-AP-A0LM-01 | Endometrium | uterine corpus endometrioid carcinoma | Female | <65 | III/IV | Chemotherapy | cisplatin | SD |
| Page: 1 2 3 4 |
Top |
Related drugs of malignant transformation related genes |
| Identification of chemicals and drugs interact with genes involved in malignant transfromation |
| (DGIdb 4.0) |
| Entrez ID | Symbol | Category | Interaction Types | Drug Claim Name | Drug Name | PMIDs |
| Page: 1 |

Copyright 2023-Present -The University of Texas Health Science Center at Houston |