
|
|||||
|
 | |
| |
| |
| |
| |
| |
|
Gene: DLX1 |
Gene summary for DLX1 |
| Gene information | Species | Human | Gene symbol | DLX1 | Gene ID | 1745 |
| Gene name | distal-less homeobox 1 | |
| Gene Alias | DLX1 | |
| Cytomap | 2q31.1 | |
| Gene Type | protein-coding | GO ID | GO:0000122 | UniProtAcc | P56177 |
Top |
Malignant transformation analysis |
| Identification of the aberrant gene expression in precancerous and cancerous lesions by comparing the gene expression of stem-like cells in diseased tissues with normal stem cells |
| Entrez ID | Symbol | Replicates | Species | Organ | Tissue | Adj P-value | Log2FC | Malignancy |
| 1745 | DLX1 | S014 | Human | Liver | HCC | 4.34e-20 | 6.36e-01 | 0.2254 |
| 1745 | DLX1 | S015 | Human | Liver | HCC | 6.83e-29 | 1.23e+00 | 0.2375 |
| 1745 | DLX1 | S016 | Human | Liver | HCC | 2.19e-28 | 7.92e-01 | 0.2243 |
| Page: 1 |
| Tissue | Expression Dynamics | Abbreviation |
| Liver | 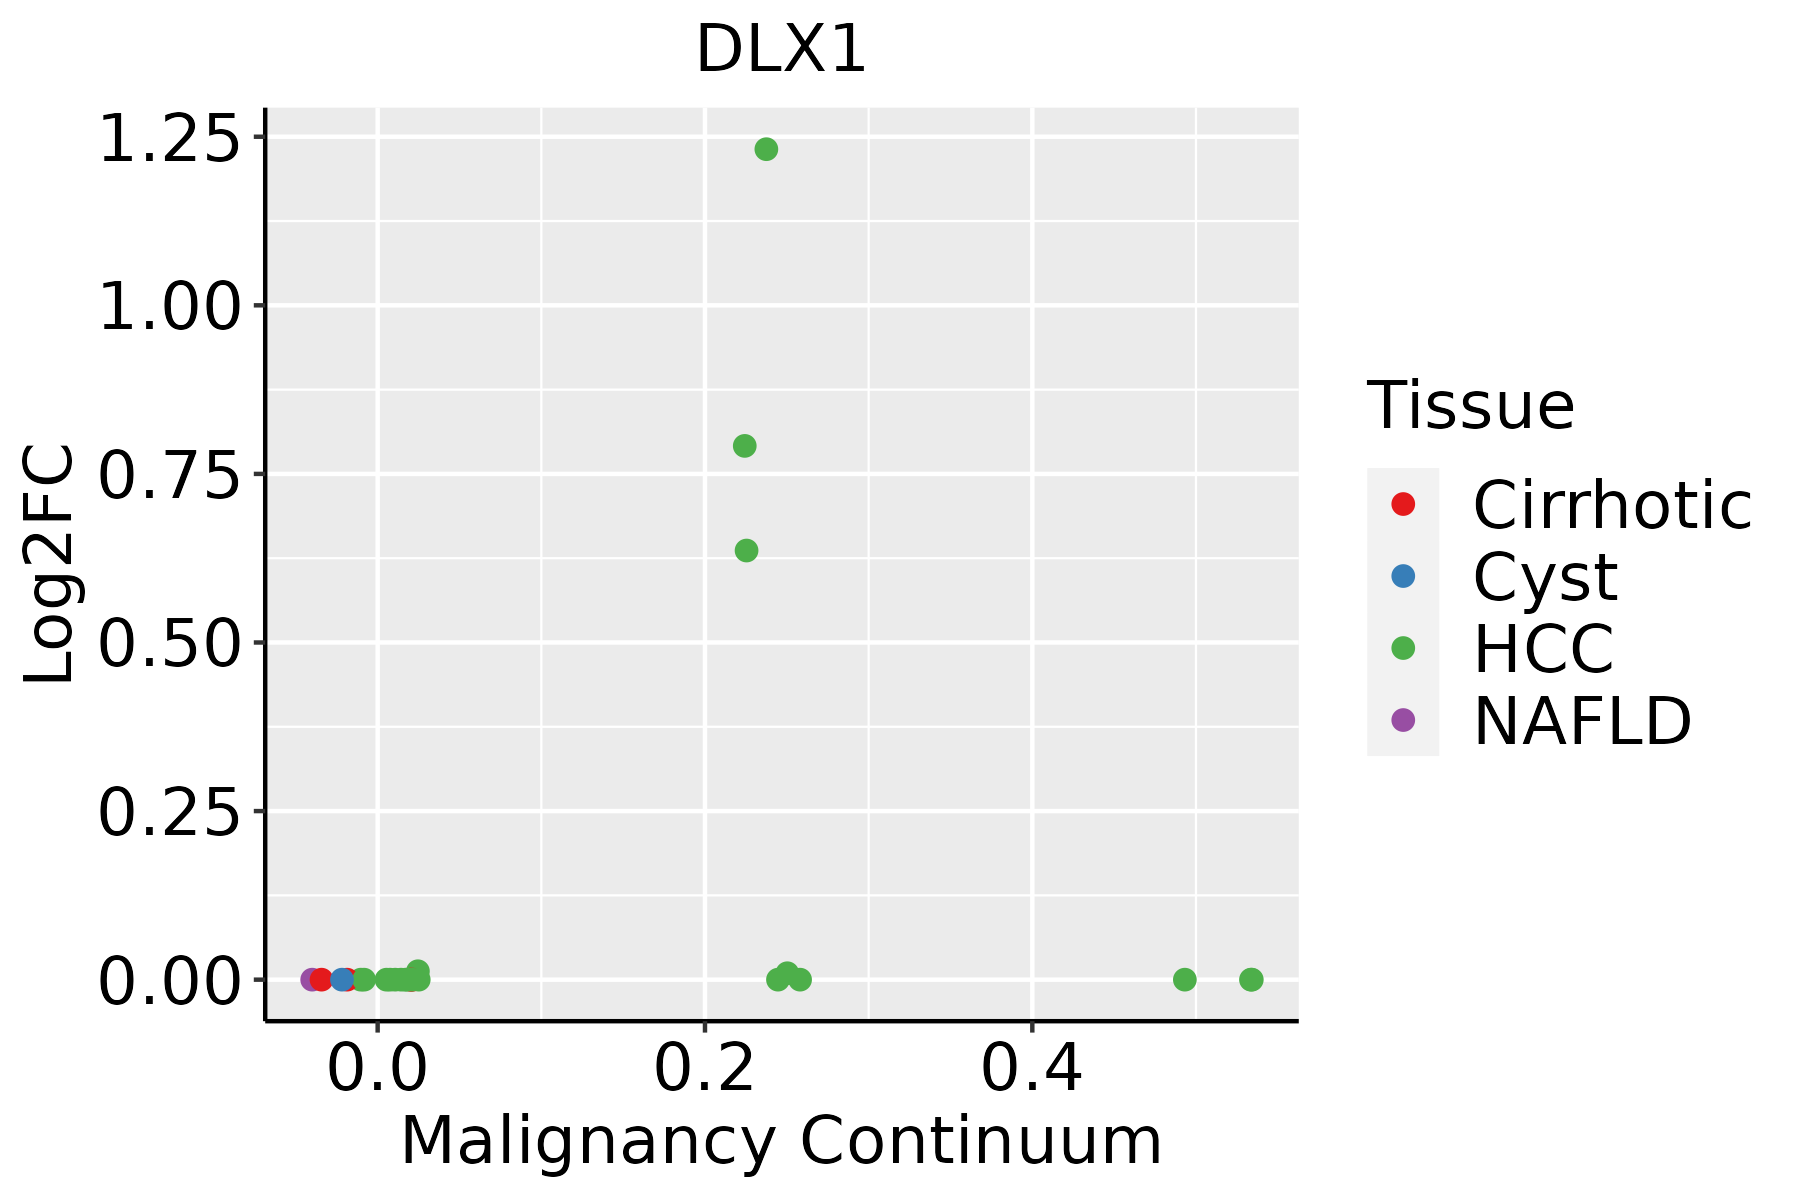 | HCC: Hepatocellular carcinoma |
| NAFLD: Non-alcoholic fatty liver disease |
| ∗log2FC in expression of this searched gene in stem-like cells from each diseased tissue sample relative to stem-like cells in normal samples in each tissue plotted against the malignancy continuum. Samples are colored based on if they are from different disease stage. |
Top |
Malignant transformation related pathway analysis |
| Find out the enriched GO biological processes and KEGG pathways involved in transition from healthy to precancer to cancer |
| Tissue | Disease Stage | Enriched GO biological Processes |
| Colorectum | AD |  |
| Colorectum | SER |  |
| Colorectum | MSS |  |
| Colorectum | MSI-H |  |
| Colorectum | FAP |  |
| ∗Top 15 enriched GO BP terms are showed in the bar plot of each disease state in each tissue. Each row represents a significant GO biological process which is colored according to the -log10(p.adjust). |
| Page: 1 2 3 4 5 6 7 8 9 |
| GO ID | Tissue | Disease Stage | Description | Gene Ratio | Bg Ratio | pvalue | p.adjust | Count |
| GO:007099722 | Liver | HCC | neuron death | 202/7958 | 361/18723 | 1.44e-07 | 2.70e-06 | 202 |
| GO:190121412 | Liver | HCC | regulation of neuron death | 179/7958 | 319/18723 | 5.65e-07 | 9.01e-06 | 179 |
| GO:007155921 | Liver | HCC | response to transforming growth factor beta | 141/7958 | 256/18723 | 3.08e-05 | 3.16e-04 | 141 |
| GO:007156021 | Liver | HCC | cellular response to transforming growth factor beta stimulus | 137/7958 | 250/18723 | 5.47e-05 | 5.14e-04 | 137 |
| GO:005140212 | Liver | HCC | neuron apoptotic process | 135/7958 | 246/18723 | 5.64e-05 | 5.26e-04 | 135 |
| GO:004352312 | Liver | HCC | regulation of neuron apoptotic process | 117/7958 | 212/18723 | 1.25e-04 | 1.03e-03 | 117 |
| GO:190121512 | Liver | HCC | negative regulation of neuron death | 113/7958 | 208/18723 | 3.68e-04 | 2.54e-03 | 113 |
| GO:19038442 | Liver | HCC | regulation of cellular response to transforming growth factor beta stimulus | 72/7958 | 131/18723 | 2.65e-03 | 1.27e-02 | 72 |
| GO:00507674 | Liver | HCC | regulation of neurogenesis | 181/7958 | 364/18723 | 3.00e-03 | 1.40e-02 | 181 |
| GO:00420631 | Liver | HCC | gliogenesis | 148/7958 | 301/18723 | 1.10e-02 | 4.07e-02 | 148 |
| Page: 1 |
| Pathway ID | Tissue | Disease Stage | Description | Gene Ratio | Bg Ratio | pvalue | p.adjust | qvalue | Count |
| Page: 1 |
Top |
Cell-cell communication analysis |
| Identification of potential cell-cell interactions between two cell types and their ligand-receptor pairs for different disease states |
| Ligand | Receptor | LRpair | Pathway | Tissue | Disease Stage |
| Page: 1 |
Top |
Single-cell gene regulatory network inference analysis |
| Find out the significant the regulons (TFs) and the target genes of each regulon across cell types for different disease states |
| TF | Cell Type | Tissue | Disease Stage | Target Gene | RSS | Regulon Activity |
| DLX1 | INMON | Esophagus | ADJ | ETFA,CAMK2A,RTCA-AS1, etc. | 2.74e-02 |  |
| DLX1 | INMON | Esophagus | ESCC | ETFA,CAMK2A,RTCA-AS1, etc. | 7.39e-02 |  |
| DLX1 | SPI | Oral cavity | EOLP | DLX2,CIAO2B,FGF18, etc. | 2.16e-01 |  |
| DLX1 | SPI | Oral cavity | NEOLP | DLX2,CIAO2B,FGF18, etc. | 1.86e-01 |  |
| DLX1 | FIB | Oral cavity | EOLP | ZNF454,OSR1,IMPDH1, etc. | 2.37e-02 | |
| DLX1 | ECM | Oral cavity | EOLP | ZNF454,OSR1,IMPDH1, etc. | 1.75e-02 | |
| DLX1 | ECM | Oral cavity | Healthy | ZNF454,OSR1,IMPDH1, etc. | 5.31e-02 |  |
| DLX1 | CAF | Oral cavity | NEOLP | ZNF454,OSR1,IMPDH1, etc. | 6.10e-02 | |
| DLX1 | ECM | Oral cavity | NEOLP | ZNF454,OSR1,IMPDH1, etc. | 1.58e-02 | |
| DLX1 | ECM | Oral cavity | OSCC | ZNF454,OSR1,IMPDH1, etc. | 1.28e-01 |  |
| ∗The dot plots of a searched regulon are shown for all cell subpopulations in each disease state of each tissue based on the regulon specific score inferred using pySCENIC and by calculating the average expression. |
| Page: 1 2 |
Top |
Somatic mutation of malignant transformation related genes |
| Annotation of somatic variants for genes involved in malignant transformation |
| Hugo Symbol | Variant Class | Variant Classification | dbSNP RS | HGVSc | HGVSp | HGVSp Short | SWISSPROT | BIOTYPE | SIFT | PolyPhen | Tumor Sample Barcode | Tissue | Histology | Sex | Age | Stage | Therapy Types | Drugs | Outcome |
| DLX1 | SNV | Missense_Mutation | c.340G>T | p.Val114Leu | p.V114L | P56177 | protein_coding | deleterious(0.04) | benign(0.031) | TCGA-A1-A0SM-01 | Breast | breast invasive carcinoma | Male | >=65 | I/II | Unknown | Unknown | SD | |
| DLX1 | SNV | Missense_Mutation | c.593N>T | p.Ala198Val | p.A198V | P56177 | protein_coding | tolerated(0.51) | benign(0.056) | TCGA-AA-3492-01 | Colorectum | colon adenocarcinoma | Female | >=65 | I/II | Unknown | Unknown | SD | |
| DLX1 | SNV | Missense_Mutation | c.354N>C | p.Glu118Asp | p.E118D | P56177 | protein_coding | tolerated(0.05) | benign(0.068) | TCGA-CM-4743-01 | Colorectum | colon adenocarcinoma | Male | >=65 | I/II | Chemotherapy | capecitabine | SD | |
| DLX1 | SNV | Missense_Mutation | novel | c.676T>G | p.Ser226Ala | p.S226A | P56177 | protein_coding | tolerated(0.51) | benign(0.003) | TCGA-AG-A02X-01 | Colorectum | rectum adenocarcinoma | Male | >=65 | I/II | Unknown | Unknown | SD |
| DLX1 | insertion | Frame_Shift_Ins | novel | c.662_663insTG | p.Ser222AspfsTer96 | p.S222Dfs*96 | P56177 | protein_coding | TCGA-AA-A02W-01 | Colorectum | colon adenocarcinoma | Female | >=65 | I/II | Unknown | Unknown | PD | ||
| DLX1 | SNV | Missense_Mutation | novel | c.400N>C | p.Ile134Leu | p.I134L | P56177 | protein_coding | deleterious(0) | probably_damaging(0.997) | TCGA-A5-A7WJ-01 | Endometrium | uterine corpus endometrioid carcinoma | Female | <65 | I/II | Unknown | Unknown | SD |
| DLX1 | SNV | Missense_Mutation | novel | c.28N>T | p.Leu10Phe | p.L10F | P56177 | protein_coding | deleterious(0) | possibly_damaging(0.779) | TCGA-AX-A06F-01 | Endometrium | uterine corpus endometrioid carcinoma | Female | <65 | III/IV | Chemotherapy | carboplatin | SD |
| DLX1 | SNV | Missense_Mutation | novel | c.471G>T | p.Glu157Asp | p.E157D | P56177 | protein_coding | deleterious(0) | probably_damaging(0.982) | TCGA-AX-A2HC-01 | Endometrium | uterine corpus endometrioid carcinoma | Female | <65 | III/IV | Chemotherapy | paclitaxel | PD |
| DLX1 | SNV | Missense_Mutation | novel | c.208N>T | p.Pro70Ser | p.P70S | P56177 | protein_coding | deleterious(0.02) | benign(0.085) | TCGA-AX-A2HJ-01 | Endometrium | uterine corpus endometrioid carcinoma | Female | <65 | I/II | Unknown | Unknown | SD |
| DLX1 | SNV | Missense_Mutation | novel | c.250N>T | p.Ile84Phe | p.I84F | P56177 | protein_coding | tolerated(0.07) | benign(0.007) | TCGA-D1-A175-01 | Endometrium | uterine corpus endometrioid carcinoma | Female | <65 | I/II | Chemotherapy | paclitaxel | SD |
| Page: 1 2 3 |
Top |
Related drugs of malignant transformation related genes |
| Identification of chemicals and drugs interact with genes involved in malignant transfromation |
| (DGIdb 4.0) |
| Entrez ID | Symbol | Category | Interaction Types | Drug Claim Name | Drug Name | PMIDs |
| Page: 1 |

Copyright 2023-Present -The University of Texas Health Science Center at Houston |