
|
|||||
|
 | |
| |
| |
| |
| |
| |
|
Gene: DLST |
Gene summary for DLST |
| Gene information | Species | Human | Gene symbol | DLST | Gene ID | 1743 |
| Gene name | dihydrolipoamide S-succinyltransferase | |
| Gene Alias | DLTS | |
| Cytomap | 14q24.3 | |
| Gene Type | protein-coding | GO ID | GO:0006082 | UniProtAcc | B7Z6J1 |
Top |
Malignant transformation analysis |
| Identification of the aberrant gene expression in precancerous and cancerous lesions by comparing the gene expression of stem-like cells in diseased tissues with normal stem cells |
| Entrez ID | Symbol | Replicates | Species | Organ | Tissue | Adj P-value | Log2FC | Malignancy |
| 1743 | DLST | HTA11_347_2000001011 | Human | Colorectum | AD | 1.87e-07 | 4.03e-01 | -0.1954 |
| 1743 | DLST | HTA11_696_2000001011 | Human | Colorectum | AD | 2.13e-02 | 3.48e-01 | -0.1464 |
| 1743 | DLST | HTA11_1391_2000001011 | Human | Colorectum | AD | 3.04e-07 | 5.47e-01 | -0.059 |
| 1743 | DLST | HTA11_866_3004761011 | Human | Colorectum | AD | 6.12e-03 | 2.48e-01 | 0.096 |
| 1743 | DLST | HTA11_7696_3000711011 | Human | Colorectum | AD | 1.13e-04 | 3.29e-01 | 0.0674 |
| 1743 | DLST | HTA11_99999970781_79442 | Human | Colorectum | MSS | 1.55e-02 | 3.58e-01 | 0.294 |
| 1743 | DLST | A015-C-203 | Human | Colorectum | FAP | 5.11e-05 | -1.69e-01 | -0.1294 |
| 1743 | DLST | A002-C-201 | Human | Colorectum | FAP | 6.87e-04 | -1.84e-01 | 0.0324 |
| 1743 | DLST | A001-C-119 | Human | Colorectum | FAP | 2.38e-03 | -2.53e-01 | -0.1557 |
| 1743 | DLST | A001-C-108 | Human | Colorectum | FAP | 1.87e-04 | -1.66e-01 | -0.0272 |
| 1743 | DLST | A002-C-205 | Human | Colorectum | FAP | 8.33e-07 | -2.19e-01 | -0.1236 |
| 1743 | DLST | A015-C-006 | Human | Colorectum | FAP | 2.34e-03 | -1.97e-01 | -0.0994 |
| 1743 | DLST | A015-C-106 | Human | Colorectum | FAP | 1.13e-02 | -1.13e-01 | -0.0511 |
| 1743 | DLST | A002-C-114 | Human | Colorectum | FAP | 8.21e-05 | -2.11e-01 | -0.1561 |
| 1743 | DLST | A015-C-104 | Human | Colorectum | FAP | 2.18e-04 | -1.73e-01 | -0.1899 |
| 1743 | DLST | A001-C-014 | Human | Colorectum | FAP | 5.11e-03 | -1.73e-01 | 0.0135 |
| 1743 | DLST | A002-C-016 | Human | Colorectum | FAP | 4.19e-02 | -1.56e-01 | 0.0521 |
| 1743 | DLST | A001-C-203 | Human | Colorectum | FAP | 5.59e-05 | -1.22e-01 | -0.0481 |
| 1743 | DLST | A002-C-116 | Human | Colorectum | FAP | 1.47e-06 | -2.17e-01 | -0.0452 |
| 1743 | DLST | A014-C-008 | Human | Colorectum | FAP | 1.63e-02 | -1.68e-01 | -0.191 |
| Page: 1 2 3 4 5 6 |
| Tissue | Expression Dynamics | Abbreviation |
| Colorectum (GSE201348) |  | FAP: Familial adenomatous polyposis |
| CRC: Colorectal cancer | ||
| Colorectum (HTA11) |  | AD: Adenomas |
| SER: Sessile serrated lesions | ||
| MSI-H: Microsatellite-high colorectal cancer | ||
| MSS: Microsatellite stable colorectal cancer | ||
| Esophagus | 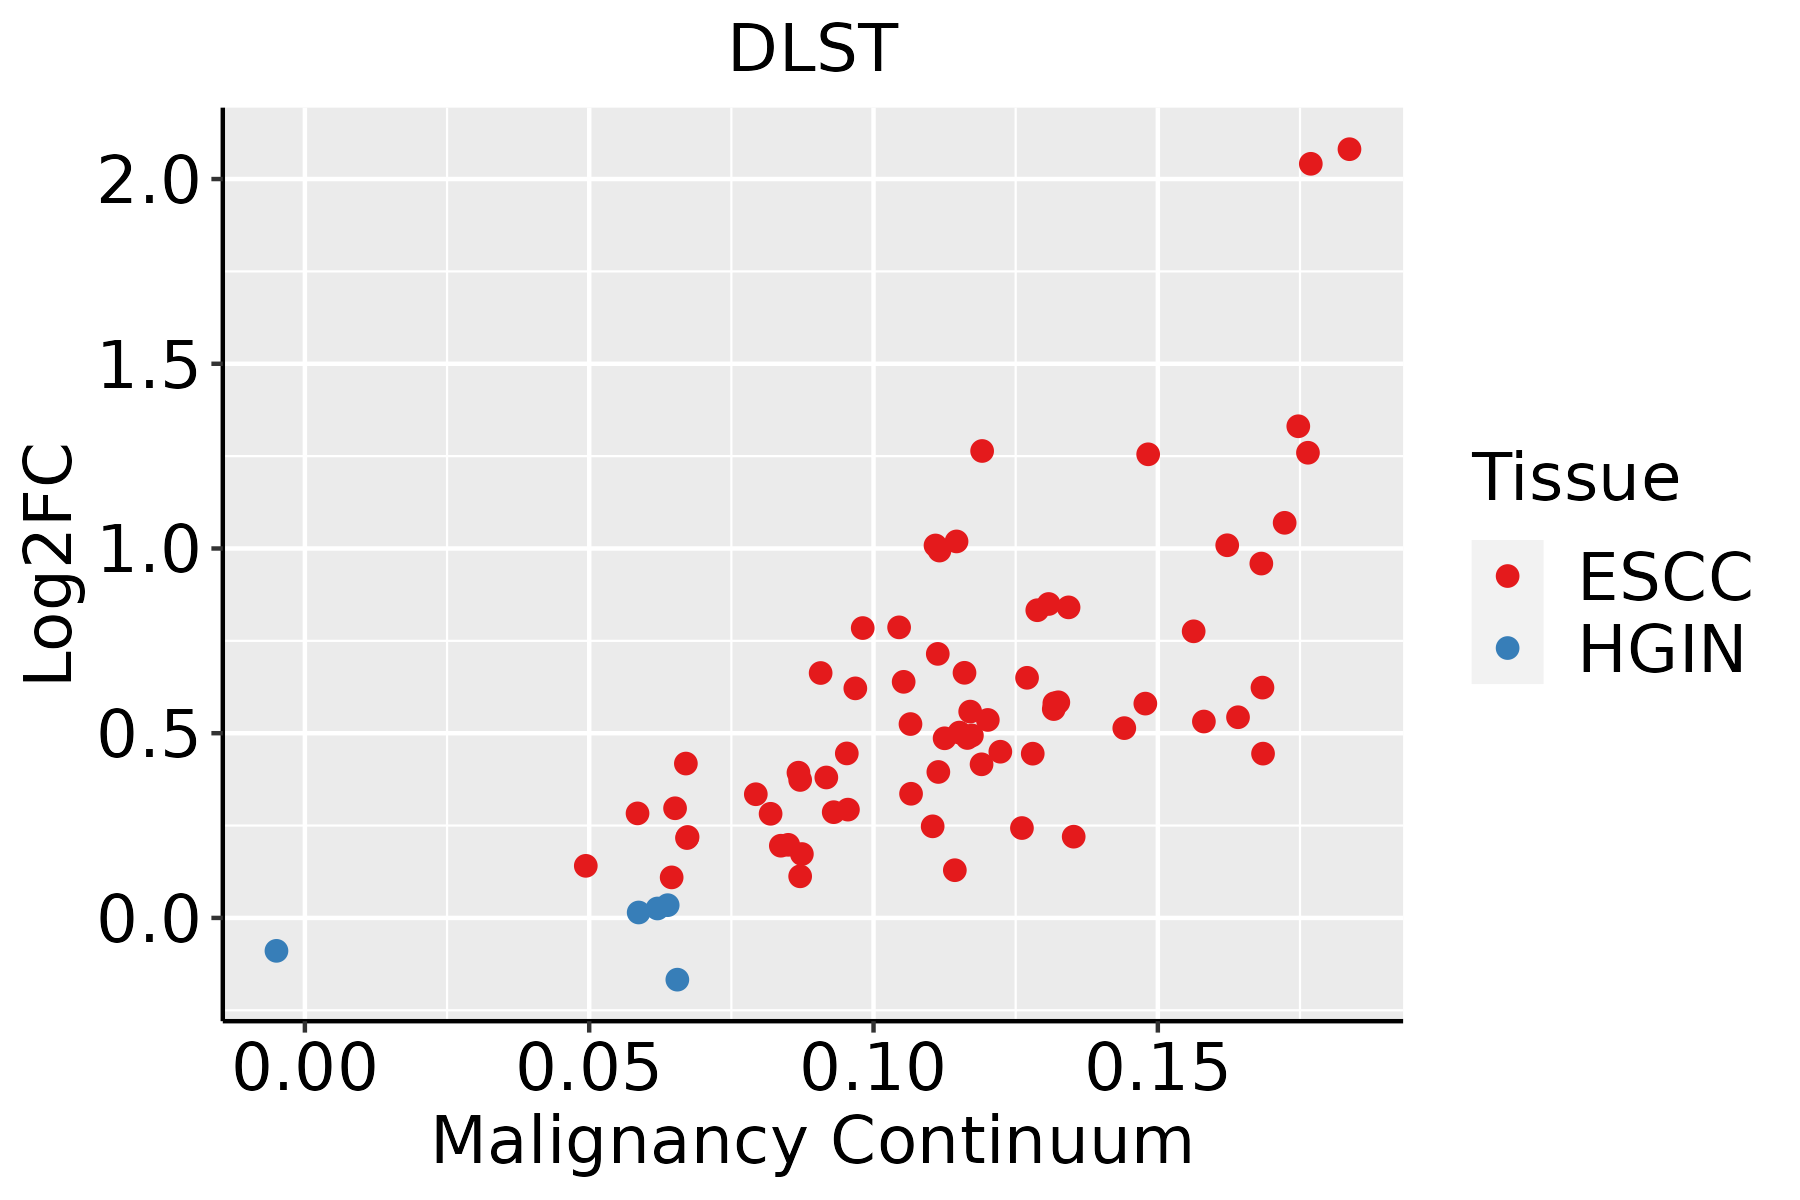 | ESCC: Esophageal squamous cell carcinoma |
| HGIN: High-grade intraepithelial neoplasias | ||
| LGIN: Low-grade intraepithelial neoplasias | ||
| Liver | 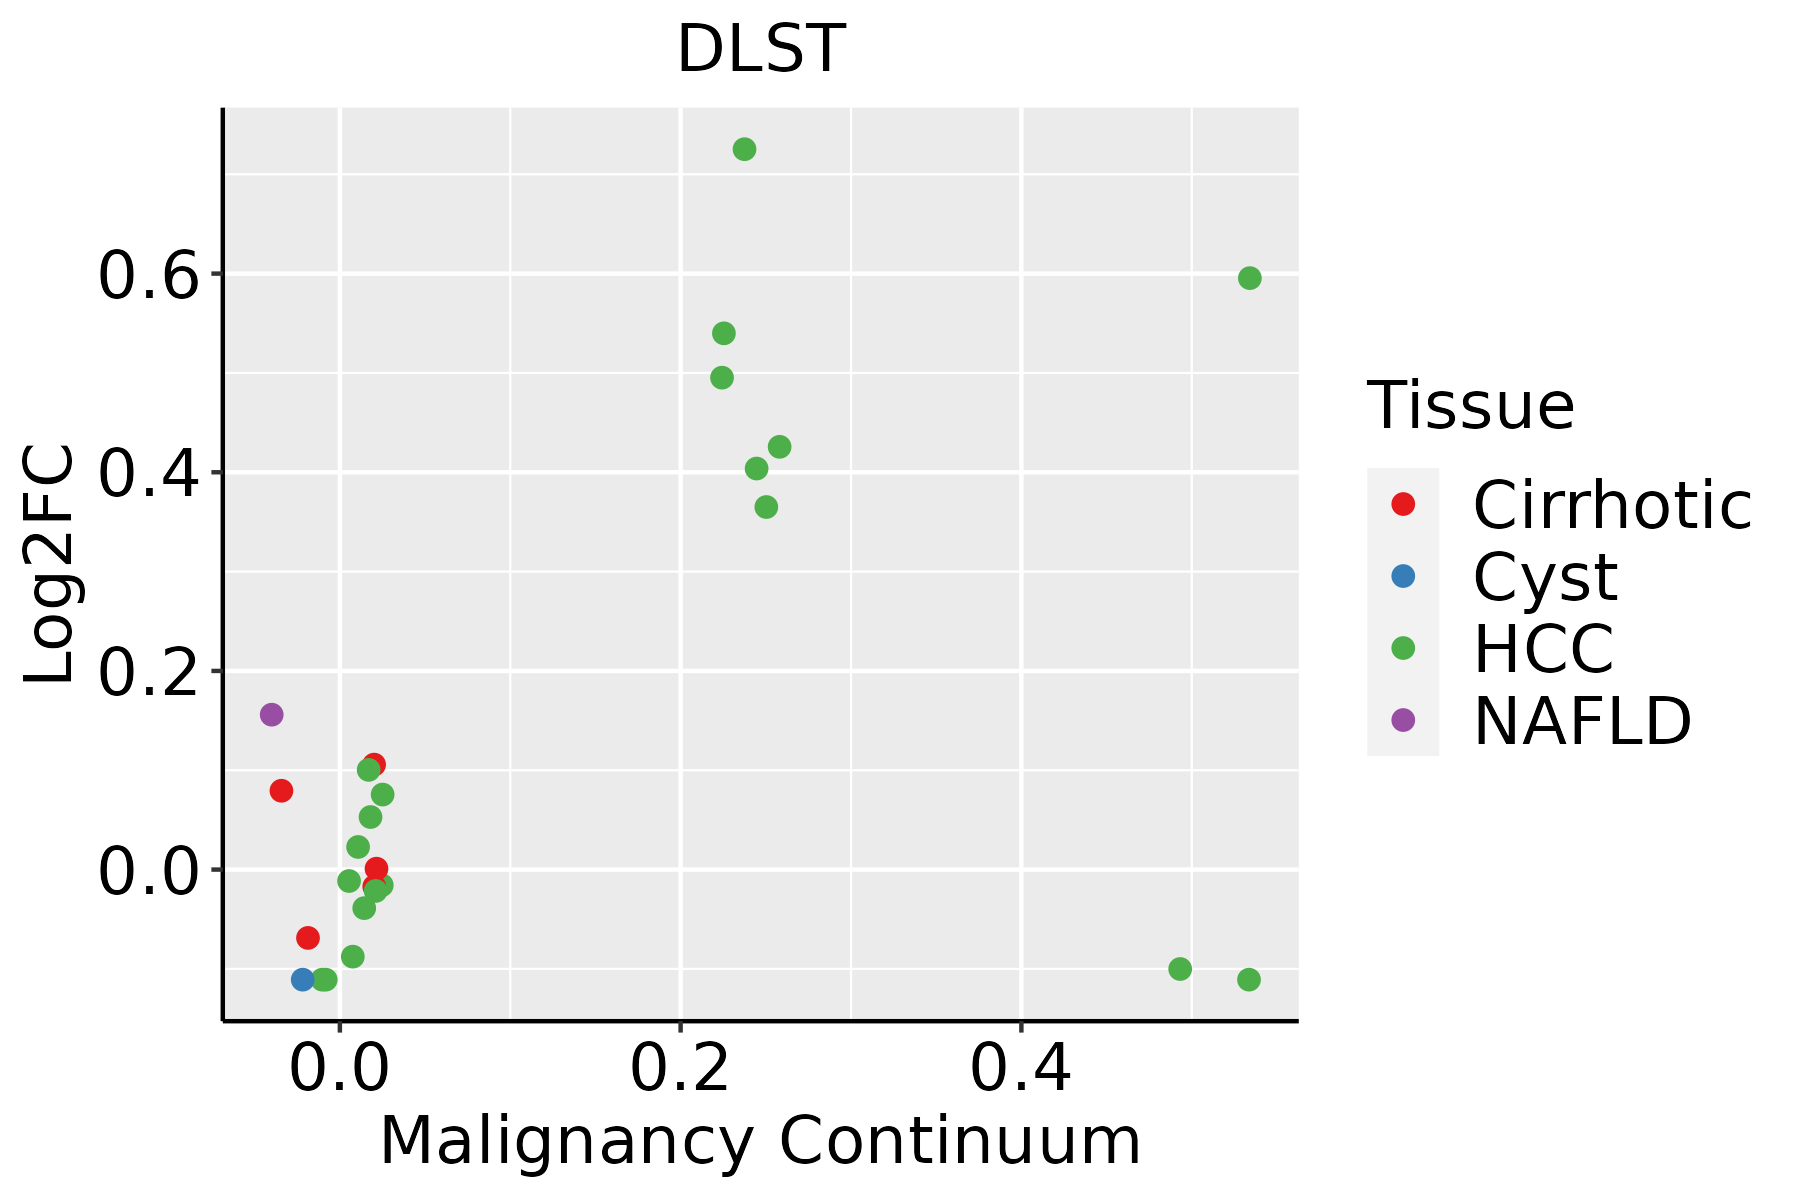 | HCC: Hepatocellular carcinoma |
| NAFLD: Non-alcoholic fatty liver disease | ||
| Oral Cavity | 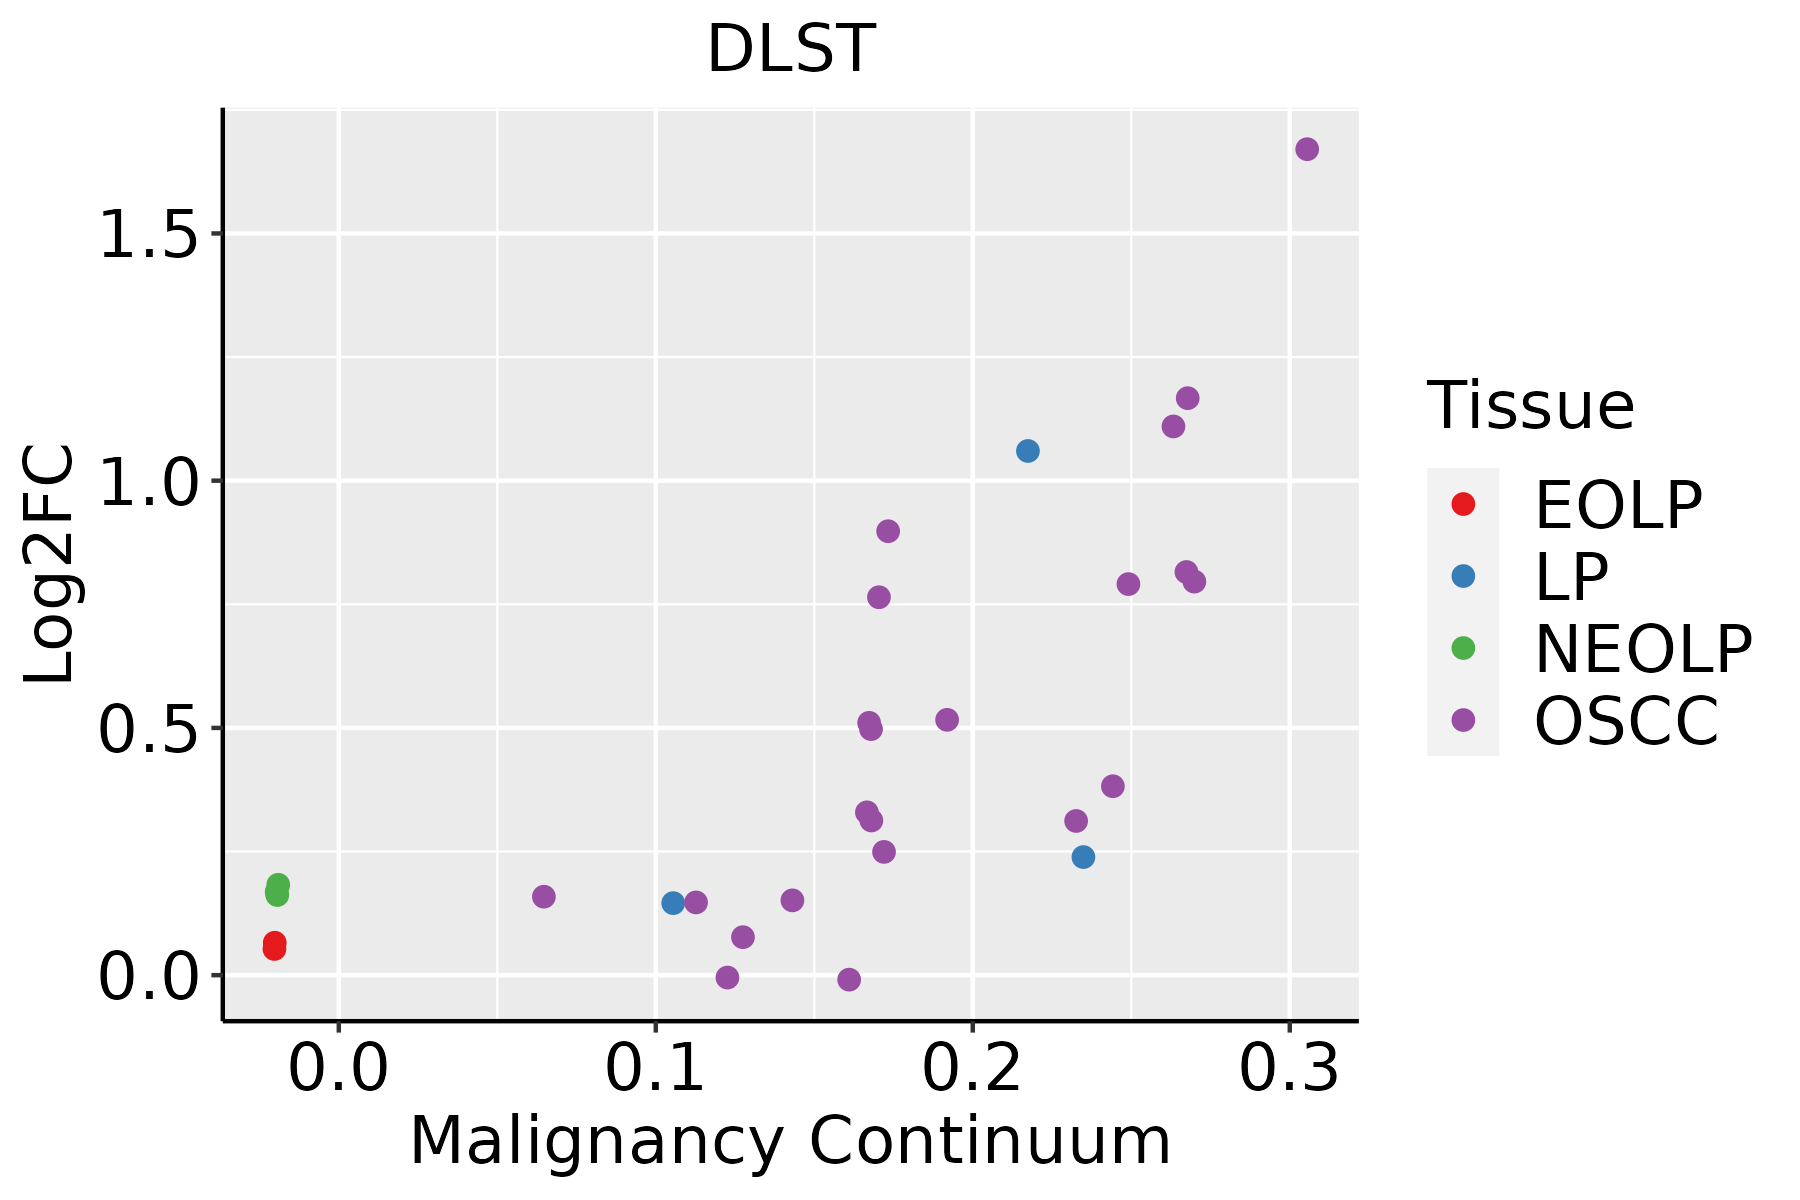 | EOLP: Erosive Oral lichen planus |
| LP: leukoplakia | ||
| NEOLP: Non-erosive oral lichen planus | ||
| OSCC: Oral squamous cell carcinoma | ||
| Skin | 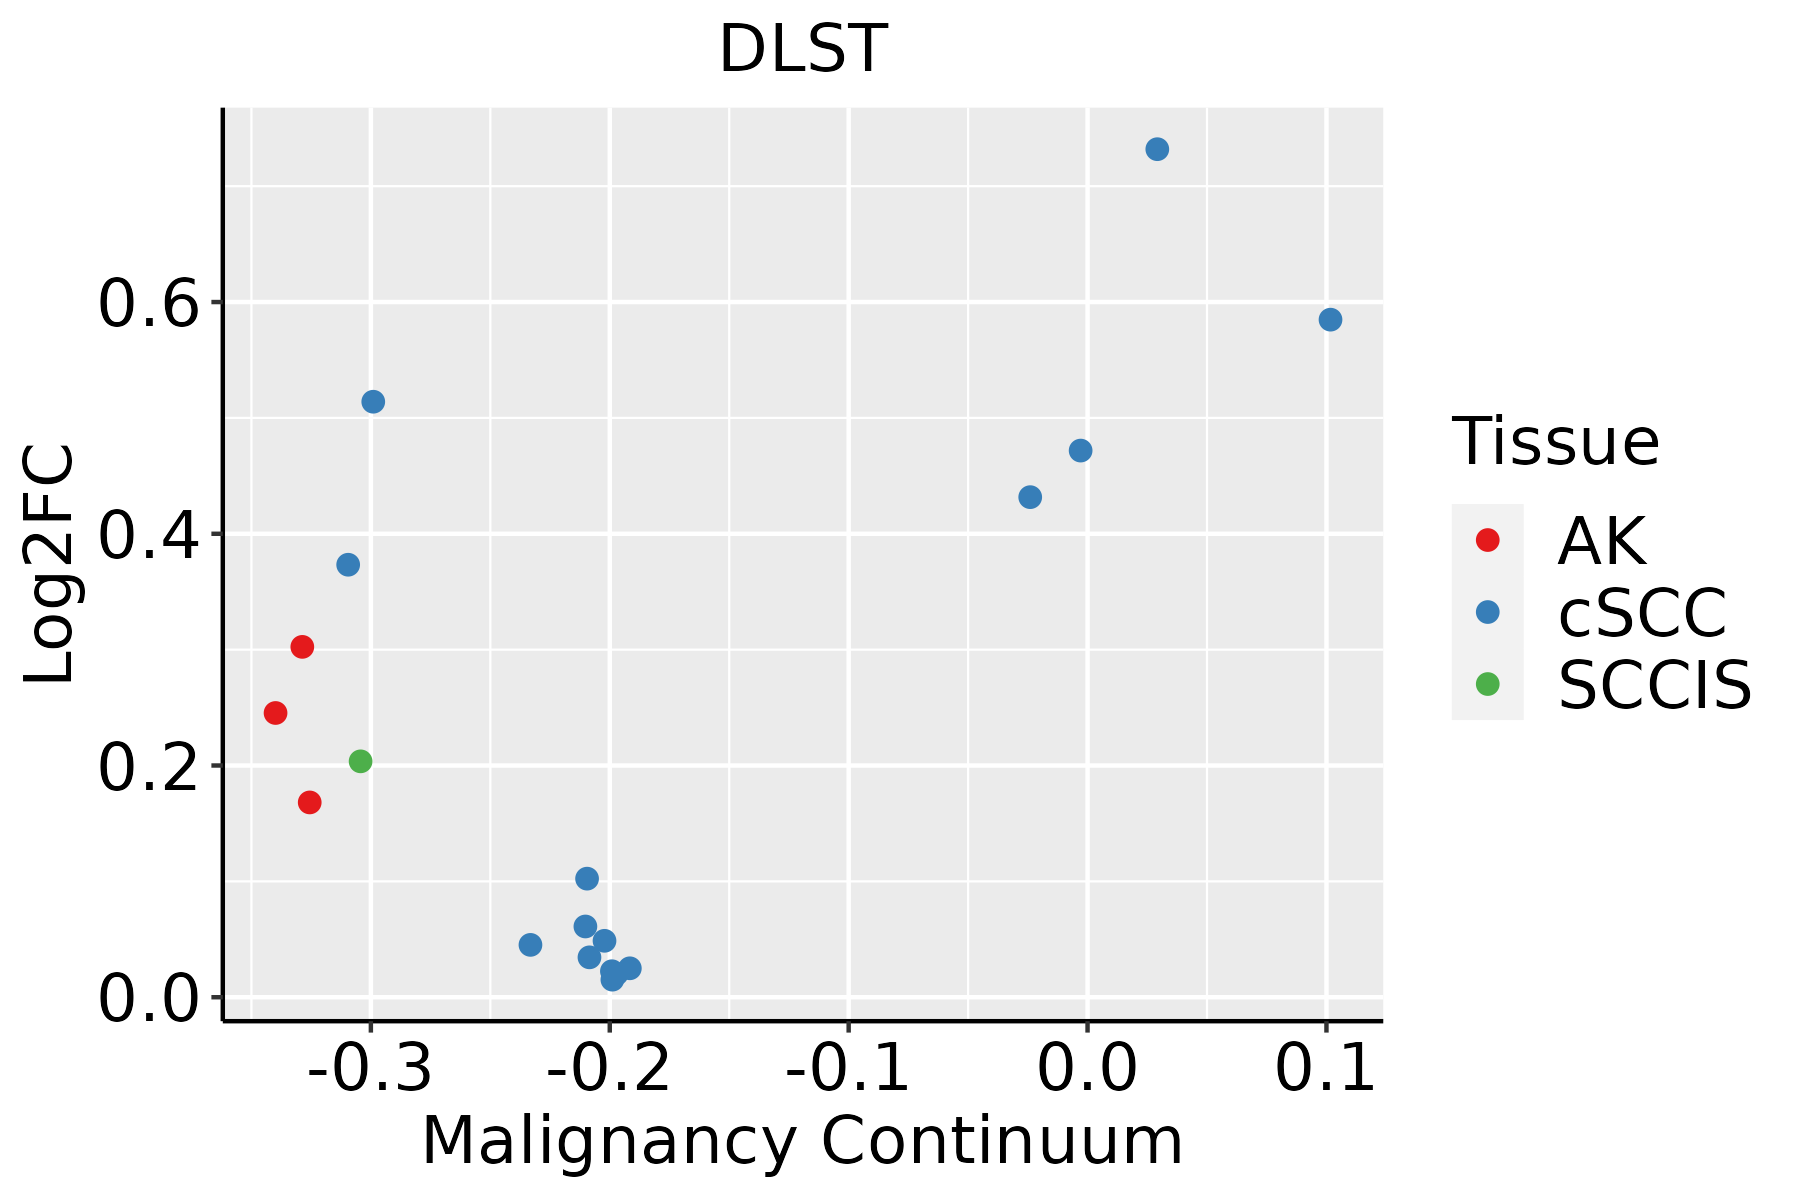 | AK: Actinic keratosis |
| cSCC: Cutaneous squamous cell carcinoma | ||
| SCCIS:squamous cell carcinoma in situ |
| ∗log2FC in expression of this searched gene in stem-like cells from each diseased tissue sample relative to stem-like cells in normal samples in each tissue plotted against the malignancy continuum. Samples are colored based on if they are from different disease stage. |
Top |
Malignant transformation related pathway analysis |
| Find out the enriched GO biological processes and KEGG pathways involved in transition from healthy to precancer to cancer |
| Tissue | Disease Stage | Enriched GO biological Processes |
| Colorectum | AD |  |
| Colorectum | SER |  |
| Colorectum | MSS |  |
| Colorectum | MSI-H |  |
| Colorectum | FAP |  |
| ∗Top 15 enriched GO BP terms are showed in the bar plot of each disease state in each tissue. Each row represents a significant GO biological process which is colored according to the -log10(p.adjust). |
| Page: 1 2 3 4 5 6 7 8 9 |
| GO ID | Tissue | Disease Stage | Description | Gene Ratio | Bg Ratio | pvalue | p.adjust | Count |
| GO:0006091 | Colorectum | AD | generation of precursor metabolites and energy | 209/3918 | 490/18723 | 3.17e-28 | 6.61e-25 | 209 |
| GO:0009060 | Colorectum | AD | aerobic respiration | 108/3918 | 189/18723 | 9.14e-28 | 1.43e-24 | 108 |
| GO:0045333 | Colorectum | AD | cellular respiration | 119/3918 | 230/18723 | 3.21e-25 | 4.02e-22 | 119 |
| GO:0015980 | Colorectum | AD | energy derivation by oxidation of organic compounds | 143/3918 | 318/18723 | 2.78e-22 | 2.49e-19 | 143 |
| GO:0009150 | Colorectum | AD | purine ribonucleotide metabolic process | 142/3918 | 368/18723 | 4.29e-15 | 1.17e-12 | 142 |
| GO:0006163 | Colorectum | AD | purine nucleotide metabolic process | 149/3918 | 396/18723 | 1.08e-14 | 2.80e-12 | 149 |
| GO:0072521 | Colorectum | AD | purine-containing compound metabolic process | 153/3918 | 416/18723 | 4.34e-14 | 1.01e-11 | 153 |
| GO:0009259 | Colorectum | AD | ribonucleotide metabolic process | 144/3918 | 385/18723 | 5.25e-14 | 1.13e-11 | 144 |
| GO:0019693 | Colorectum | AD | ribose phosphate metabolic process | 145/3918 | 396/18723 | 3.01e-13 | 5.71e-11 | 145 |
| GO:0009117 | Colorectum | AD | nucleotide metabolic process | 168/3918 | 489/18723 | 2.20e-12 | 3.36e-10 | 168 |
| GO:0006753 | Colorectum | AD | nucleoside phosphate metabolic process | 169/3918 | 497/18723 | 4.99e-12 | 6.98e-10 | 169 |
| GO:0006099 | Colorectum | AD | tricarboxylic acid cycle | 19/3918 | 30/18723 | 5.82e-07 | 2.09e-05 | 19 |
| GO:0044282 | Colorectum | AD | small molecule catabolic process | 118/3918 | 376/18723 | 1.05e-06 | 3.55e-05 | 118 |
| GO:0006790 | Colorectum | AD | sulfur compound metabolic process | 101/3918 | 339/18723 | 6.46e-05 | 1.07e-03 | 101 |
| GO:0016054 | Colorectum | AD | organic acid catabolic process | 73/3918 | 240/18723 | 3.20e-04 | 3.81e-03 | 73 |
| GO:0043648 | Colorectum | AD | dicarboxylic acid metabolic process | 34/3918 | 96/18723 | 7.22e-04 | 7.28e-03 | 34 |
| GO:0046395 | Colorectum | AD | carboxylic acid catabolic process | 70/3918 | 236/18723 | 9.06e-04 | 8.71e-03 | 70 |
| GO:0033865 | Colorectum | AD | nucleoside bisphosphate metabolic process | 42/3918 | 128/18723 | 1.12e-03 | 1.02e-02 | 42 |
| GO:0033875 | Colorectum | AD | ribonucleoside bisphosphate metabolic process | 42/3918 | 128/18723 | 1.12e-03 | 1.02e-02 | 42 |
| GO:0034032 | Colorectum | AD | purine nucleoside bisphosphate metabolic process | 42/3918 | 128/18723 | 1.12e-03 | 1.02e-02 | 42 |
| Page: 1 2 3 4 5 6 7 8 9 |
| Pathway ID | Tissue | Disease Stage | Description | Gene Ratio | Bg Ratio | pvalue | p.adjust | qvalue | Count |
| hsa01200 | Colorectum | AD | Carbon metabolism | 55/2092 | 115/8465 | 5.53e-08 | 8.42e-07 | 5.37e-07 | 55 |
| hsa00020 | Colorectum | AD | Citrate cycle (TCA cycle) | 20/2092 | 30/8465 | 1.43e-06 | 1.77e-05 | 1.13e-05 | 20 |
| hsa00310 | Colorectum | AD | Lysine degradation | 27/2092 | 63/8465 | 1.17e-03 | 7.75e-03 | 4.94e-03 | 27 |
| hsa012001 | Colorectum | AD | Carbon metabolism | 55/2092 | 115/8465 | 5.53e-08 | 8.42e-07 | 5.37e-07 | 55 |
| hsa000201 | Colorectum | AD | Citrate cycle (TCA cycle) | 20/2092 | 30/8465 | 1.43e-06 | 1.77e-05 | 1.13e-05 | 20 |
| hsa003101 | Colorectum | AD | Lysine degradation | 27/2092 | 63/8465 | 1.17e-03 | 7.75e-03 | 4.94e-03 | 27 |
| hsa012004 | Colorectum | MSS | Carbon metabolism | 43/1875 | 115/8465 | 1.37e-04 | 1.17e-03 | 7.19e-04 | 43 |
| hsa000204 | Colorectum | MSS | Citrate cycle (TCA cycle) | 16/1875 | 30/8465 | 1.84e-04 | 1.47e-03 | 9.00e-04 | 16 |
| hsa003102 | Colorectum | MSS | Lysine degradation | 24/1875 | 63/8465 | 2.94e-03 | 1.39e-02 | 8.50e-03 | 24 |
| hsa012005 | Colorectum | MSS | Carbon metabolism | 43/1875 | 115/8465 | 1.37e-04 | 1.17e-03 | 7.19e-04 | 43 |
| hsa000205 | Colorectum | MSS | Citrate cycle (TCA cycle) | 16/1875 | 30/8465 | 1.84e-04 | 1.47e-03 | 9.00e-04 | 16 |
| hsa003103 | Colorectum | MSS | Lysine degradation | 24/1875 | 63/8465 | 2.94e-03 | 1.39e-02 | 8.50e-03 | 24 |
| hsa012006 | Colorectum | FAP | Carbon metabolism | 38/1404 | 115/8465 | 1.04e-05 | 1.44e-04 | 8.76e-05 | 38 |
| hsa003104 | Colorectum | FAP | Lysine degradation | 23/1404 | 63/8465 | 1.04e-04 | 9.46e-04 | 5.76e-04 | 23 |
| hsa000206 | Colorectum | FAP | Citrate cycle (TCA cycle) | 14/1404 | 30/8465 | 1.16e-04 | 1.02e-03 | 6.21e-04 | 14 |
| hsa00380 | Colorectum | FAP | Tryptophan metabolism | 13/1404 | 42/8465 | 1.54e-02 | 4.99e-02 | 3.03e-02 | 13 |
| hsa012007 | Colorectum | FAP | Carbon metabolism | 38/1404 | 115/8465 | 1.04e-05 | 1.44e-04 | 8.76e-05 | 38 |
| hsa003105 | Colorectum | FAP | Lysine degradation | 23/1404 | 63/8465 | 1.04e-04 | 9.46e-04 | 5.76e-04 | 23 |
| hsa000207 | Colorectum | FAP | Citrate cycle (TCA cycle) | 14/1404 | 30/8465 | 1.16e-04 | 1.02e-03 | 6.21e-04 | 14 |
| hsa003801 | Colorectum | FAP | Tryptophan metabolism | 13/1404 | 42/8465 | 1.54e-02 | 4.99e-02 | 3.03e-02 | 13 |
| Page: 1 2 3 |
Top |
Cell-cell communication analysis |
| Identification of potential cell-cell interactions between two cell types and their ligand-receptor pairs for different disease states |
| Ligand | Receptor | LRpair | Pathway | Tissue | Disease Stage |
| Page: 1 |
Top |
Single-cell gene regulatory network inference analysis |
| Find out the significant the regulons (TFs) and the target genes of each regulon across cell types for different disease states |
| TF | Cell Type | Tissue | Disease Stage | Target Gene | RSS | Regulon Activity |
| ∗The dot plots of a searched regulon are shown for all cell subpopulations in each disease state of each tissue based on the regulon specific score inferred using pySCENIC and by calculating the average expression. |
| Page: 1 |
Top |
Somatic mutation of malignant transformation related genes |
| Annotation of somatic variants for genes involved in malignant transformation |
| Hugo Symbol | Variant Class | Variant Classification | dbSNP RS | HGVSc | HGVSp | HGVSp Short | SWISSPROT | BIOTYPE | SIFT | PolyPhen | Tumor Sample Barcode | Tissue | Histology | Sex | Age | Stage | Therapy Types | Drugs | Outcome |
| DLST | SNV | Missense_Mutation | novel | c.182N>A | p.Arg61Lys | p.R61K | P36957 | protein_coding | tolerated(0.28) | benign(0.03) | TCGA-A1-A0SI-01 | Breast | breast invasive carcinoma | Female | <65 | I/II | Unknown | Unknown | SD |
| DLST | SNV | Missense_Mutation | c.295N>A | p.Glu99Lys | p.E99K | P36957 | protein_coding | tolerated(0.14) | probably_damaging(0.995) | TCGA-A1-A0SI-01 | Breast | breast invasive carcinoma | Female | <65 | I/II | Unknown | Unknown | SD | |
| DLST | SNV | Missense_Mutation | c.98G>T | p.Gly33Val | p.G33V | P36957 | protein_coding | tolerated(0.06) | probably_damaging(0.994) | TCGA-A7-A26J-01 | Breast | breast invasive carcinoma | Female | <65 | I/II | Hormone Therapy | tamoxiphen | SD | |
| DLST | SNV | Missense_Mutation | rs773193795 | c.847G>C | p.Ala283Pro | p.A283P | P36957 | protein_coding | tolerated(0.21) | benign(0.09) | TCGA-AC-A2QJ-01 | Breast | breast invasive carcinoma | Female | <65 | III/IV | Chemotherapy | cytoxan | PD |
| DLST | SNV | Missense_Mutation | rs773193795 | c.847N>C | p.Ala283Pro | p.A283P | P36957 | protein_coding | tolerated(0.21) | benign(0.09) | TCGA-AC-A3BB-01 | Breast | breast invasive carcinoma | Female | <65 | III/IV | Chemotherapy | cytoxan | CR |
| DLST | SNV | Missense_Mutation | novel | c.532N>A | p.Ala178Thr | p.A178T | P36957 | protein_coding | tolerated(0.23) | possibly_damaging(0.575) | TCGA-AO-A03O-01 | Breast | breast invasive carcinoma | Female | >=65 | I/II | Chemotherapy | doxorubicin | SD |
| DLST | deletion | Frame_Shift_Del | novel | c.756delN | p.Asn252LysfsTer5 | p.N252Kfs*5 | P36957 | protein_coding | TCGA-D8-A27V-01 | Breast | breast invasive carcinoma | Female | <65 | I/II | Hormone Therapy | tamoxiphen | SD | ||
| DLST | deletion | Frame_Shift_Del | novel | c.1201delN | p.Asp401ThrfsTer6 | p.D401Tfs*6 | P36957 | protein_coding | TCGA-D8-A27V-01 | Breast | breast invasive carcinoma | Female | <65 | I/II | Hormone Therapy | tamoxiphen | SD | ||
| DLST | SNV | Missense_Mutation | novel | c.331N>C | p.Thr111Pro | p.T111P | P36957 | protein_coding | deleterious(0.04) | probably_damaging(0.998) | TCGA-2W-A8YY-01 | Cervix | cervical & endocervical cancer | Female | <65 | I/II | Chemotherapy | cisplatin | CR |
| DLST | SNV | Missense_Mutation | c.277G>A | p.Val93Ile | p.V93I | P36957 | protein_coding | tolerated(0.12) | probably_damaging(0.992) | TCGA-A6-5665-01 | Colorectum | colon adenocarcinoma | Female | >=65 | I/II | Unknown | Unknown | PD |
| Page: 1 2 3 4 5 6 |
Top |
Related drugs of malignant transformation related genes |
| Identification of chemicals and drugs interact with genes involved in malignant transfromation |
| (DGIdb 4.0) |
| Entrez ID | Symbol | Category | Interaction Types | Drug Claim Name | Drug Name | PMIDs |
| Page: 1 |

Copyright 2023-Present -The University of Texas Health Science Center at Houston |