
|
|||||
|
 | |
| |
| |
| |
| |
| |
|
Gene: DLL3 |
Gene summary for DLL3 |
| Gene information | Species | Human | Gene symbol | DLL3 | Gene ID | 10683 |
| Gene name | delta like canonical Notch ligand 3 | |
| Gene Alias | SCDO1 | |
| Cytomap | 19q13.2 | |
| Gene Type | protein-coding | GO ID | GO:0001501 | UniProtAcc | Q9NYJ7 |
Top |
Malignant transformation analysis |
| Identification of the aberrant gene expression in precancerous and cancerous lesions by comparing the gene expression of stem-like cells in diseased tissues with normal stem cells |
| Entrez ID | Symbol | Replicates | Species | Organ | Tissue | Adj P-value | Log2FC | Malignancy |
| 10683 | DLL3 | LZE24T | Human | Esophagus | ESCC | 4.15e-02 | 1.28e-01 | 0.0596 |
| 10683 | DLL3 | P4T-E | Human | Esophagus | ESCC | 1.05e-03 | 1.22e-01 | 0.1323 |
| 10683 | DLL3 | P10T-E | Human | Esophagus | ESCC | 1.62e-13 | 2.71e-01 | 0.116 |
| 10683 | DLL3 | P16T-E | Human | Esophagus | ESCC | 3.60e-13 | 2.63e-01 | 0.1153 |
| 10683 | DLL3 | P21T-E | Human | Esophagus | ESCC | 9.44e-07 | 2.31e-01 | 0.1617 |
| 10683 | DLL3 | P22T-E | Human | Esophagus | ESCC | 3.58e-28 | 4.95e-01 | 0.1236 |
| 10683 | DLL3 | P26T-E | Human | Esophagus | ESCC | 2.02e-06 | 1.83e-01 | 0.1276 |
| 10683 | DLL3 | P28T-E | Human | Esophagus | ESCC | 9.44e-07 | 1.52e-01 | 0.1149 |
| 10683 | DLL3 | P32T-E | Human | Esophagus | ESCC | 1.97e-10 | 2.47e-01 | 0.1666 |
| 10683 | DLL3 | P36T-E | Human | Esophagus | ESCC | 2.11e-03 | 1.49e-01 | 0.1187 |
| 10683 | DLL3 | P37T-E | Human | Esophagus | ESCC | 2.57e-08 | 1.99e-01 | 0.1371 |
| 10683 | DLL3 | P38T-E | Human | Esophagus | ESCC | 8.07e-09 | 3.32e-01 | 0.127 |
| 10683 | DLL3 | P57T-E | Human | Esophagus | ESCC | 3.75e-03 | 1.08e-01 | 0.0926 |
| 10683 | DLL3 | P61T-E | Human | Esophagus | ESCC | 1.02e-05 | 1.67e-01 | 0.099 |
| 10683 | DLL3 | P74T-E | Human | Esophagus | ESCC | 4.21e-29 | 8.07e-01 | 0.1479 |
| 10683 | DLL3 | P75T-E | Human | Esophagus | ESCC | 3.75e-03 | 1.02e-01 | 0.1125 |
| 10683 | DLL3 | P79T-E | Human | Esophagus | ESCC | 9.02e-11 | 2.08e-01 | 0.1154 |
| 10683 | DLL3 | P80T-E | Human | Esophagus | ESCC | 1.65e-20 | 4.64e-01 | 0.155 |
| 10683 | DLL3 | P83T-E | Human | Esophagus | ESCC | 5.38e-15 | 4.18e-01 | 0.1738 |
| 10683 | DLL3 | P89T-E | Human | Esophagus | ESCC | 3.85e-03 | 2.22e-01 | 0.1752 |
| Page: 1 2 |
| Tissue | Expression Dynamics | Abbreviation |
| Esophagus | 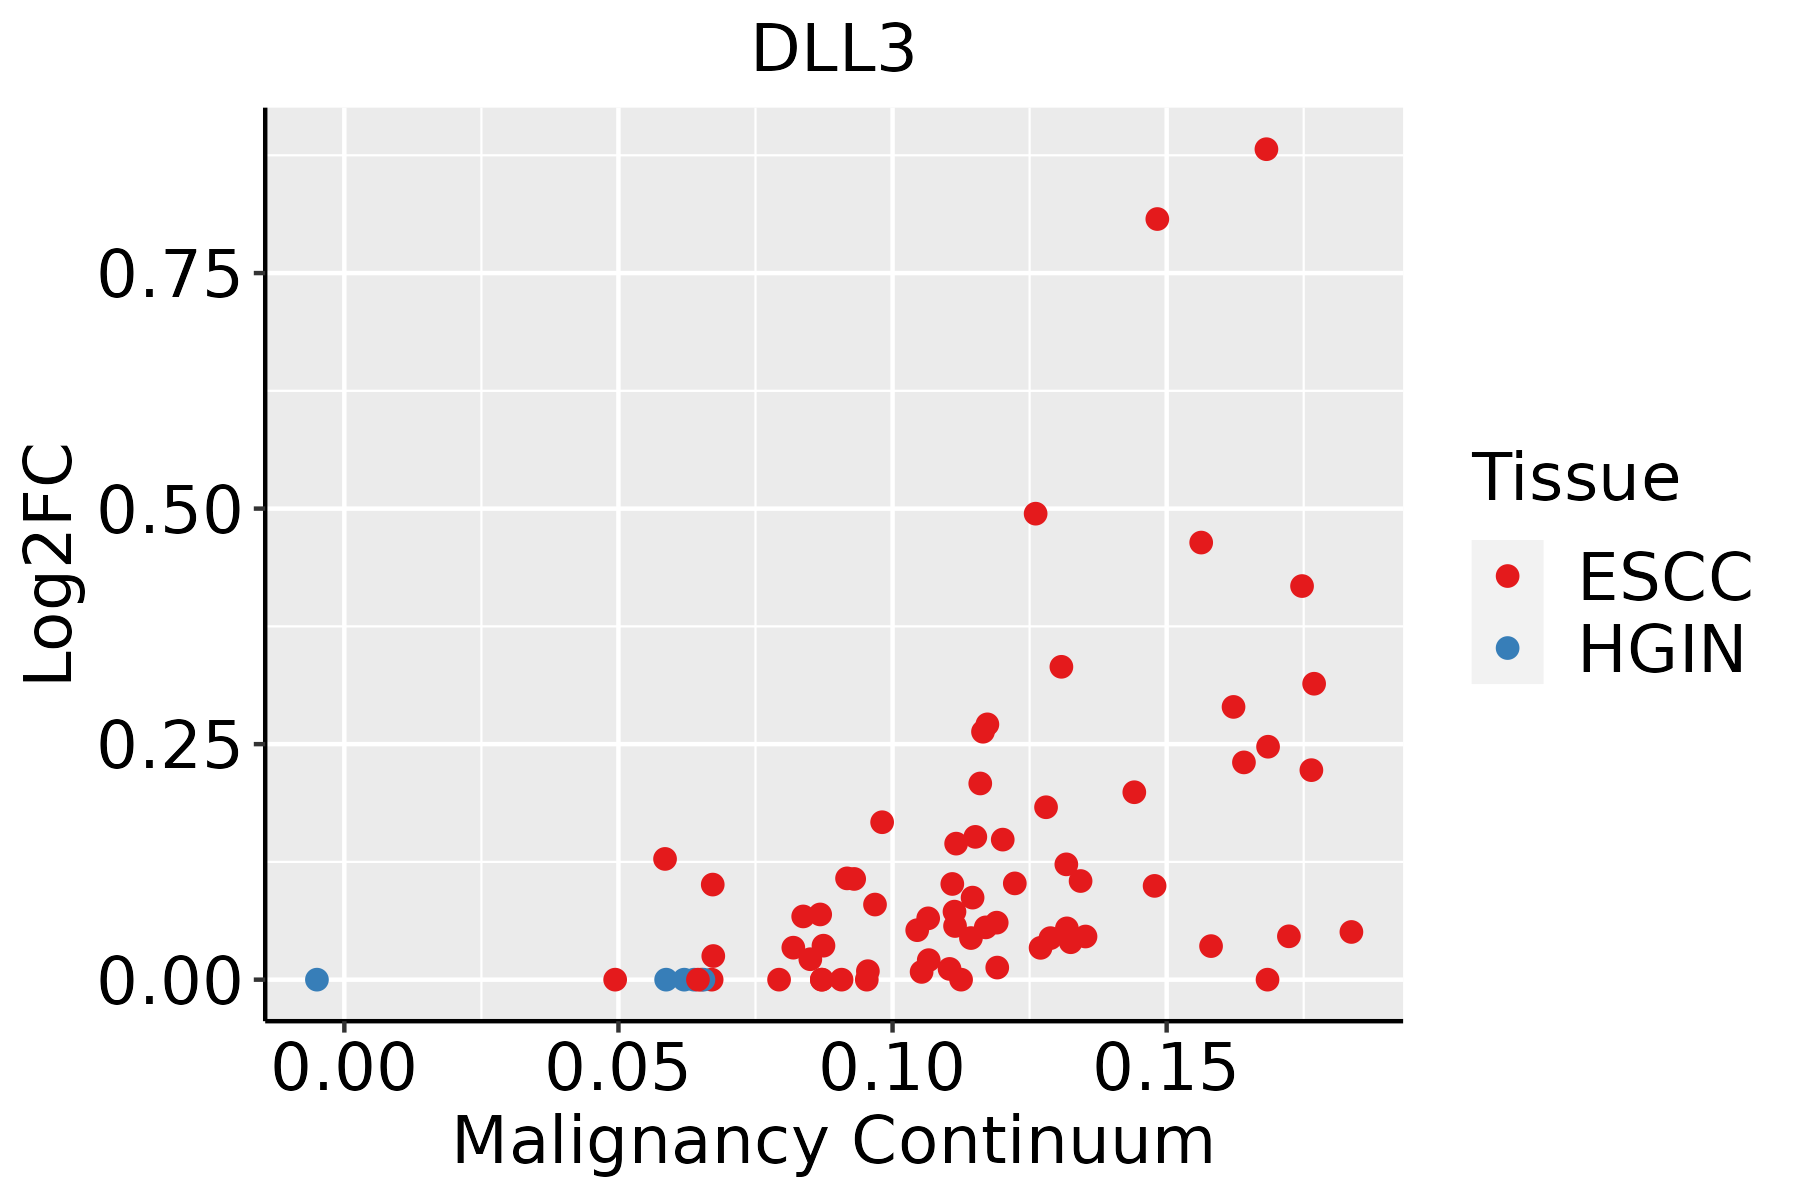 | ESCC: Esophageal squamous cell carcinoma |
| HGIN: High-grade intraepithelial neoplasias | ||
| LGIN: Low-grade intraepithelial neoplasias | ||
| Oral Cavity |  | EOLP: Erosive Oral lichen planus |
| LP: leukoplakia | ||
| NEOLP: Non-erosive oral lichen planus | ||
| OSCC: Oral squamous cell carcinoma | ||
| Thyroid | 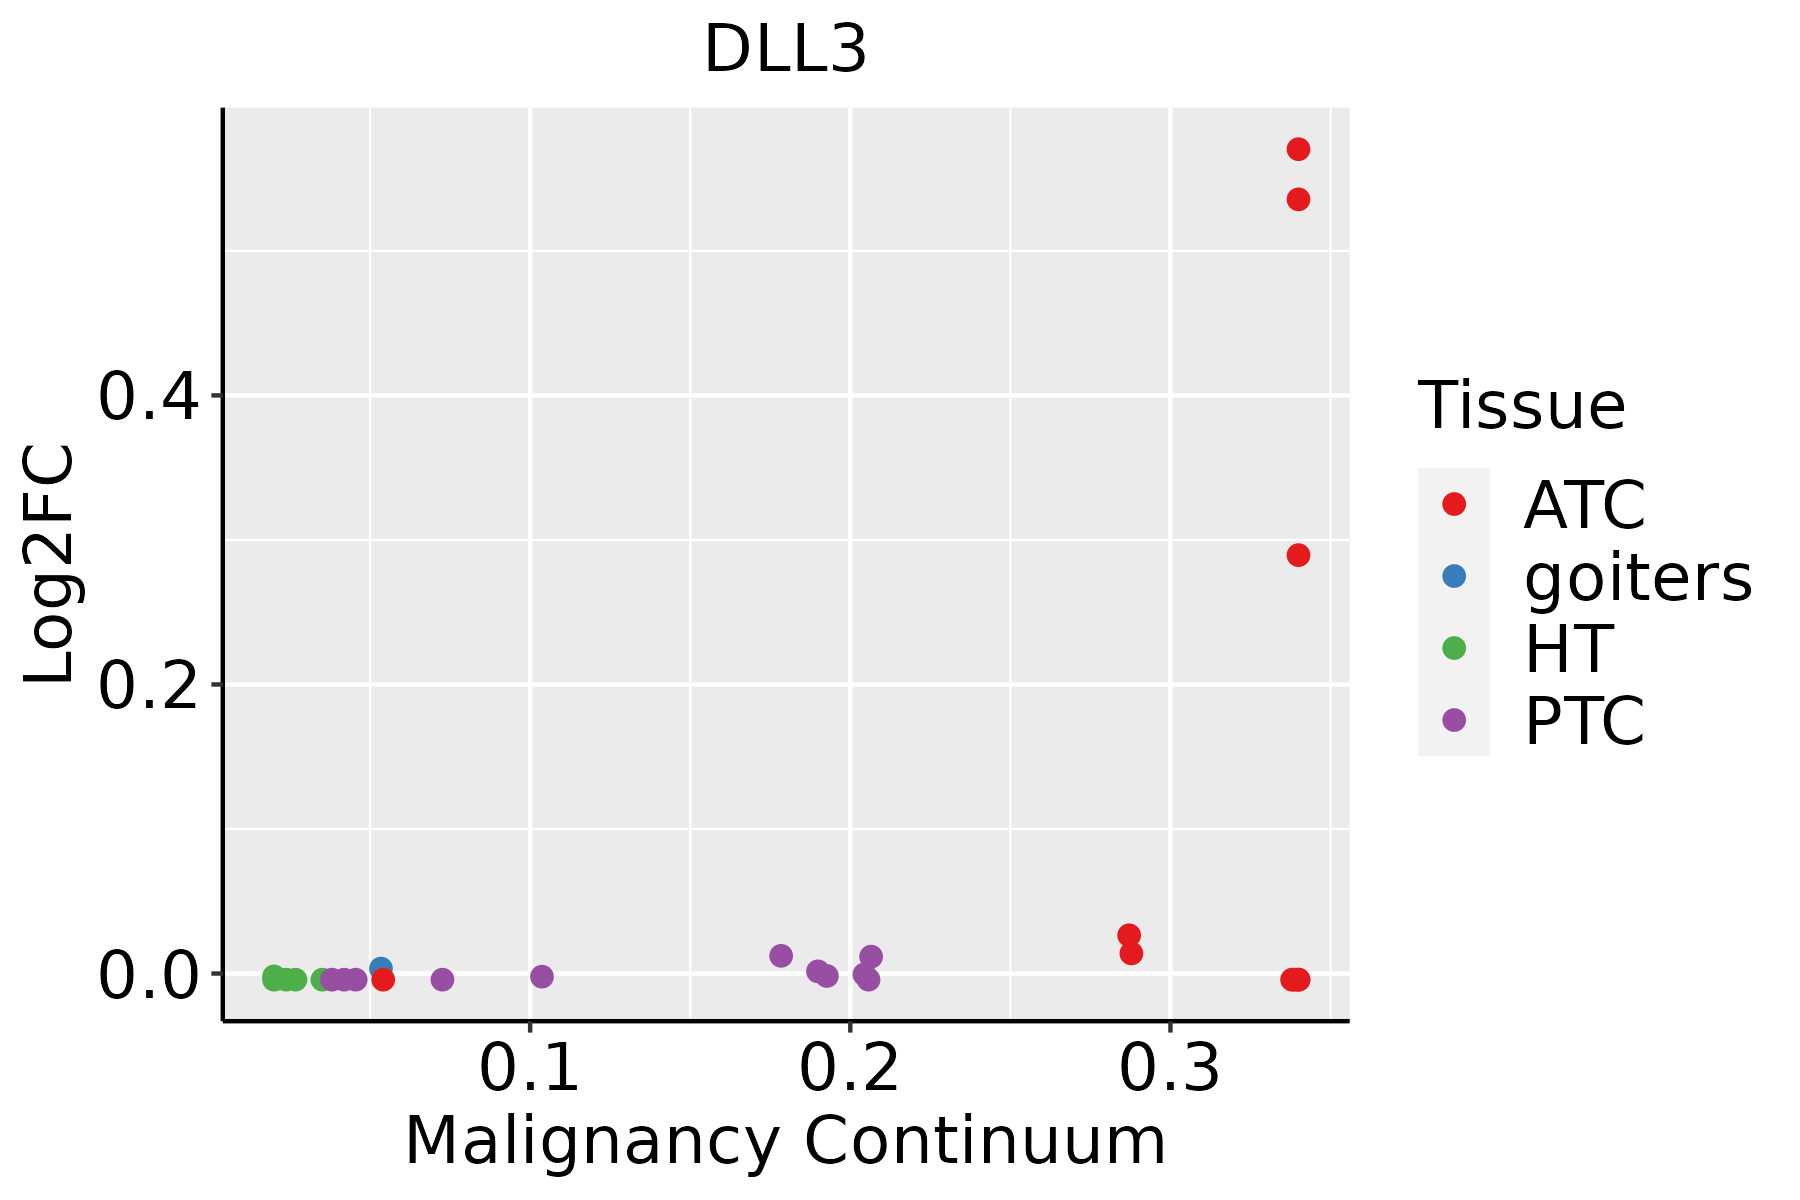 | ATC: Anaplastic thyroid cancer |
| HT: Hashimoto's thyroiditis | ||
| PTC: Papillary thyroid cancer |
| ∗log2FC in expression of this searched gene in stem-like cells from each diseased tissue sample relative to stem-like cells in normal samples in each tissue plotted against the malignancy continuum. Samples are colored based on if they are from different disease stage. |
Top |
Malignant transformation related pathway analysis |
| Find out the enriched GO biological processes and KEGG pathways involved in transition from healthy to precancer to cancer |
| Tissue | Disease Stage | Enriched GO biological Processes |
| Colorectum | AD |  |
| Colorectum | SER |  |
| Colorectum | MSS |  |
| Colorectum | MSI-H |  |
| Colorectum | FAP |  |
| ∗Top 15 enriched GO BP terms are showed in the bar plot of each disease state in each tissue. Each row represents a significant GO biological process which is colored according to the -log10(p.adjust). |
| Page: 1 2 3 4 5 6 7 8 9 |
| GO ID | Tissue | Disease Stage | Description | Gene Ratio | Bg Ratio | pvalue | p.adjust | Count |
| GO:00072197 | Esophagus | ESCC | Notch signaling pathway | 106/8552 | 172/18723 | 1.74e-05 | 1.55e-04 | 106 |
| GO:005076710 | Esophagus | ESCC | regulation of neurogenesis | 203/8552 | 364/18723 | 6.10e-05 | 4.68e-04 | 203 |
| GO:00519606 | Esophagus | ESCC | regulation of nervous system development | 237/8552 | 443/18723 | 5.02e-04 | 2.78e-03 | 237 |
| GO:00604856 | Esophagus | ESCC | mesenchyme development | 156/8552 | 291/18723 | 3.76e-03 | 1.53e-02 | 156 |
| GO:0048339 | Esophagus | ESCC | paraxial mesoderm development | 13/8552 | 17/18723 | 1.00e-02 | 3.42e-02 | 13 |
| GO:00507679 | Oral cavity | OSCC | regulation of neurogenesis | 179/7305 | 364/18723 | 4.49e-05 | 3.84e-04 | 179 |
| GO:00072196 | Oral cavity | OSCC | Notch signaling pathway | 92/7305 | 172/18723 | 7.84e-05 | 6.08e-04 | 92 |
| GO:00519605 | Oral cavity | OSCC | regulation of nervous system development | 205/7305 | 443/18723 | 9.80e-04 | 5.11e-03 | 205 |
| GO:005076723 | Thyroid | ATC | regulation of neurogenesis | 168/6293 | 364/18723 | 3.73e-07 | 5.48e-06 | 168 |
| GO:006048521 | Thyroid | ATC | mesenchyme development | 136/6293 | 291/18723 | 2.04e-06 | 2.43e-05 | 136 |
| GO:005196014 | Thyroid | ATC | regulation of nervous system development | 195/6293 | 443/18723 | 2.62e-06 | 3.06e-05 | 195 |
| GO:000721915 | Thyroid | ATC | Notch signaling pathway | 79/6293 | 172/18723 | 5.08e-04 | 2.96e-03 | 79 |
| GO:00107216 | Thyroid | ATC | negative regulation of cell development | 76/6293 | 180/18723 | 9.50e-03 | 3.49e-02 | 76 |
| Page: 1 |
| Pathway ID | Tissue | Disease Stage | Description | Gene Ratio | Bg Ratio | pvalue | p.adjust | qvalue | Count |
| hsa015227 | Esophagus | ESCC | Endocrine resistance | 63/4205 | 98/8465 | 2.38e-03 | 6.58e-03 | 3.37e-03 | 63 |
| hsa043306 | Esophagus | ESCC | Notch signaling pathway | 42/4205 | 62/8465 | 2.97e-03 | 7.97e-03 | 4.08e-03 | 42 |
| hsa046585 | Esophagus | ESCC | Th1 and Th2 cell differentiation | 58/4205 | 92/8465 | 6.49e-03 | 1.60e-02 | 8.19e-03 | 58 |
| hsa0152215 | Esophagus | ESCC | Endocrine resistance | 63/4205 | 98/8465 | 2.38e-03 | 6.58e-03 | 3.37e-03 | 63 |
| hsa0433013 | Esophagus | ESCC | Notch signaling pathway | 42/4205 | 62/8465 | 2.97e-03 | 7.97e-03 | 4.08e-03 | 42 |
| hsa0465812 | Esophagus | ESCC | Th1 and Th2 cell differentiation | 58/4205 | 92/8465 | 6.49e-03 | 1.60e-02 | 8.19e-03 | 58 |
| hsa043305 | Oral cavity | OSCC | Notch signaling pathway | 44/3704 | 62/8465 | 1.26e-05 | 5.55e-05 | 2.83e-05 | 44 |
| hsa015226 | Oral cavity | OSCC | Endocrine resistance | 63/3704 | 98/8465 | 3.09e-05 | 1.31e-04 | 6.67e-05 | 63 |
| hsa046584 | Oral cavity | OSCC | Th1 and Th2 cell differentiation | 53/3704 | 92/8465 | 5.00e-03 | 1.20e-02 | 6.13e-03 | 53 |
| hsa0433012 | Oral cavity | OSCC | Notch signaling pathway | 44/3704 | 62/8465 | 1.26e-05 | 5.55e-05 | 2.83e-05 | 44 |
| hsa0152214 | Oral cavity | OSCC | Endocrine resistance | 63/3704 | 98/8465 | 3.09e-05 | 1.31e-04 | 6.67e-05 | 63 |
| hsa0465811 | Oral cavity | OSCC | Th1 and Th2 cell differentiation | 53/3704 | 92/8465 | 5.00e-03 | 1.20e-02 | 6.13e-03 | 53 |
| Page: 1 |
Top |
Cell-cell communication analysis |
| Identification of potential cell-cell interactions between two cell types and their ligand-receptor pairs for different disease states |
| Ligand | Receptor | LRpair | Pathway | Tissue | Disease Stage |
| DLL3 | NOTCH1 | DLL3_NOTCH1 | NOTCH | THCA | Cancer |
| DLL3 | NOTCH2 | DLL3_NOTCH2 | NOTCH | THCA | Cancer |
| DLL3 | NOTCH3 | DLL3_NOTCH3 | NOTCH | THCA | Cancer |
| DLL3 | NOTCH4 | DLL3_NOTCH4 | NOTCH | THCA | Cancer |
| Page: 1 |
Top |
Single-cell gene regulatory network inference analysis |
| Find out the significant the regulons (TFs) and the target genes of each regulon across cell types for different disease states |
| TF | Cell Type | Tissue | Disease Stage | Target Gene | RSS | Regulon Activity |
| ∗The dot plots of a searched regulon are shown for all cell subpopulations in each disease state of each tissue based on the regulon specific score inferred using pySCENIC and by calculating the average expression. |
| Page: 1 |
Top |
Somatic mutation of malignant transformation related genes |
| Annotation of somatic variants for genes involved in malignant transformation |
| Hugo Symbol | Variant Class | Variant Classification | dbSNP RS | HGVSc | HGVSp | HGVSp Short | SWISSPROT | BIOTYPE | SIFT | PolyPhen | Tumor Sample Barcode | Tissue | Histology | Sex | Age | Stage | Therapy Types | Drugs | Outcome |
| DLL3 | SNV | Missense_Mutation | rs538488581 | c.904C>T | p.Arg302Cys | p.R302C | Q9NYJ7 | protein_coding | deleterious(0) | probably_damaging(0.981) | TCGA-AO-A128-01 | Breast | breast invasive carcinoma | Female | <65 | I/II | Chemotherapy | doxorubicin | SD |
| DLL3 | SNV | Missense_Mutation | novel | c.18N>A | p.Met6Ile | p.M6I | Q9NYJ7 | protein_coding | tolerated_low_confidence(0.08) | benign(0.003) | TCGA-2W-A8YY-01 | Cervix | cervical & endocervical cancer | Female | <65 | I/II | Chemotherapy | cisplatin | CR |
| DLL3 | SNV | Missense_Mutation | rs752084828 | c.956G>T | p.Gly319Val | p.G319V | Q9NYJ7 | protein_coding | deleterious(0) | probably_damaging(0.999) | TCGA-C5-A7X5-01 | Cervix | cervical & endocervical cancer | Female | >=65 | I/II | Chemotherapy | carboplatin | PD |
| DLL3 | SNV | Missense_Mutation | c.746N>T | p.Thr249Met | p.T249M | Q9NYJ7 | protein_coding | deleterious(0.02) | possibly_damaging(0.893) | TCGA-EK-A2RJ-01 | Cervix | cervical & endocervical cancer | Female | <65 | I/II | Unknown | Unknown | SD | |
| DLL3 | SNV | Missense_Mutation | novel | c.778C>T | p.Pro260Ser | p.P260S | Q9NYJ7 | protein_coding | tolerated(0.39) | benign(0.001) | TCGA-VS-A94X-01 | Cervix | cervical & endocervical cancer | Female | <65 | I/II | Chemotherapy | cisplatin | PD |
| DLL3 | SNV | Missense_Mutation | c.1772N>C | p.Leu591Pro | p.L591P | Q9NYJ7 | protein_coding | tolerated(0.17) | benign(0) | TCGA-CK-4951-01 | Colorectum | colon adenocarcinoma | Female | >=65 | I/II | Unknown | Unknown | PD | |
| DLL3 | SNV | Missense_Mutation | rs770966935 | c.373N>A | p.Glu125Lys | p.E125K | Q9NYJ7 | protein_coding | deleterious(0) | probably_damaging(0.991) | TCGA-AG-3892-01 | Colorectum | rectum adenocarcinoma | Female | <65 | I/II | Unknown | Unknown | SD |
| DLL3 | SNV | Missense_Mutation | novel | c.1727N>C | p.Val576Ala | p.V576A | Q9NYJ7 | protein_coding | deleterious(0.03) | benign(0.099) | TCGA-EI-6917-01 | Colorectum | rectum adenocarcinoma | Male | <65 | III/IV | Chemotherapy | 5fluorouracil+oxaciplatina+l-folinian | SD |
| DLL3 | SNV | Missense_Mutation | c.1088G>A | p.Arg363His | p.R363H | Q9NYJ7 | protein_coding | tolerated(0.18) | possibly_damaging(0.636) | TCGA-AJ-A3BH-01 | Endometrium | uterine corpus endometrioid carcinoma | Female | Unknown | I/II | Unknown | Unknown | SD | |
| DLL3 | SNV | Missense_Mutation | rs530857183 | c.1030G>A | p.Gly344Ser | p.G344S | Q9NYJ7 | protein_coding | tolerated(0.1) | benign(0.351) | TCGA-AP-A0LM-01 | Endometrium | uterine corpus endometrioid carcinoma | Female | <65 | III/IV | Chemotherapy | cisplatin | SD |
| Page: 1 2 3 4 5 |
Top |
Related drugs of malignant transformation related genes |
| Identification of chemicals and drugs interact with genes involved in malignant transfromation |
| (DGIdb 4.0) |
| Entrez ID | Symbol | Category | Interaction Types | Drug Claim Name | Drug Name | PMIDs |
| 10683 | DLL3 | NA | AMG 119 | |||
| 10683 | DLL3 | NA | ROVALPITUZUMAB TESIRINE | 27932068 | ||
| 10683 | DLL3 | NA | Rova-T | ROVALPITUZUMAB TESIRINE |
| Page: 1 |

Copyright 2023-Present -The University of Texas Health Science Center at Houston |