
|
|||||
|
 | |
| |
| |
| |
| |
| |
|
Gene: DLK2 |
Gene summary for DLK2 |
| Gene information | Species | Human | Gene symbol | DLK2 | Gene ID | 65989 |
| Gene name | delta like non-canonical Notch ligand 2 | |
| Gene Alias | DLK-2 | |
| Cytomap | 6p21.1 | |
| Gene Type | protein-coding | GO ID | GO:0007154 | UniProtAcc | Q6UY11 |
Top |
Malignant transformation analysis |
| Identification of the aberrant gene expression in precancerous and cancerous lesions by comparing the gene expression of stem-like cells in diseased tissues with normal stem cells |
| Entrez ID | Symbol | Replicates | Species | Organ | Tissue | Adj P-value | Log2FC | Malignancy |
| 65989 | DLK2 | LZE24T | Human | Esophagus | ESCC | 4.93e-18 | 1.31e+00 | 0.0596 |
| 65989 | DLK2 | P1T-E | Human | Esophagus | ESCC | 4.33e-02 | 3.67e-01 | 0.0875 |
| 65989 | DLK2 | P2T-E | Human | Esophagus | ESCC | 4.54e-12 | 3.39e-01 | 0.1177 |
| 65989 | DLK2 | P4T-E | Human | Esophagus | ESCC | 1.27e-09 | 4.07e-01 | 0.1323 |
| 65989 | DLK2 | P5T-E | Human | Esophagus | ESCC | 1.69e-11 | 3.08e-01 | 0.1327 |
| 65989 | DLK2 | P8T-E | Human | Esophagus | ESCC | 4.07e-14 | 6.08e-01 | 0.0889 |
| 65989 | DLK2 | P10T-E | Human | Esophagus | ESCC | 3.41e-32 | 7.19e-01 | 0.116 |
| 65989 | DLK2 | P11T-E | Human | Esophagus | ESCC | 2.70e-10 | 9.24e-01 | 0.1426 |
| 65989 | DLK2 | P12T-E | Human | Esophagus | ESCC | 4.87e-53 | 1.48e+00 | 0.1122 |
| 65989 | DLK2 | P15T-E | Human | Esophagus | ESCC | 3.19e-37 | 8.38e-01 | 0.1149 |
| 65989 | DLK2 | P16T-E | Human | Esophagus | ESCC | 2.27e-17 | 4.63e-01 | 0.1153 |
| 65989 | DLK2 | P17T-E | Human | Esophagus | ESCC | 1.16e-05 | 5.72e-01 | 0.1278 |
| 65989 | DLK2 | P21T-E | Human | Esophagus | ESCC | 7.15e-46 | 1.14e+00 | 0.1617 |
| 65989 | DLK2 | P22T-E | Human | Esophagus | ESCC | 1.62e-02 | -6.21e-02 | 0.1236 |
| 65989 | DLK2 | P23T-E | Human | Esophagus | ESCC | 8.12e-06 | 4.56e-01 | 0.108 |
| 65989 | DLK2 | P24T-E | Human | Esophagus | ESCC | 4.28e-02 | 3.93e-02 | 0.1287 |
| 65989 | DLK2 | P26T-E | Human | Esophagus | ESCC | 1.47e-61 | 1.36e+00 | 0.1276 |
| 65989 | DLK2 | P27T-E | Human | Esophagus | ESCC | 9.90e-41 | 9.32e-01 | 0.1055 |
| 65989 | DLK2 | P28T-E | Human | Esophagus | ESCC | 1.63e-04 | 2.12e-01 | 0.1149 |
| 65989 | DLK2 | P30T-E | Human | Esophagus | ESCC | 6.46e-15 | 8.42e-01 | 0.137 |
| Page: 1 2 3 4 |
| Tissue | Expression Dynamics | Abbreviation |
| Esophagus |  | ESCC: Esophageal squamous cell carcinoma |
| HGIN: High-grade intraepithelial neoplasias | ||
| LGIN: Low-grade intraepithelial neoplasias | ||
| Oral Cavity |  | EOLP: Erosive Oral lichen planus |
| LP: leukoplakia | ||
| NEOLP: Non-erosive oral lichen planus | ||
| OSCC: Oral squamous cell carcinoma | ||
| Skin | 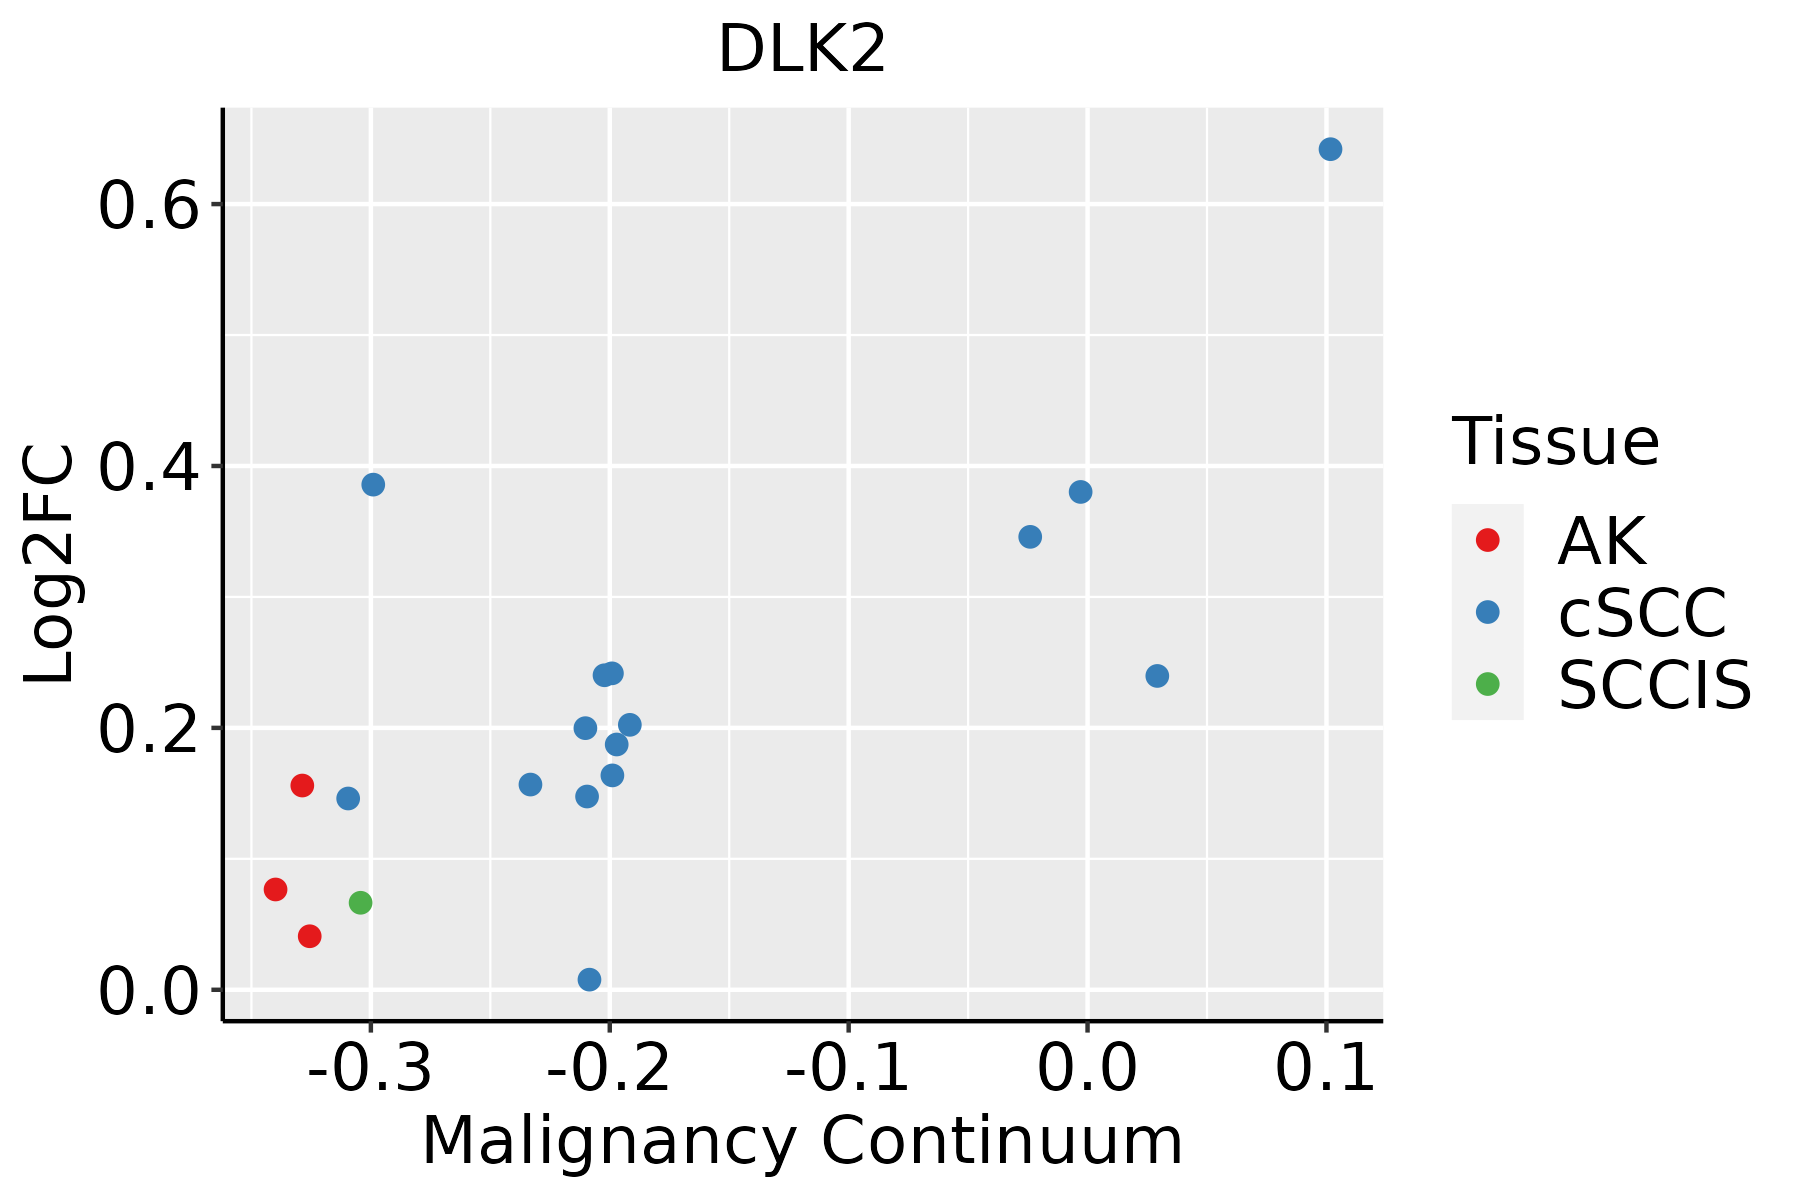 | AK: Actinic keratosis |
| cSCC: Cutaneous squamous cell carcinoma | ||
| SCCIS:squamous cell carcinoma in situ |
| ∗log2FC in expression of this searched gene in stem-like cells from each diseased tissue sample relative to stem-like cells in normal samples in each tissue plotted against the malignancy continuum. Samples are colored based on if they are from different disease stage. |
Top |
Malignant transformation related pathway analysis |
| Find out the enriched GO biological processes and KEGG pathways involved in transition from healthy to precancer to cancer |
| Tissue | Disease Stage | Enriched GO biological Processes |
| Colorectum | AD |  |
| Colorectum | SER |  |
| Colorectum | MSS |  |
| Colorectum | MSI-H |  |
| Colorectum | FAP |  |
| ∗Top 15 enriched GO BP terms are showed in the bar plot of each disease state in each tissue. Each row represents a significant GO biological process which is colored according to the -log10(p.adjust). |
| Page: 1 2 3 4 5 6 7 8 9 |
| GO ID | Tissue | Disease Stage | Description | Gene Ratio | Bg Ratio | pvalue | p.adjust | Count |
| GO:00072197 | Esophagus | ESCC | Notch signaling pathway | 106/8552 | 172/18723 | 1.74e-05 | 1.55e-04 | 106 |
| GO:00454449 | Esophagus | ESCC | fat cell differentiation | 135/8552 | 229/18723 | 3.38e-05 | 2.78e-04 | 135 |
| GO:0045746 | Esophagus | ESCC | negative regulation of Notch signaling pathway | 28/8552 | 36/18723 | 8.62e-05 | 6.22e-04 | 28 |
| GO:00085935 | Esophagus | ESCC | regulation of Notch signaling pathway | 59/8552 | 95/18723 | 9.12e-04 | 4.65e-03 | 59 |
| GO:00455984 | Esophagus | ESCC | regulation of fat cell differentiation | 79/8552 | 139/18723 | 5.23e-03 | 1.97e-02 | 79 |
| GO:00454448 | Oral cavity | OSCC | fat cell differentiation | 120/7305 | 229/18723 | 2.48e-05 | 2.32e-04 | 120 |
| GO:00455983 | Oral cavity | OSCC | regulation of fat cell differentiation | 77/7305 | 139/18723 | 6.36e-05 | 5.18e-04 | 77 |
| GO:00072196 | Oral cavity | OSCC | Notch signaling pathway | 92/7305 | 172/18723 | 7.84e-05 | 6.08e-04 | 92 |
| GO:00085934 | Oral cavity | OSCC | regulation of Notch signaling pathway | 53/7305 | 95/18723 | 6.64e-04 | 3.72e-03 | 53 |
| GO:000859311 | Oral cavity | LP | regulation of Notch signaling pathway | 35/4623 | 95/18723 | 5.53e-03 | 3.34e-02 | 35 |
| GO:000721913 | Oral cavity | LP | Notch signaling pathway | 57/4623 | 172/18723 | 7.60e-03 | 4.18e-02 | 57 |
| GO:004544410 | Skin | AK | fat cell differentiation | 43/1910 | 229/18723 | 5.87e-05 | 8.75e-04 | 43 |
| GO:00072198 | Skin | AK | Notch signaling pathway | 34/1910 | 172/18723 | 1.20e-04 | 1.50e-03 | 34 |
| GO:00085936 | Skin | AK | regulation of Notch signaling pathway | 21/1910 | 95/18723 | 4.96e-04 | 4.58e-03 | 21 |
| GO:00455985 | Skin | AK | regulation of fat cell differentiation | 27/1910 | 139/18723 | 7.62e-04 | 6.39e-03 | 27 |
| GO:000721922 | Skin | cSCC | Notch signaling pathway | 60/4864 | 172/18723 | 5.82e-03 | 2.87e-02 | 60 |
| Page: 1 |
| Pathway ID | Tissue | Disease Stage | Description | Gene Ratio | Bg Ratio | pvalue | p.adjust | qvalue | Count |
| Page: 1 |
Top |
Cell-cell communication analysis |
| Identification of potential cell-cell interactions between two cell types and their ligand-receptor pairs for different disease states |
| Ligand | Receptor | LRpair | Pathway | Tissue | Disease Stage |
| Page: 1 |
Top |
Single-cell gene regulatory network inference analysis |
| Find out the significant the regulons (TFs) and the target genes of each regulon across cell types for different disease states |
| TF | Cell Type | Tissue | Disease Stage | Target Gene | RSS | Regulon Activity |
| ∗The dot plots of a searched regulon are shown for all cell subpopulations in each disease state of each tissue based on the regulon specific score inferred using pySCENIC and by calculating the average expression. |
| Page: 1 |
Top |
Somatic mutation of malignant transformation related genes |
| Annotation of somatic variants for genes involved in malignant transformation |
| Hugo Symbol | Variant Class | Variant Classification | dbSNP RS | HGVSc | HGVSp | HGVSp Short | SWISSPROT | BIOTYPE | SIFT | PolyPhen | Tumor Sample Barcode | Tissue | Histology | Sex | Age | Stage | Therapy Types | Drugs | Outcome |
| DLK2 | SNV | Missense_Mutation | c.619N>T | p.Arg207Cys | p.R207C | Q6UY11 | protein_coding | deleterious(0) | probably_damaging(0.998) | TCGA-AO-A03T-01 | Breast | breast invasive carcinoma | Female | <65 | I/II | Chemotherapy | cyclophosphamide | SD | |
| DLK2 | SNV | Missense_Mutation | novel | c.1088N>A | p.Leu363Gln | p.L363Q | Q6UY11 | protein_coding | deleterious_low_confidence(0) | probably_damaging(0.909) | TCGA-DS-A1OB-01 | Cervix | cervical & endocervical cancer | Female | <65 | I/II | Chemotherapy | carboplatin | PD |
| DLK2 | insertion | Frame_Shift_Ins | novel | c.1089_1090insAGCAG | p.Pro364SerfsTer73 | p.P364Sfs*73 | Q6UY11 | protein_coding | TCGA-DS-A1OB-01 | Cervix | cervical & endocervical cancer | Female | <65 | I/II | Chemotherapy | carboplatin | PD | ||
| DLK2 | SNV | Missense_Mutation | novel | c.387G>T | p.Glu129Asp | p.E129D | Q6UY11 | protein_coding | deleterious(0.02) | possibly_damaging(0.825) | TCGA-AA-3930-01 | Colorectum | colon adenocarcinoma | Male | >=65 | III/IV | Chemotherapy | capecitabine | PD |
| DLK2 | SNV | Missense_Mutation | rs768837940 | c.863N>A | p.Arg288Gln | p.R288Q | Q6UY11 | protein_coding | deleterious(0.01) | benign(0.325) | TCGA-AA-A022-01 | Colorectum | colon adenocarcinoma | Female | >=65 | I/II | Unknown | Unknown | SD |
| DLK2 | SNV | Missense_Mutation | rs367675670 | c.428N>A | p.Arg143His | p.R143H | Q6UY11 | protein_coding | deleterious(0.01) | benign(0.001) | TCGA-A5-A0G2-01 | Endometrium | uterine corpus endometrioid carcinoma | Female | <65 | III/IV | Unknown | Unknown | SD |
| DLK2 | SNV | Missense_Mutation | c.620G>A | p.Arg207His | p.R207H | Q6UY11 | protein_coding | deleterious(0) | probably_damaging(0.998) | TCGA-AJ-A3OK-01 | Endometrium | uterine corpus endometrioid carcinoma | Female | >=65 | I/II | Chemotherapy | carboplatin | CR | |
| DLK2 | SNV | Missense_Mutation | rs765546362 | c.683N>A | p.Arg228Gln | p.R228Q | Q6UY11 | protein_coding | tolerated(0.26) | possibly_damaging(0.712) | TCGA-AP-A051-01 | Endometrium | uterine corpus endometrioid carcinoma | Female | >=65 | I/II | Unknown | Unknown | SD |
| DLK2 | SNV | Missense_Mutation | c.1070A>C | p.Glu357Ala | p.E357A | Q6UY11 | protein_coding | deleterious(0) | probably_damaging(0.991) | TCGA-AP-A059-01 | Endometrium | uterine corpus endometrioid carcinoma | Female | >=65 | I/II | Unknown | Unknown | SD | |
| DLK2 | SNV | Missense_Mutation | rs146272567 | c.656G>A | p.Arg219His | p.R219H | Q6UY11 | protein_coding | tolerated(0.35) | benign(0.003) | TCGA-AP-A0L8-01 | Endometrium | uterine corpus endometrioid carcinoma | Female | >=65 | III/IV | Unknown | Unknown | PD |
| Page: 1 2 3 4 |
Top |
Related drugs of malignant transformation related genes |
| Identification of chemicals and drugs interact with genes involved in malignant transfromation |
| (DGIdb 4.0) |
| Entrez ID | Symbol | Category | Interaction Types | Drug Claim Name | Drug Name | PMIDs |
| Page: 1 |

Copyright 2023-Present -The University of Texas Health Science Center at Houston |