
|
|||||
|
 | |
| |
| |
| |
| |
| |
|
Gene: DLGAP4 |
Gene summary for DLGAP4 |
| Gene information | Species | Human | Gene symbol | DLGAP4 | Gene ID | 22839 |
| Gene name | DLG associated protein 4 | |
| Gene Alias | DAP-4 | |
| Cytomap | 20q11.23 | |
| Gene Type | protein-coding | GO ID | GO:0003008 | UniProtAcc | A0A0B4J2C2 |
Top |
Malignant transformation analysis |
| Identification of the aberrant gene expression in precancerous and cancerous lesions by comparing the gene expression of stem-like cells in diseased tissues with normal stem cells |
| Entrez ID | Symbol | Replicates | Species | Organ | Tissue | Adj P-value | Log2FC | Malignancy |
| 22839 | DLGAP4 | HTA11_1938_2000001011 | Human | Colorectum | AD | 4.90e-03 | 3.48e-01 | -0.0811 |
| 22839 | DLGAP4 | HTA11_696_2000001011 | Human | Colorectum | AD | 8.32e-10 | 5.04e-01 | -0.1464 |
| 22839 | DLGAP4 | HTA11_866_2000001011 | Human | Colorectum | AD | 1.06e-05 | 3.58e-01 | -0.1001 |
| 22839 | DLGAP4 | HTA11_1391_2000001011 | Human | Colorectum | AD | 4.63e-06 | 4.48e-01 | -0.059 |
| 22839 | DLGAP4 | HTA11_866_3004761011 | Human | Colorectum | AD | 1.01e-03 | 3.64e-01 | 0.096 |
| 22839 | DLGAP4 | HTA11_6818_2000001021 | Human | Colorectum | AD | 6.38e-04 | 4.82e-01 | 0.0588 |
| 22839 | DLGAP4 | HTA11_99999971662_82457 | Human | Colorectum | MSS | 6.93e-25 | 9.98e-01 | 0.3859 |
| 22839 | DLGAP4 | HTA11_99999973899_84307 | Human | Colorectum | MSS | 2.97e-10 | 7.95e-01 | 0.2585 |
| 22839 | DLGAP4 | HTA11_99999974143_84620 | Human | Colorectum | MSS | 1.37e-11 | 5.95e-01 | 0.3005 |
| 22839 | DLGAP4 | A015-C-203 | Human | Colorectum | FAP | 3.81e-05 | -7.83e-02 | -0.1294 |
| 22839 | DLGAP4 | A002-C-205 | Human | Colorectum | FAP | 1.06e-03 | -1.41e-01 | -0.1236 |
| 22839 | DLGAP4 | A015-C-006 | Human | Colorectum | FAP | 4.71e-02 | -2.20e-02 | -0.0994 |
| 22839 | DLGAP4 | A015-C-104 | Human | Colorectum | FAP | 2.62e-06 | -4.60e-02 | -0.1899 |
| 22839 | DLGAP4 | A002-C-016 | Human | Colorectum | FAP | 4.46e-03 | -8.16e-02 | 0.0521 |
| 22839 | DLGAP4 | A002-C-116 | Human | Colorectum | FAP | 1.35e-06 | -1.39e-01 | -0.0452 |
| 22839 | DLGAP4 | A018-E-020 | Human | Colorectum | FAP | 1.17e-02 | -1.07e-01 | -0.2034 |
| 22839 | DLGAP4 | CRC-3-11773 | Human | Colorectum | CRC | 3.41e-06 | 4.53e-01 | 0.2564 |
| 22839 | DLGAP4 | LZE4T | Human | Esophagus | ESCC | 6.28e-10 | 3.20e-01 | 0.0811 |
| 22839 | DLGAP4 | LZE5T | Human | Esophagus | ESCC | 4.29e-03 | 2.13e-01 | 0.0514 |
| 22839 | DLGAP4 | LZE7T | Human | Esophagus | ESCC | 6.55e-09 | 3.66e-01 | 0.0667 |
| Page: 1 2 3 4 5 6 7 |
| Tissue | Expression Dynamics | Abbreviation |
| Colorectum (GSE201348) |  | FAP: Familial adenomatous polyposis |
| CRC: Colorectal cancer | ||
| Colorectum (HTA11) |  | AD: Adenomas |
| SER: Sessile serrated lesions | ||
| MSI-H: Microsatellite-high colorectal cancer | ||
| MSS: Microsatellite stable colorectal cancer | ||
| Esophagus |  | ESCC: Esophageal squamous cell carcinoma |
| HGIN: High-grade intraepithelial neoplasias | ||
| LGIN: Low-grade intraepithelial neoplasias | ||
| Liver |  | HCC: Hepatocellular carcinoma |
| NAFLD: Non-alcoholic fatty liver disease | ||
| Lung | 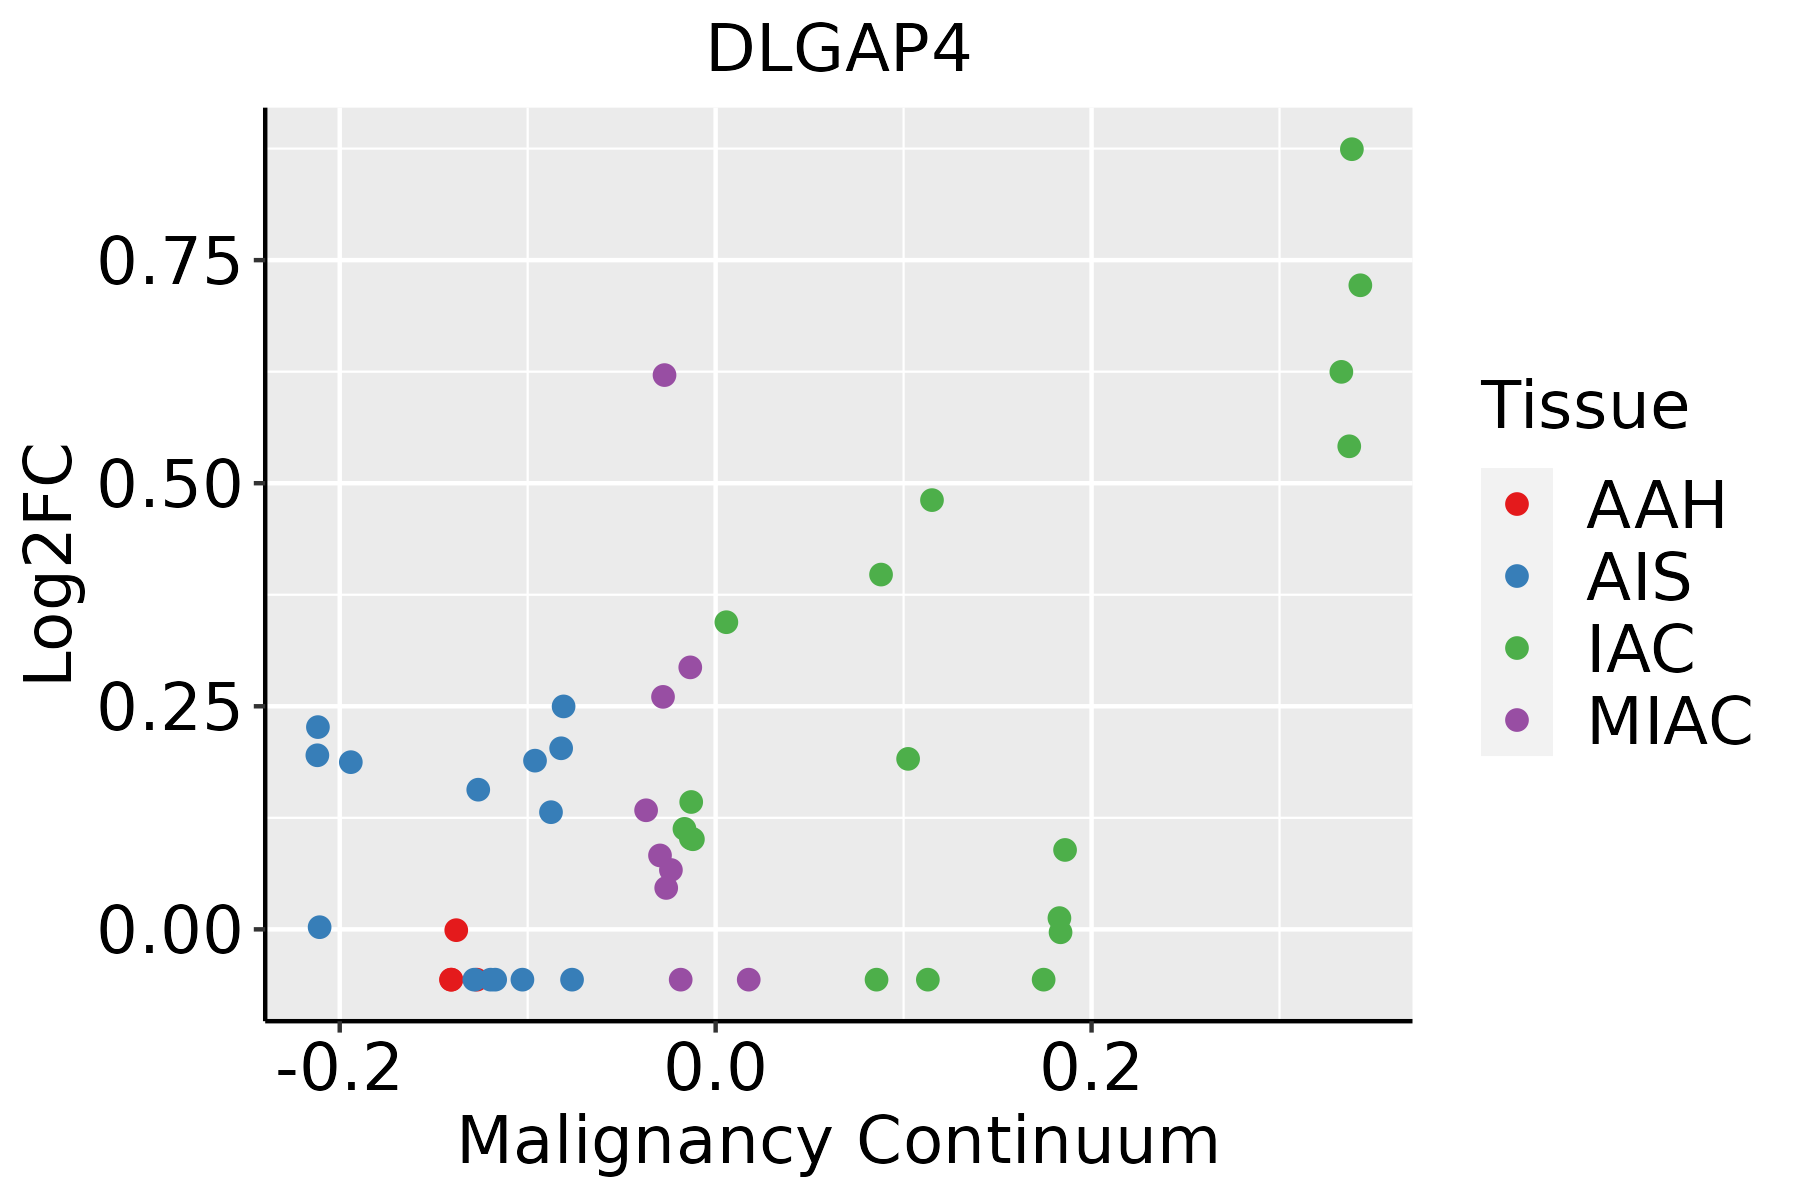 | AAH: Atypical adenomatous hyperplasia |
| AIS: Adenocarcinoma in situ | ||
| IAC: Invasive lung adenocarcinoma | ||
| MIA: Minimally invasive adenocarcinoma | ||
| Oral Cavity |  | EOLP: Erosive Oral lichen planus |
| LP: leukoplakia | ||
| NEOLP: Non-erosive oral lichen planus | ||
| OSCC: Oral squamous cell carcinoma | ||
| Thyroid | 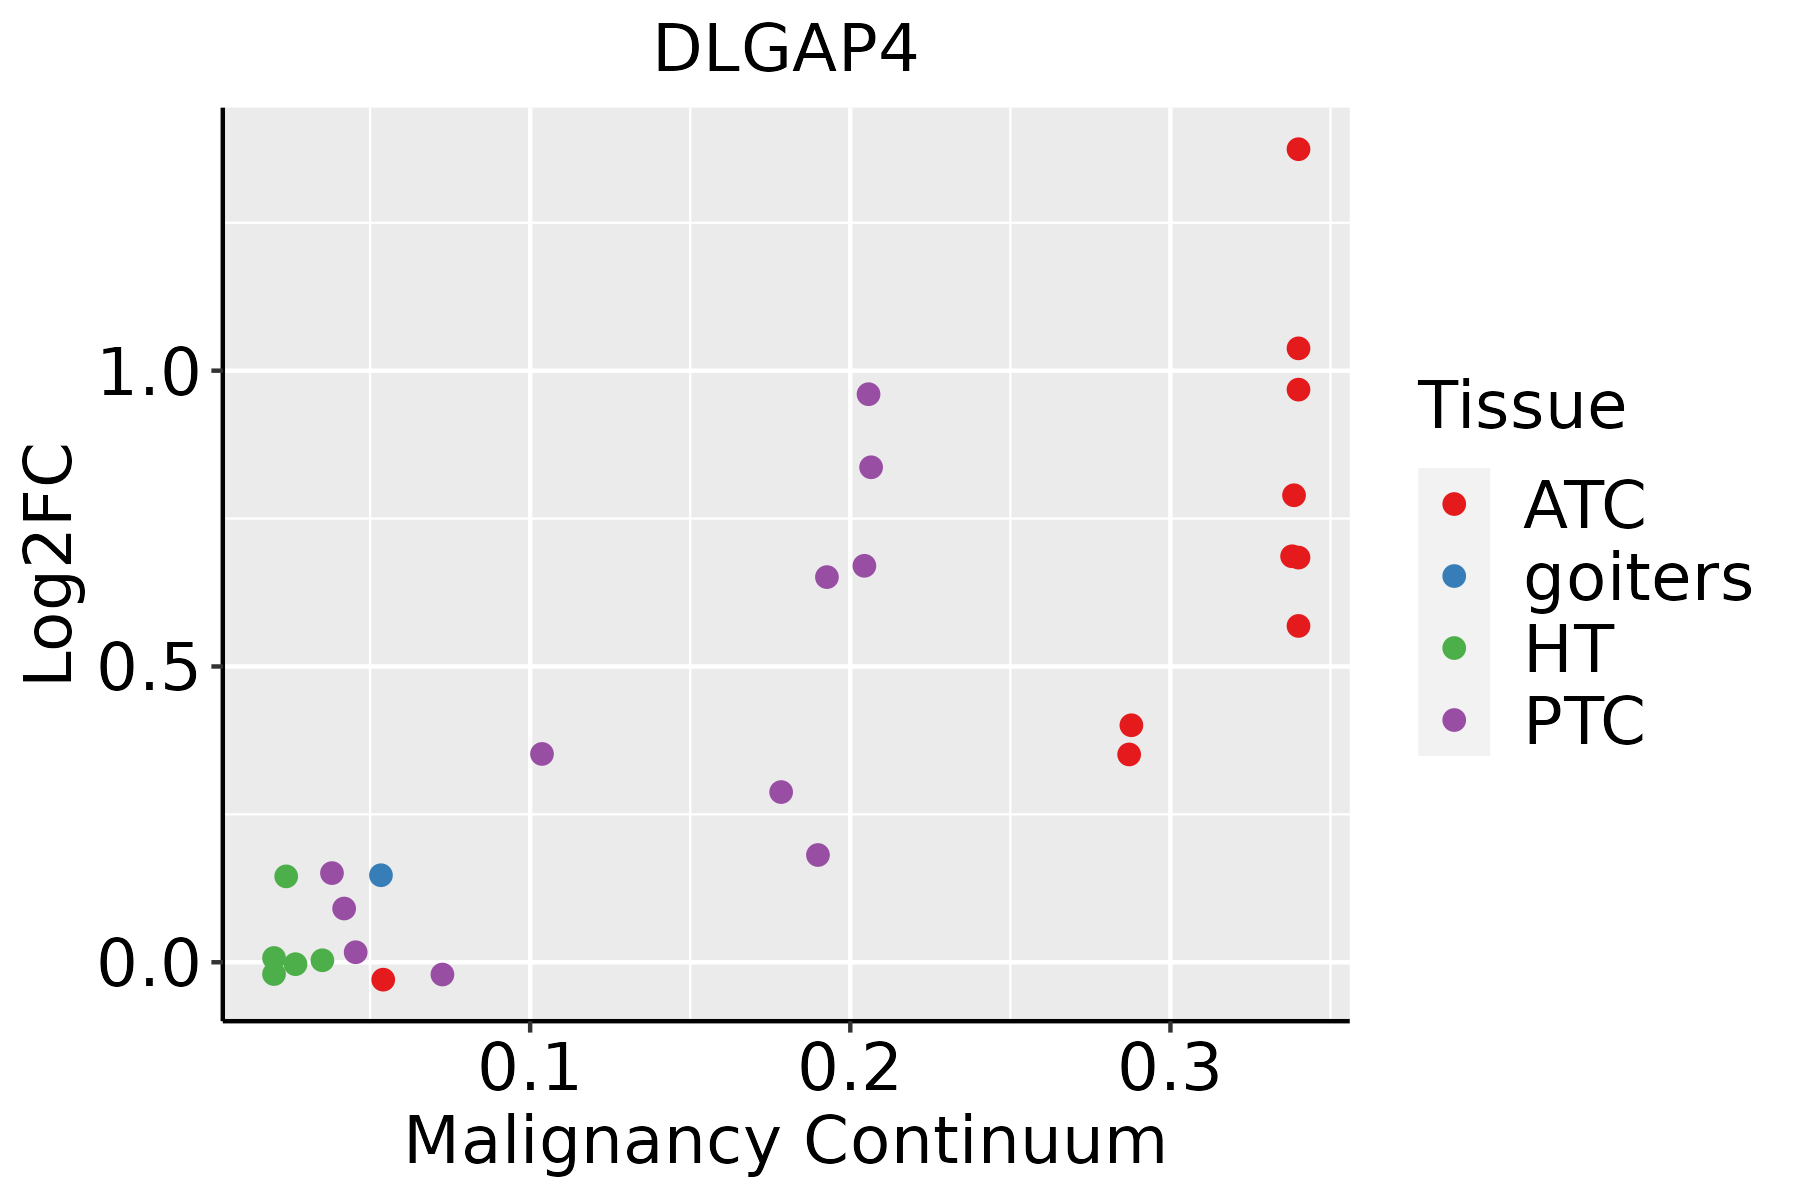 | ATC: Anaplastic thyroid cancer |
| HT: Hashimoto's thyroiditis | ||
| PTC: Papillary thyroid cancer |
| ∗log2FC in expression of this searched gene in stem-like cells from each diseased tissue sample relative to stem-like cells in normal samples in each tissue plotted against the malignancy continuum. Samples are colored based on if they are from different disease stage. |
Top |
Malignant transformation related pathway analysis |
| Find out the enriched GO biological processes and KEGG pathways involved in transition from healthy to precancer to cancer |
| Tissue | Disease Stage | Enriched GO biological Processes |
| Colorectum | AD |  |
| Colorectum | SER |  |
| Colorectum | MSS |  |
| Colorectum | MSI-H |  |
| Colorectum | FAP |  |
| ∗Top 15 enriched GO BP terms are showed in the bar plot of each disease state in each tissue. Each row represents a significant GO biological process which is colored according to the -log10(p.adjust). |
| Page: 1 2 3 4 5 6 7 8 9 |
| GO ID | Tissue | Disease Stage | Description | Gene Ratio | Bg Ratio | pvalue | p.adjust | Count |
| GO:0050804 | Colorectum | CRC | modulation of chemical synaptic transmission | 70/2078 | 439/18723 | 1.15e-03 | 1.33e-02 | 70 |
| GO:0099177 | Colorectum | CRC | regulation of trans-synaptic signaling | 70/2078 | 440/18723 | 1.23e-03 | 1.38e-02 | 70 |
| Page: 1 |
| Pathway ID | Tissue | Disease Stage | Description | Gene Ratio | Bg Ratio | pvalue | p.adjust | qvalue | Count |
| Page: 1 |
Top |
Cell-cell communication analysis |
| Identification of potential cell-cell interactions between two cell types and their ligand-receptor pairs for different disease states |
| Ligand | Receptor | LRpair | Pathway | Tissue | Disease Stage |
| Page: 1 |
Top |
Single-cell gene regulatory network inference analysis |
| Find out the significant the regulons (TFs) and the target genes of each regulon across cell types for different disease states |
| TF | Cell Type | Tissue | Disease Stage | Target Gene | RSS | Regulon Activity |
| ∗The dot plots of a searched regulon are shown for all cell subpopulations in each disease state of each tissue based on the regulon specific score inferred using pySCENIC and by calculating the average expression. |
| Page: 1 |
Top |
Somatic mutation of malignant transformation related genes |
| Annotation of somatic variants for genes involved in malignant transformation |
| Hugo Symbol | Variant Class | Variant Classification | dbSNP RS | HGVSc | HGVSp | HGVSp Short | SWISSPROT | BIOTYPE | SIFT | PolyPhen | Tumor Sample Barcode | Tissue | Histology | Sex | Age | Stage | Therapy Types | Drugs | Outcome |
| DLGAP4 | SNV | Missense_Mutation | rs770783607 | c.2192N>T | p.Pro731Leu | p.P731L | Q9Y2H0 | protein_coding | tolerated(0.14) | benign(0.172) | TCGA-A2-A0YJ-01 | Breast | breast invasive carcinoma | Female | <65 | III/IV | Chemotherapy | cytoxan | PD |
| DLGAP4 | SNV | Missense_Mutation | c.223N>T | p.His75Tyr | p.H75Y | Q9Y2H0 | protein_coding | deleterious(0) | probably_damaging(0.933) | TCGA-A2-A1FV-01 | Breast | breast invasive carcinoma | Female | >=65 | I/II | Chemotherapy | cyclophosphamide | SD | |
| DLGAP4 | SNV | Missense_Mutation | c.2179G>A | p.Glu727Lys | p.E727K | Q9Y2H0 | protein_coding | tolerated(0.07) | benign(0.028) | TCGA-A8-A06Q-01 | Breast | breast invasive carcinoma | Female | <65 | III/IV | Unknown | Unknown | SD | |
| DLGAP4 | SNV | Missense_Mutation | rs767364241 | c.134N>A | p.Arg45His | p.R45H | Q9Y2H0 | protein_coding | tolerated(0.56) | possibly_damaging(0.578) | TCGA-A8-A07O-01 | Breast | breast invasive carcinoma | Female | <65 | I/II | Chemotherapy | CR | |
| DLGAP4 | SNV | Missense_Mutation | c.2509N>C | p.Gly837Arg | p.G837R | Q9Y2H0 | protein_coding | deleterious(0) | probably_damaging(0.999) | TCGA-A8-A09A-01 | Breast | breast invasive carcinoma | Female | <65 | I/II | Hormone Therapy | tamoxiphen | SD | |
| DLGAP4 | SNV | Missense_Mutation | c.2926G>A | p.Asp976Asn | p.D976N | Q9Y2H0 | protein_coding | deleterious(0) | probably_damaging(0.994) | TCGA-A8-A09N-01 | Breast | breast invasive carcinoma | Female | <65 | III/IV | Unknown | Unknown | SD | |
| DLGAP4 | SNV | Missense_Mutation | novel | c.2629G>A | p.Asp877Asn | p.D877N | Q9Y2H0 | protein_coding | deleterious(0) | probably_damaging(0.999) | TCGA-AC-A23H-01 | Breast | breast invasive carcinoma | Female | >=65 | I/II | Unknown | Unknown | PD |
| DLGAP4 | SNV | Missense_Mutation | rs769094888 | c.2614N>T | p.Arg872Cys | p.R872C | Q9Y2H0 | protein_coding | deleterious(0.03) | benign(0.171) | TCGA-AN-A046-01 | Breast | breast invasive carcinoma | Female | >=65 | I/II | Unknown | Unknown | SD |
| DLGAP4 | SNV | Missense_Mutation | c.1088N>A | p.Arg363His | p.R363H | Q9Y2H0 | protein_coding | deleterious(0.03) | benign(0.017) | TCGA-E2-A15R-01 | Breast | breast invasive carcinoma | Female | <65 | I/II | Chemotherapy | cyclophosphamide | SD | |
| DLGAP4 | SNV | Missense_Mutation | rs776984875 | c.347G>A | p.Arg116His | p.R116H | Q9Y2H0 | protein_coding | tolerated(0.06) | benign(0.336) | TCGA-EW-A1OY-01 | Breast | breast invasive carcinoma | Female | <65 | I/II | Chemotherapy | doxorubicin | SD |
| Page: 1 2 3 4 5 6 7 8 9 10 11 12 |
Top |
Related drugs of malignant transformation related genes |
| Identification of chemicals and drugs interact with genes involved in malignant transfromation |
| (DGIdb 4.0) |
| Entrez ID | Symbol | Category | Interaction Types | Drug Claim Name | Drug Name | PMIDs |
| Page: 1 |

Copyright 2023-Present -The University of Texas Health Science Center at Houston |