
|
|||||
|
 | |
| |
| |
| |
| |
| |
|
Gene: DLGAP1 |
Gene summary for DLGAP1 |
| Gene information | Species | Human | Gene symbol | DLGAP1 | Gene ID | 9229 |
| Gene name | DLG associated protein 1 | |
| Gene Alias | DAP-1 | |
| Cytomap | 18p11.31 | |
| Gene Type | protein-coding | GO ID | GO:0003008 | UniProtAcc | O14490 |
Top |
Malignant transformation analysis |
| Identification of the aberrant gene expression in precancerous and cancerous lesions by comparing the gene expression of stem-like cells in diseased tissues with normal stem cells |
| Entrez ID | Symbol | Replicates | Species | Organ | Tissue | Adj P-value | Log2FC | Malignancy |
| 9229 | DLGAP1 | AEH-subject5 | Human | Endometrium | AEH | 2.67e-02 | 2.88e-01 | -0.2953 |
| 9229 | DLGAP1 | EEC-subject1 | Human | Endometrium | EEC | 1.85e-06 | 3.16e-01 | -0.2682 |
| 9229 | DLGAP1 | EEC-subject3 | Human | Endometrium | EEC | 2.17e-04 | 3.12e-01 | -0.2525 |
| 9229 | DLGAP1 | EEC-subject5 | Human | Endometrium | EEC | 1.42e-03 | 2.64e-01 | -0.249 |
| 9229 | DLGAP1 | LZE7T | Human | Esophagus | ESCC | 1.02e-03 | 1.88e-01 | 0.0667 |
| 9229 | DLGAP1 | P2T-E | Human | Esophagus | ESCC | 2.13e-23 | 5.08e-01 | 0.1177 |
| 9229 | DLGAP1 | P5T-E | Human | Esophagus | ESCC | 8.06e-15 | 3.58e-01 | 0.1327 |
| 9229 | DLGAP1 | P10T-E | Human | Esophagus | ESCC | 1.74e-13 | 2.08e-01 | 0.116 |
| 9229 | DLGAP1 | P12T-E | Human | Esophagus | ESCC | 1.21e-03 | 1.53e-01 | 0.1122 |
| 9229 | DLGAP1 | P16T-E | Human | Esophagus | ESCC | 4.10e-10 | 2.44e-01 | 0.1153 |
| 9229 | DLGAP1 | P22T-E | Human | Esophagus | ESCC | 2.13e-04 | 6.94e-02 | 0.1236 |
| 9229 | DLGAP1 | P23T-E | Human | Esophagus | ESCC | 1.14e-03 | 1.42e-01 | 0.108 |
| 9229 | DLGAP1 | P26T-E | Human | Esophagus | ESCC | 2.96e-24 | 5.27e-01 | 0.1276 |
| 9229 | DLGAP1 | P27T-E | Human | Esophagus | ESCC | 8.54e-66 | 1.06e+00 | 0.1055 |
| 9229 | DLGAP1 | P32T-E | Human | Esophagus | ESCC | 1.25e-10 | 3.00e-01 | 0.1666 |
| 9229 | DLGAP1 | P37T-E | Human | Esophagus | ESCC | 3.53e-03 | 1.12e-01 | 0.1371 |
| 9229 | DLGAP1 | P39T-E | Human | Esophagus | ESCC | 6.38e-08 | 2.00e-01 | 0.0894 |
| 9229 | DLGAP1 | P42T-E | Human | Esophagus | ESCC | 9.05e-04 | 1.79e-01 | 0.1175 |
| 9229 | DLGAP1 | P54T-E | Human | Esophagus | ESCC | 6.60e-44 | 1.19e+00 | 0.0975 |
| 9229 | DLGAP1 | P57T-E | Human | Esophagus | ESCC | 8.15e-09 | 2.67e-01 | 0.0926 |
| Page: 1 2 |
| Tissue | Expression Dynamics | Abbreviation |
| Endometrium |  | AEH: Atypical endometrial hyperplasia |
| EEC: Endometrioid Cancer | ||
| Esophagus | 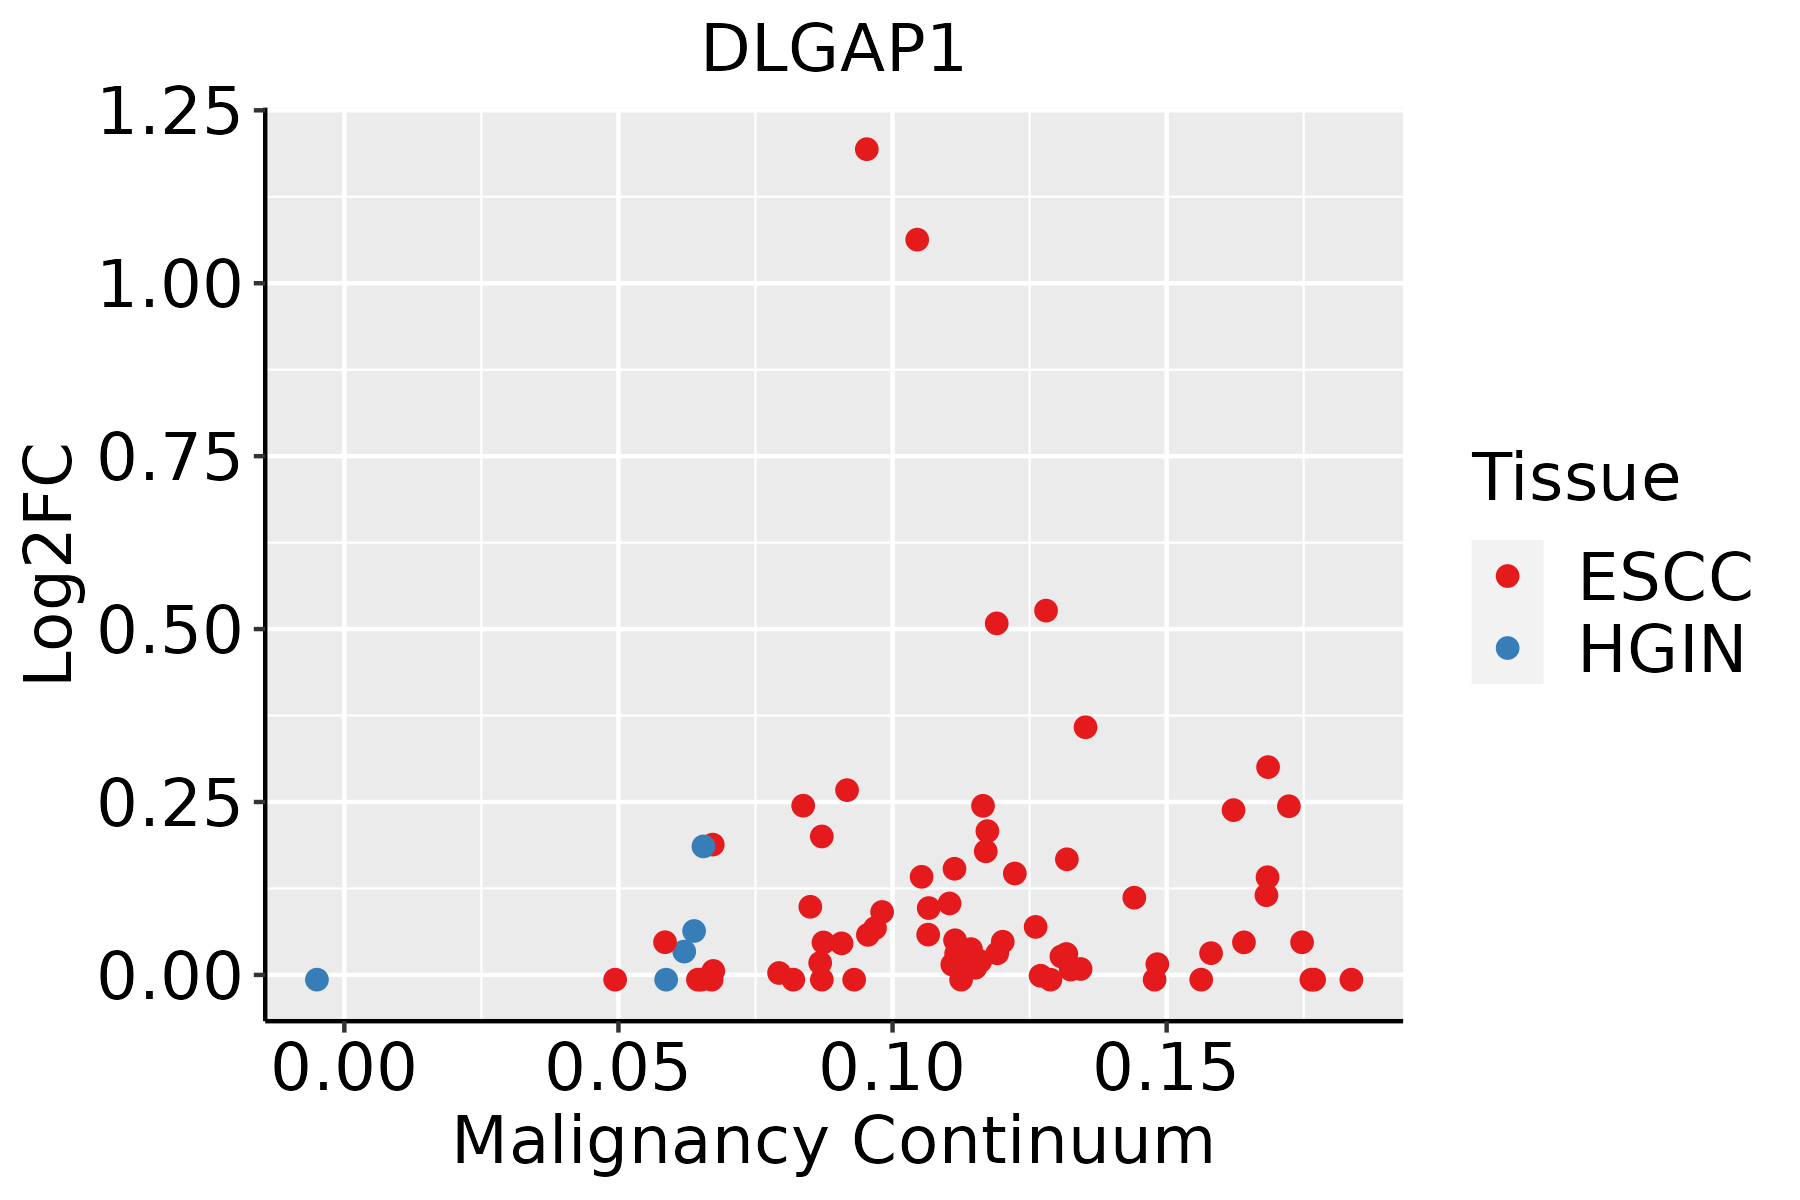 | ESCC: Esophageal squamous cell carcinoma |
| HGIN: High-grade intraepithelial neoplasias | ||
| LGIN: Low-grade intraepithelial neoplasias | ||
| Lung | 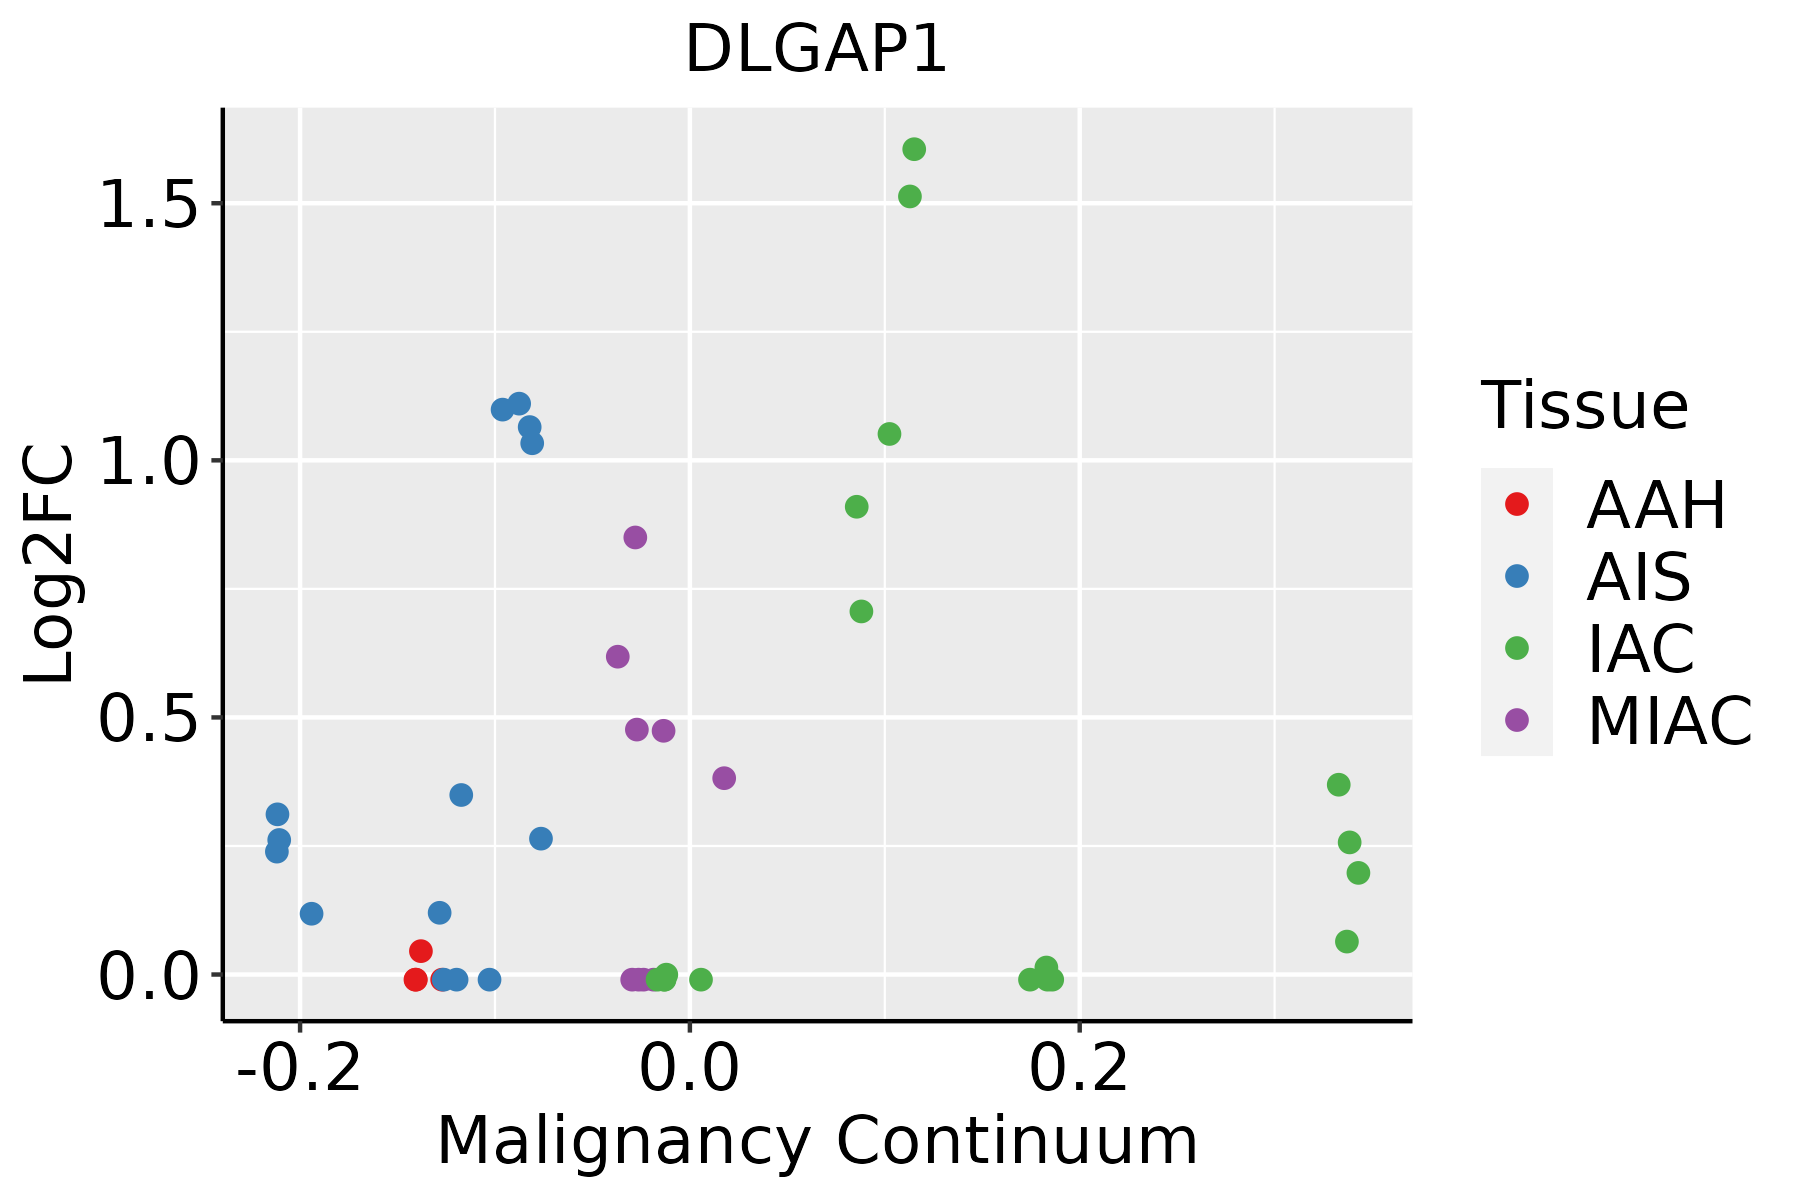 | AAH: Atypical adenomatous hyperplasia |
| AIS: Adenocarcinoma in situ | ||
| IAC: Invasive lung adenocarcinoma | ||
| MIA: Minimally invasive adenocarcinoma |
| ∗log2FC in expression of this searched gene in stem-like cells from each diseased tissue sample relative to stem-like cells in normal samples in each tissue plotted against the malignancy continuum. Samples are colored based on if they are from different disease stage. |
Top |
Malignant transformation related pathway analysis |
| Find out the enriched GO biological processes and KEGG pathways involved in transition from healthy to precancer to cancer |
| Tissue | Disease Stage | Enriched GO biological Processes |
| Colorectum | AD |  |
| Colorectum | SER |  |
| Colorectum | MSS |  |
| Colorectum | MSI-H |  |
| Colorectum | FAP |  |
| ∗Top 15 enriched GO BP terms are showed in the bar plot of each disease state in each tissue. Each row represents a significant GO biological process which is colored according to the -log10(p.adjust). |
| Page: 1 2 3 4 5 6 7 8 9 |
| GO ID | Tissue | Disease Stage | Description | Gene Ratio | Bg Ratio | pvalue | p.adjust | Count |
| Page: 1 |
| Pathway ID | Tissue | Disease Stage | Description | Gene Ratio | Bg Ratio | pvalue | p.adjust | qvalue | Count |
| Page: 1 |
Top |
Cell-cell communication analysis |
| Identification of potential cell-cell interactions between two cell types and their ligand-receptor pairs for different disease states |
| Ligand | Receptor | LRpair | Pathway | Tissue | Disease Stage |
| Page: 1 |
Top |
Single-cell gene regulatory network inference analysis |
| Find out the significant the regulons (TFs) and the target genes of each regulon across cell types for different disease states |
| TF | Cell Type | Tissue | Disease Stage | Target Gene | RSS | Regulon Activity |
| ∗The dot plots of a searched regulon are shown for all cell subpopulations in each disease state of each tissue based on the regulon specific score inferred using pySCENIC and by calculating the average expression. |
| Page: 1 |
Top |
Somatic mutation of malignant transformation related genes |
| Annotation of somatic variants for genes involved in malignant transformation |
| Hugo Symbol | Variant Class | Variant Classification | dbSNP RS | HGVSc | HGVSp | HGVSp Short | SWISSPROT | BIOTYPE | SIFT | PolyPhen | Tumor Sample Barcode | Tissue | Histology | Sex | Age | Stage | Therapy Types | Drugs | Outcome |
| DLGAP1 | SNV | Missense_Mutation | novel | c.920N>G | p.Glu307Gly | p.E307G | O14490 | protein_coding | deleterious(0.02) | benign(0.179) | TCGA-A8-A09Z-01 | Breast | breast invasive carcinoma | Female | >=65 | I/II | Unknown | Unknown | SD |
| DLGAP1 | SNV | Missense_Mutation | novel | c.268C>T | p.Arg90Cys | p.R90C | O14490 | protein_coding | deleterious(0.04) | benign(0.298) | TCGA-AC-A5EH-01 | Breast | breast invasive carcinoma | Female | >=65 | I/II | Unknown | Unknown | SD |
| DLGAP1 | SNV | Missense_Mutation | novel | c.2052N>T | p.Glu684Asp | p.E684D | O14490 | protein_coding | tolerated(0.5) | benign(0.05) | TCGA-AN-A046-01 | Breast | breast invasive carcinoma | Female | >=65 | I/II | Unknown | Unknown | SD |
| DLGAP1 | SNV | Missense_Mutation | c.2444A>C | p.Glu815Ala | p.E815A | O14490 | protein_coding | deleterious(0) | possibly_damaging(0.595) | TCGA-AN-A04D-01 | Breast | breast invasive carcinoma | Female | <65 | I/II | Unknown | Unknown | SD | |
| DLGAP1 | SNV | Missense_Mutation | novel | c.1355N>T | p.Ser452Ile | p.S452I | O14490 | protein_coding | deleterious(0) | benign(0.151) | TCGA-AO-A0J4-01 | Breast | breast invasive carcinoma | Female | <65 | I/II | Chemotherapy | doxorubicin | SD |
| DLGAP1 | SNV | Missense_Mutation | novel | c.2411G>A | p.Arg804Gln | p.R804Q | O14490 | protein_coding | deleterious(0) | benign(0.166) | TCGA-B6-A0I1-01 | Breast | breast invasive carcinoma | Female | >=65 | I/II | Unknown | Unknown | PD |
| DLGAP1 | SNV | Missense_Mutation | c.1987N>T | p.Asp663Tyr | p.D663Y | O14490 | protein_coding | deleterious(0) | benign(0.317) | TCGA-B6-A0I9-01 | Breast | breast invasive carcinoma | Female | <65 | III/IV | Unknown | Unknown | PD | |
| DLGAP1 | SNV | Missense_Mutation | rs199687728 | c.1038N>G | p.Ser346Arg | p.S346R | O14490 | protein_coding | deleterious(0.02) | possibly_damaging(0.609) | TCGA-BH-A0HO-01 | Breast | breast invasive carcinoma | Female | <65 | I/II | Chemotherapy | cyclophosphamide | SD |
| DLGAP1 | SNV | Missense_Mutation | rs199687728 | c.1038T>G | p.Ser346Arg | p.S346R | O14490 | protein_coding | deleterious(0.02) | possibly_damaging(0.609) | TCGA-BH-A0HU-01 | Breast | breast invasive carcinoma | Female | <65 | I/II | Chemotherapy | docetaxel | SD |
| DLGAP1 | SNV | Missense_Mutation | c.1701G>T | p.Gln567His | p.Q567H | O14490 | protein_coding | tolerated(0.16) | probably_damaging(0.999) | TCGA-D8-A1JK-01 | Breast | breast invasive carcinoma | Female | >=65 | I/II | Unknown | Unknown | SD |
| Page: 1 2 3 4 5 6 7 8 9 10 11 12 13 14 |
Top |
Related drugs of malignant transformation related genes |
| Identification of chemicals and drugs interact with genes involved in malignant transfromation |
| (DGIdb 4.0) |
| Entrez ID | Symbol | Category | Interaction Types | Drug Claim Name | Drug Name | PMIDs |
| Page: 1 |

Copyright 2023-Present -The University of Texas Health Science Center at Houston |