
|
|||||
|
 | |
| |
| |
| |
| |
| |
|
Gene: DLG5 |
Gene summary for DLG5 |
| Gene information | Species | Human | Gene symbol | DLG5 | Gene ID | 9231 |
| Gene name | discs large MAGUK scaffold protein 5 | |
| Gene Alias | LP-DLG | |
| Cytomap | 10q22.3 | |
| Gene Type | protein-coding | GO ID | GO:0001655 | UniProtAcc | Q8TDM6 |
Top |
Malignant transformation analysis |
| Identification of the aberrant gene expression in precancerous and cancerous lesions by comparing the gene expression of stem-like cells in diseased tissues with normal stem cells |
| Entrez ID | Symbol | Replicates | Species | Organ | Tissue | Adj P-value | Log2FC | Malignancy |
| 9231 | DLG5 | GSM4909302 | Human | Breast | IDC | 4.18e-11 | 5.47e-01 | 0.1545 |
| 9231 | DLG5 | GSM4909304 | Human | Breast | IDC | 2.83e-35 | 7.45e-01 | 0.1636 |
| 9231 | DLG5 | GSM4909308 | Human | Breast | IDC | 4.06e-05 | 3.90e-01 | 0.158 |
| 9231 | DLG5 | GSM4909311 | Human | Breast | IDC | 1.03e-08 | 1.91e-02 | 0.1534 |
| 9231 | DLG5 | GSM4909319 | Human | Breast | IDC | 7.13e-17 | 3.01e-01 | 0.1563 |
| 9231 | DLG5 | GSM4909321 | Human | Breast | IDC | 2.12e-02 | -9.39e-03 | 0.1559 |
| 9231 | DLG5 | DCIS2 | Human | Breast | DCIS | 4.03e-73 | 6.10e-01 | 0.0085 |
| 9231 | DLG5 | CA_HPV_1 | Human | Cervix | CC | 9.81e-05 | -1.46e-01 | 0.0264 |
| 9231 | DLG5 | CCI_1 | Human | Cervix | CC | 1.93e-07 | 1.00e+00 | 0.528 |
| 9231 | DLG5 | CCI_2 | Human | Cervix | CC | 9.37e-06 | 8.02e-01 | 0.5249 |
| 9231 | DLG5 | sample3 | Human | Cervix | CC | 4.61e-07 | 2.83e-01 | 0.1387 |
| 9231 | DLG5 | T3 | Human | Cervix | CC | 4.72e-06 | 2.62e-01 | 0.1389 |
| 9231 | DLG5 | LZE5T | Human | Esophagus | ESCC | 1.94e-03 | 2.77e-01 | 0.0514 |
| 9231 | DLG5 | LZE8T | Human | Esophagus | ESCC | 1.23e-03 | 1.15e-01 | 0.067 |
| 9231 | DLG5 | LZE22T | Human | Esophagus | ESCC | 1.24e-05 | 3.30e-01 | 0.068 |
| 9231 | DLG5 | LZE24T | Human | Esophagus | ESCC | 1.24e-09 | 2.38e-01 | 0.0596 |
| 9231 | DLG5 | P1T-E | Human | Esophagus | ESCC | 7.68e-04 | 3.13e-01 | 0.0875 |
| 9231 | DLG5 | P2T-E | Human | Esophagus | ESCC | 1.26e-14 | 2.72e-01 | 0.1177 |
| 9231 | DLG5 | P4T-E | Human | Esophagus | ESCC | 8.98e-09 | 7.10e-02 | 0.1323 |
| 9231 | DLG5 | P5T-E | Human | Esophagus | ESCC | 1.47e-11 | 8.32e-02 | 0.1327 |
| Page: 1 2 3 4 5 6 7 |
| Tissue | Expression Dynamics | Abbreviation |
| Breast | 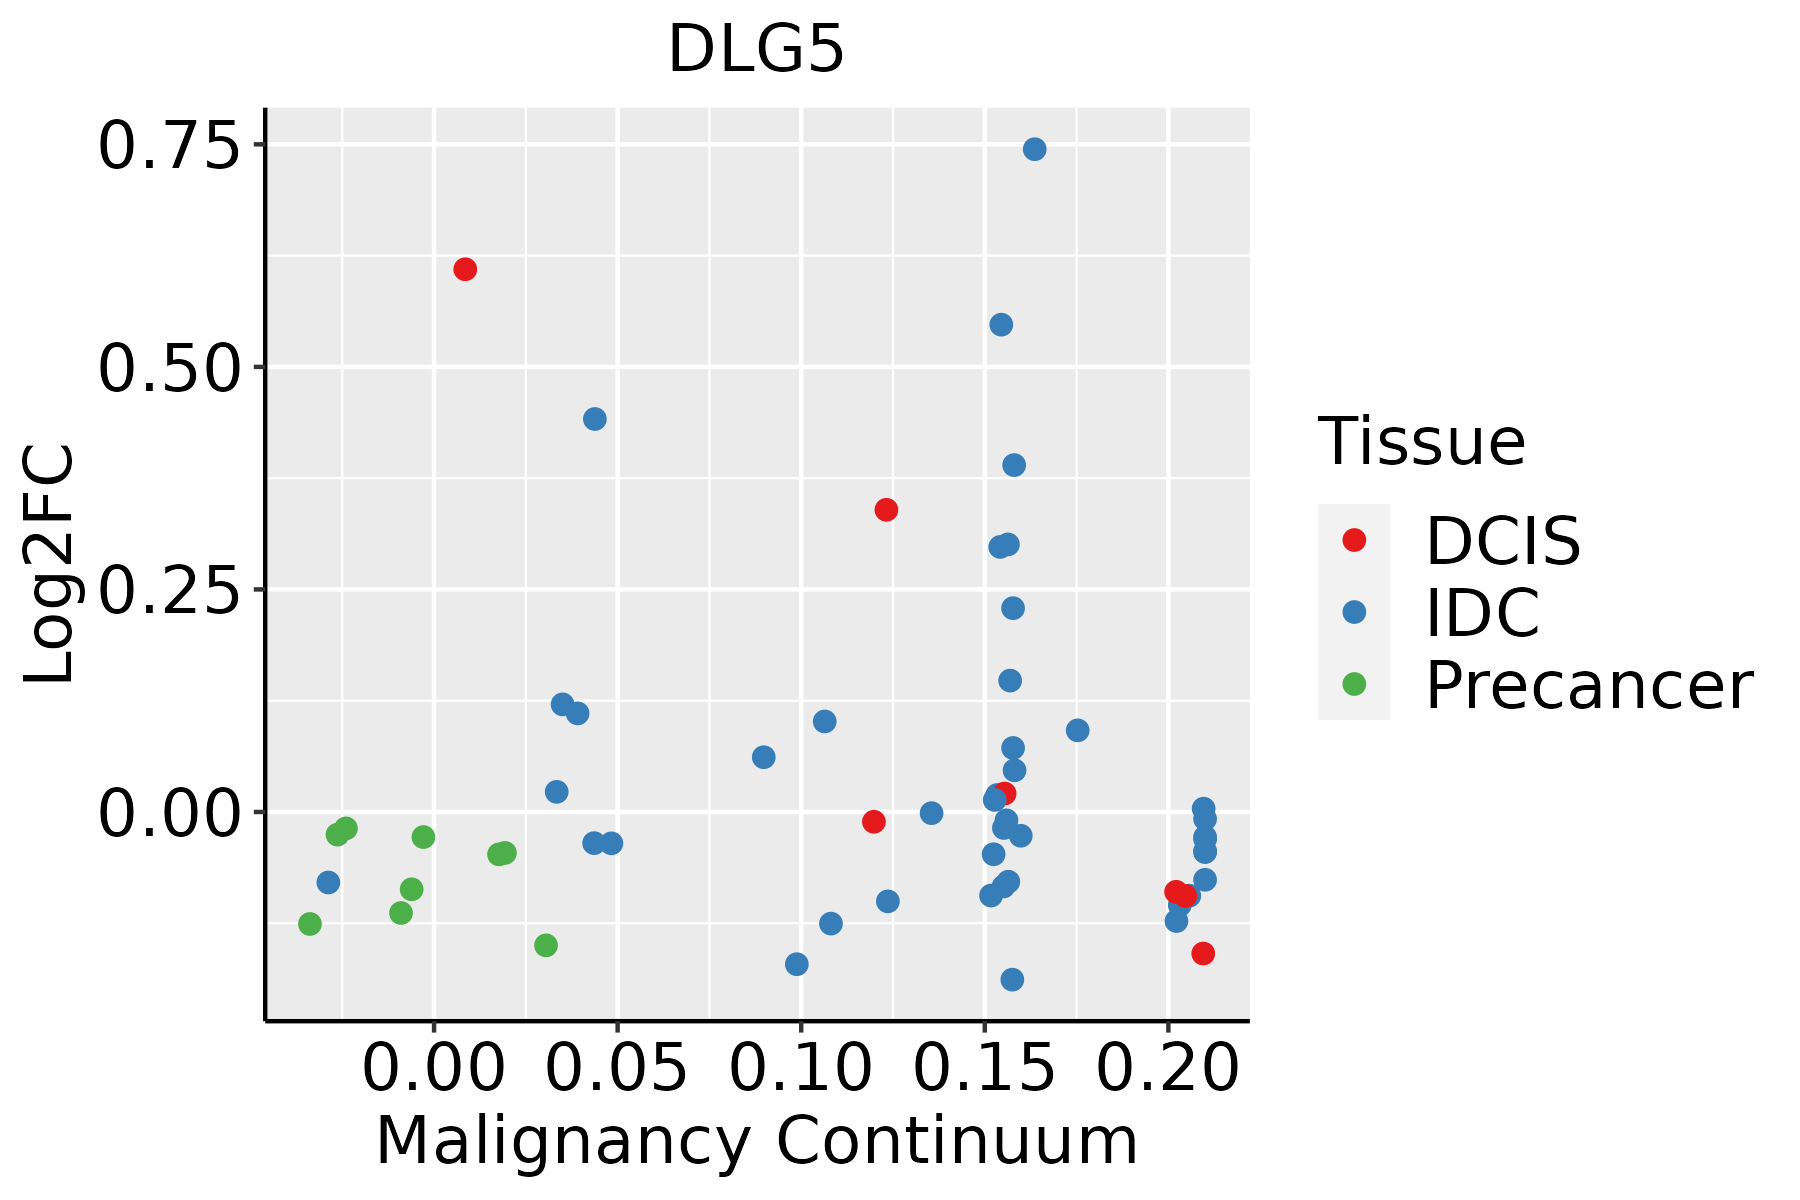 | IDC: Invasive ductal carcinoma |
| DCIS: Ductal carcinoma in situ | ||
| Precancer(BRCA1-mut): Precancerous lesion from BRCA1 mutation carriers | ||
| Cervix | 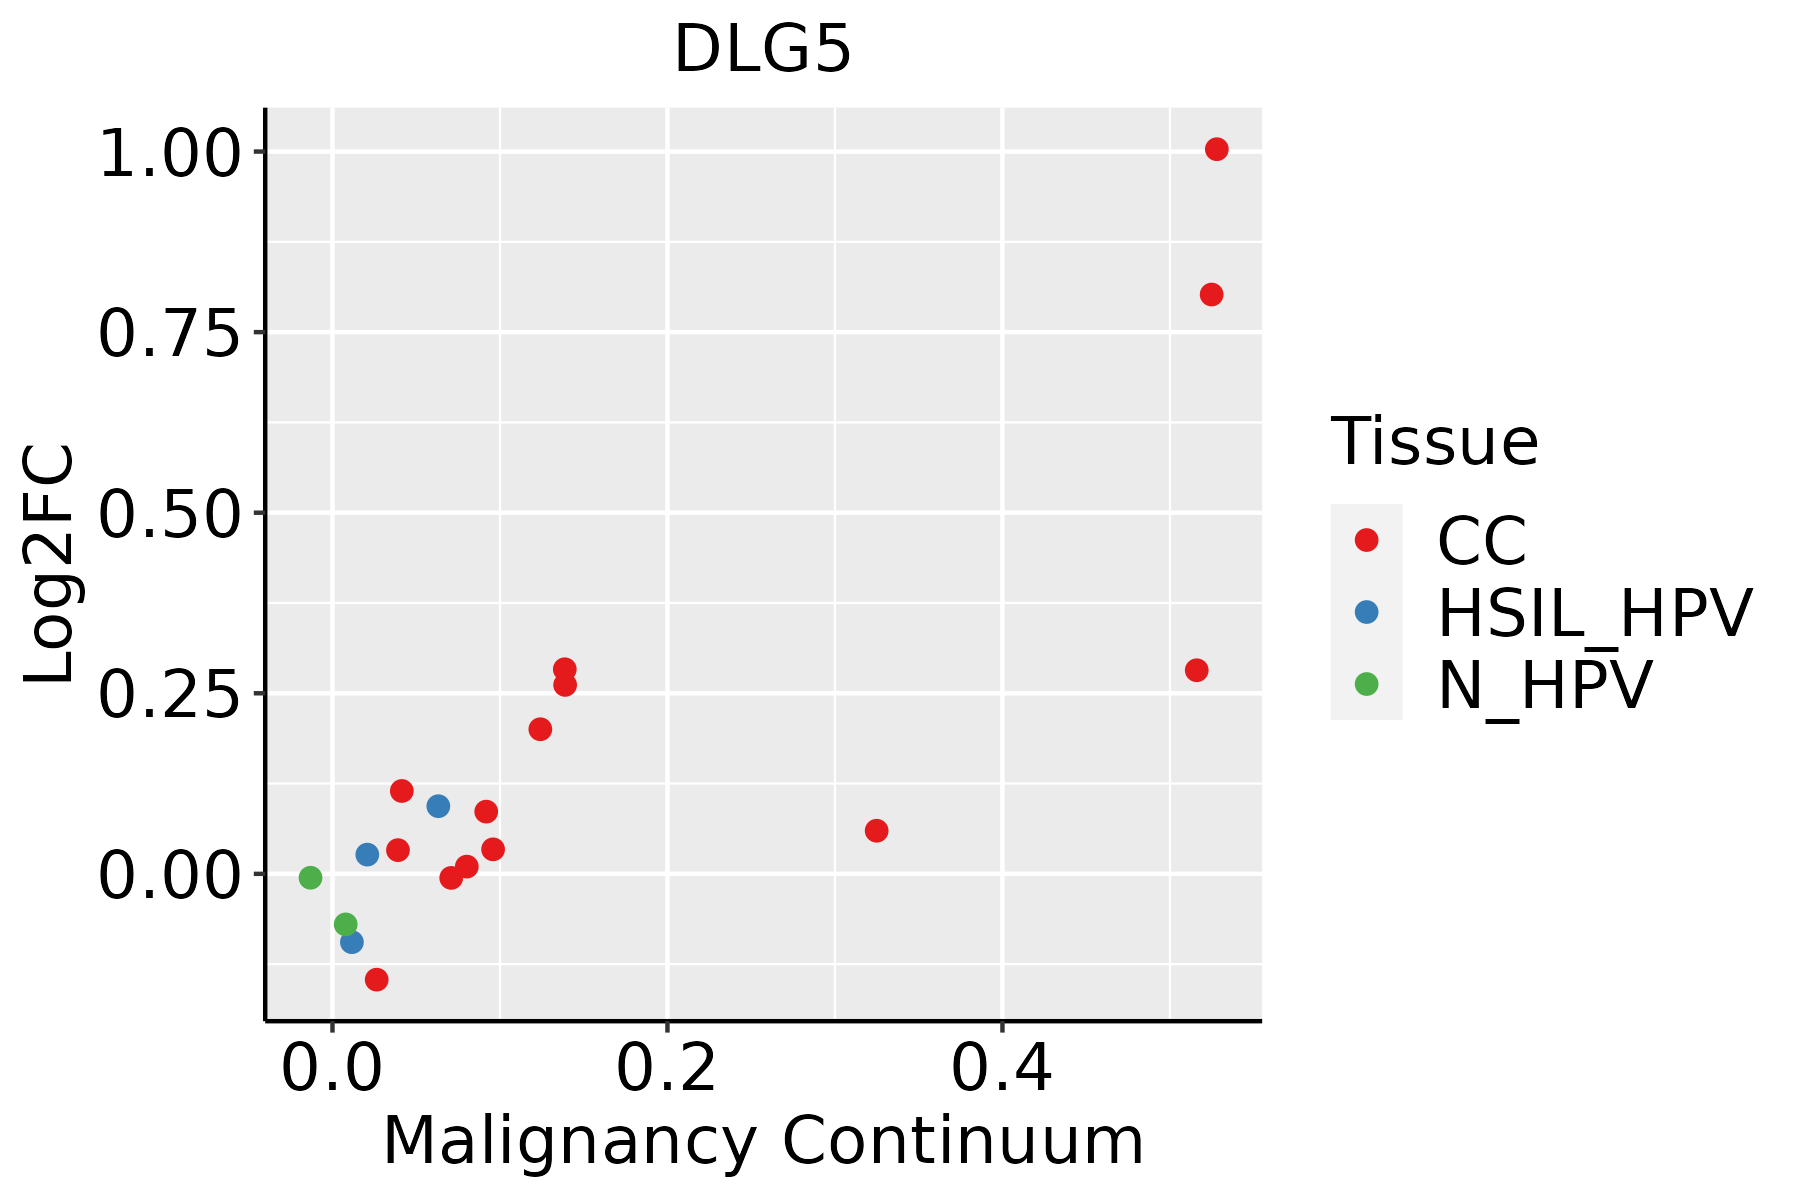 | CC: Cervix cancer |
| HSIL_HPV: HPV-infected high-grade squamous intraepithelial lesions | ||
| N_HPV: HPV-infected normal cervix | ||
| Esophagus | 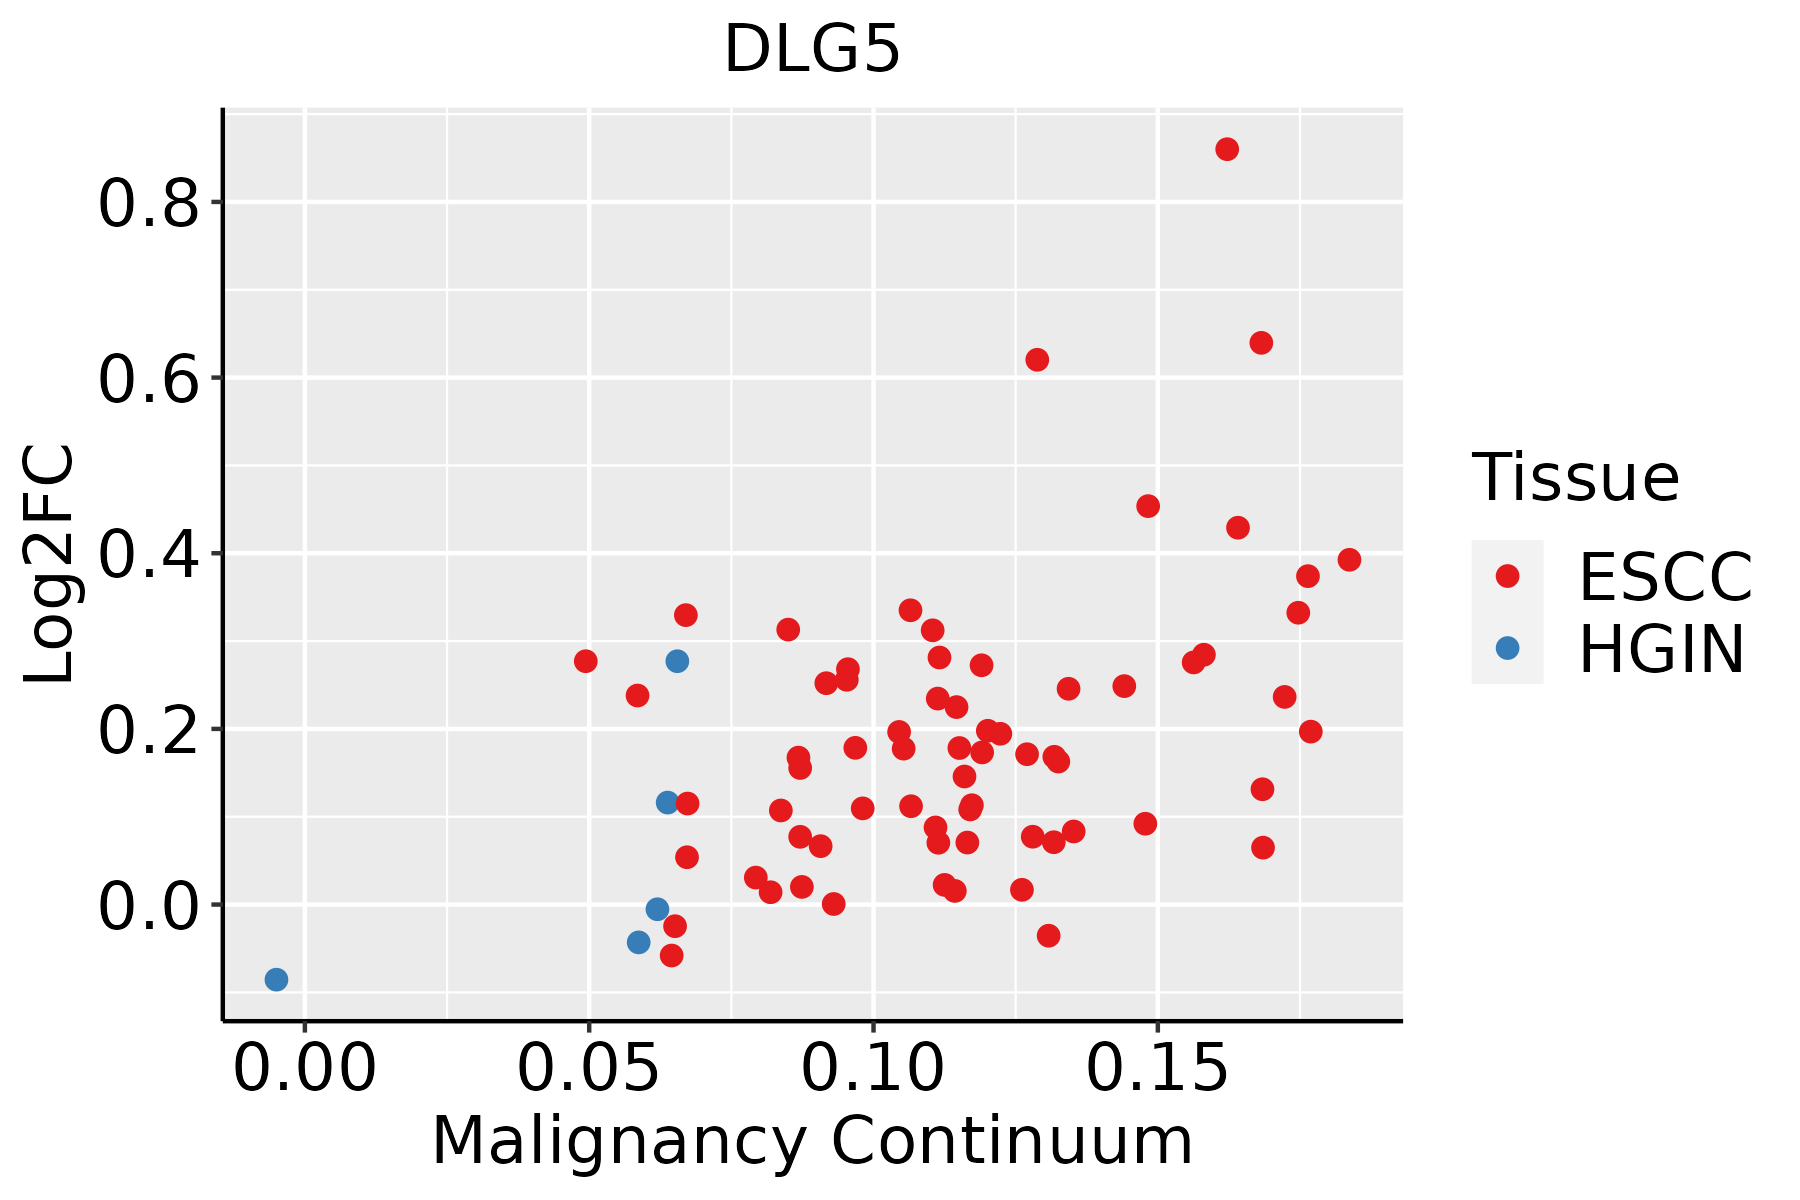 | ESCC: Esophageal squamous cell carcinoma |
| HGIN: High-grade intraepithelial neoplasias | ||
| LGIN: Low-grade intraepithelial neoplasias | ||
| Liver | 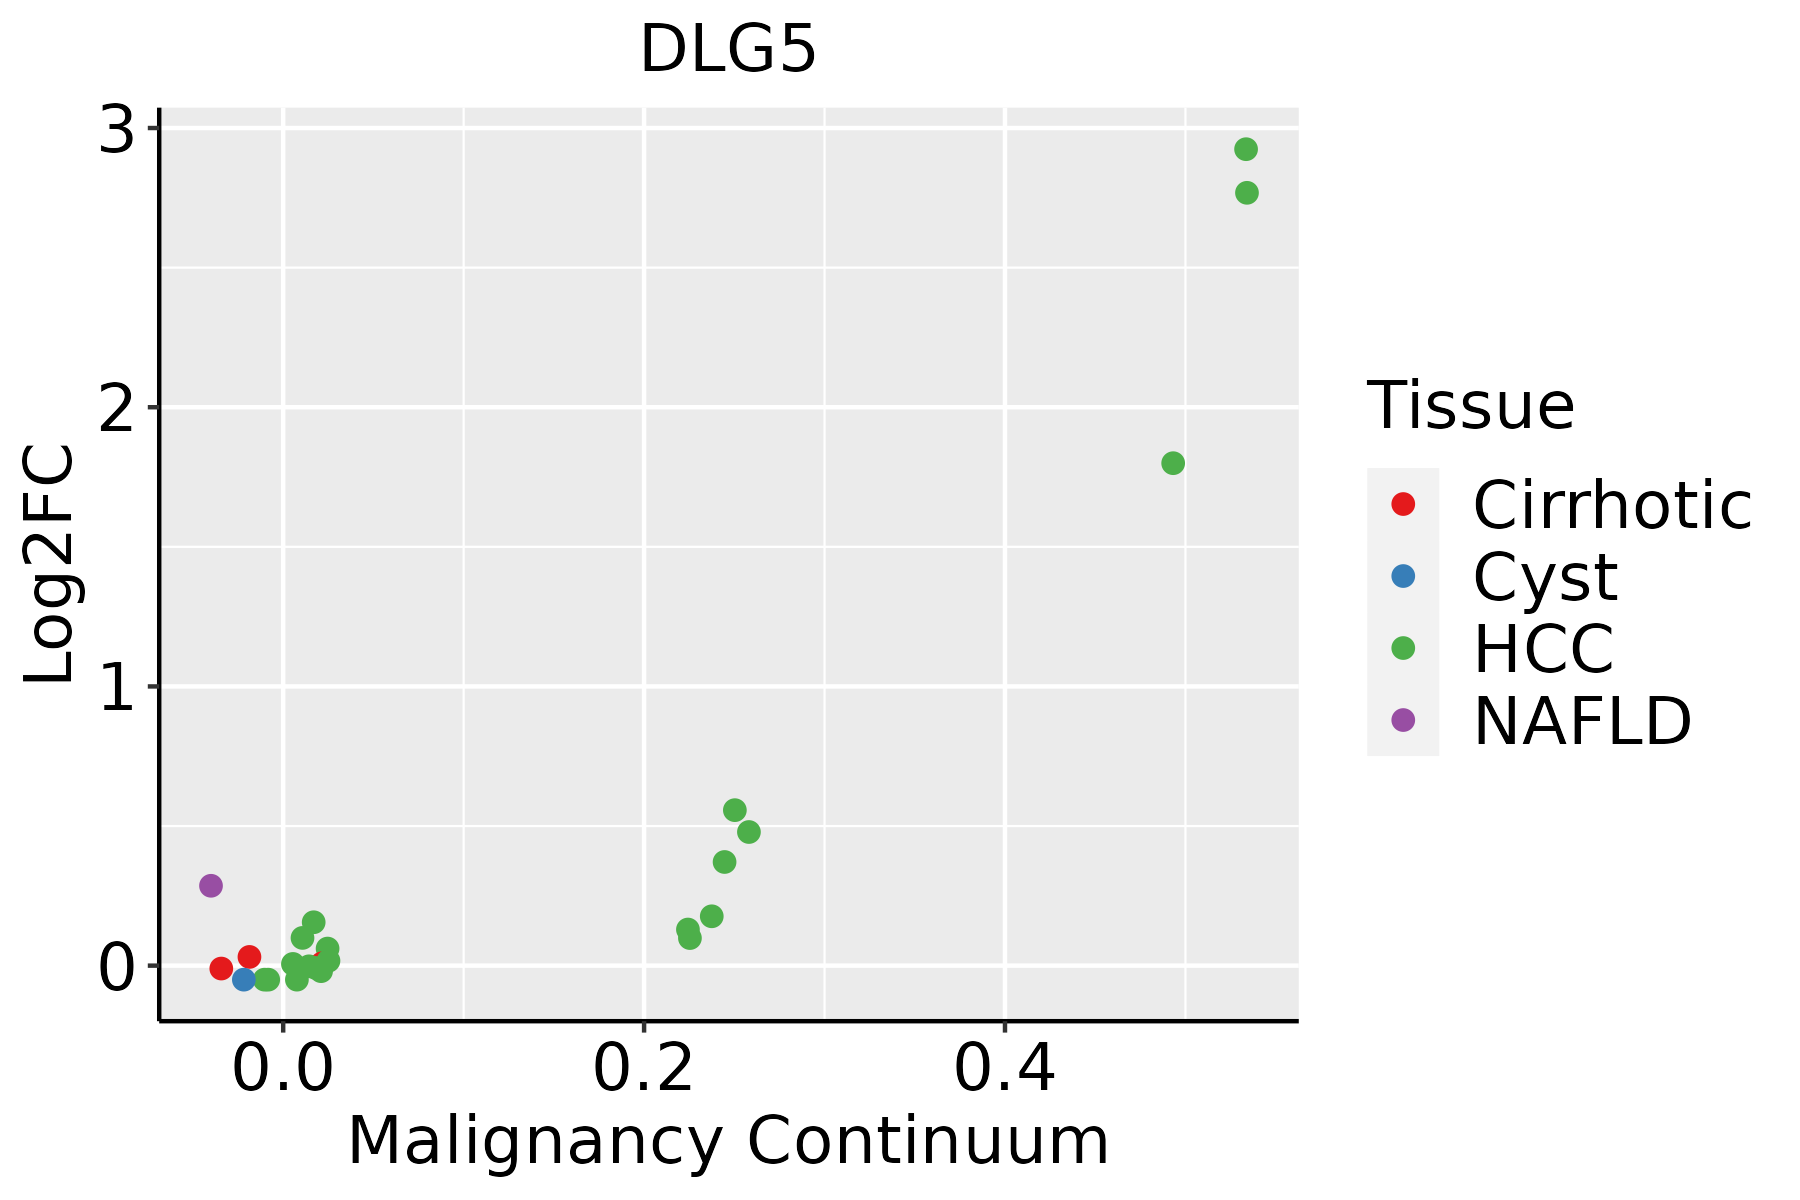 | HCC: Hepatocellular carcinoma |
| NAFLD: Non-alcoholic fatty liver disease | ||
| Oral Cavity |  | EOLP: Erosive Oral lichen planus |
| LP: leukoplakia | ||
| NEOLP: Non-erosive oral lichen planus | ||
| OSCC: Oral squamous cell carcinoma | ||
| Prostate | 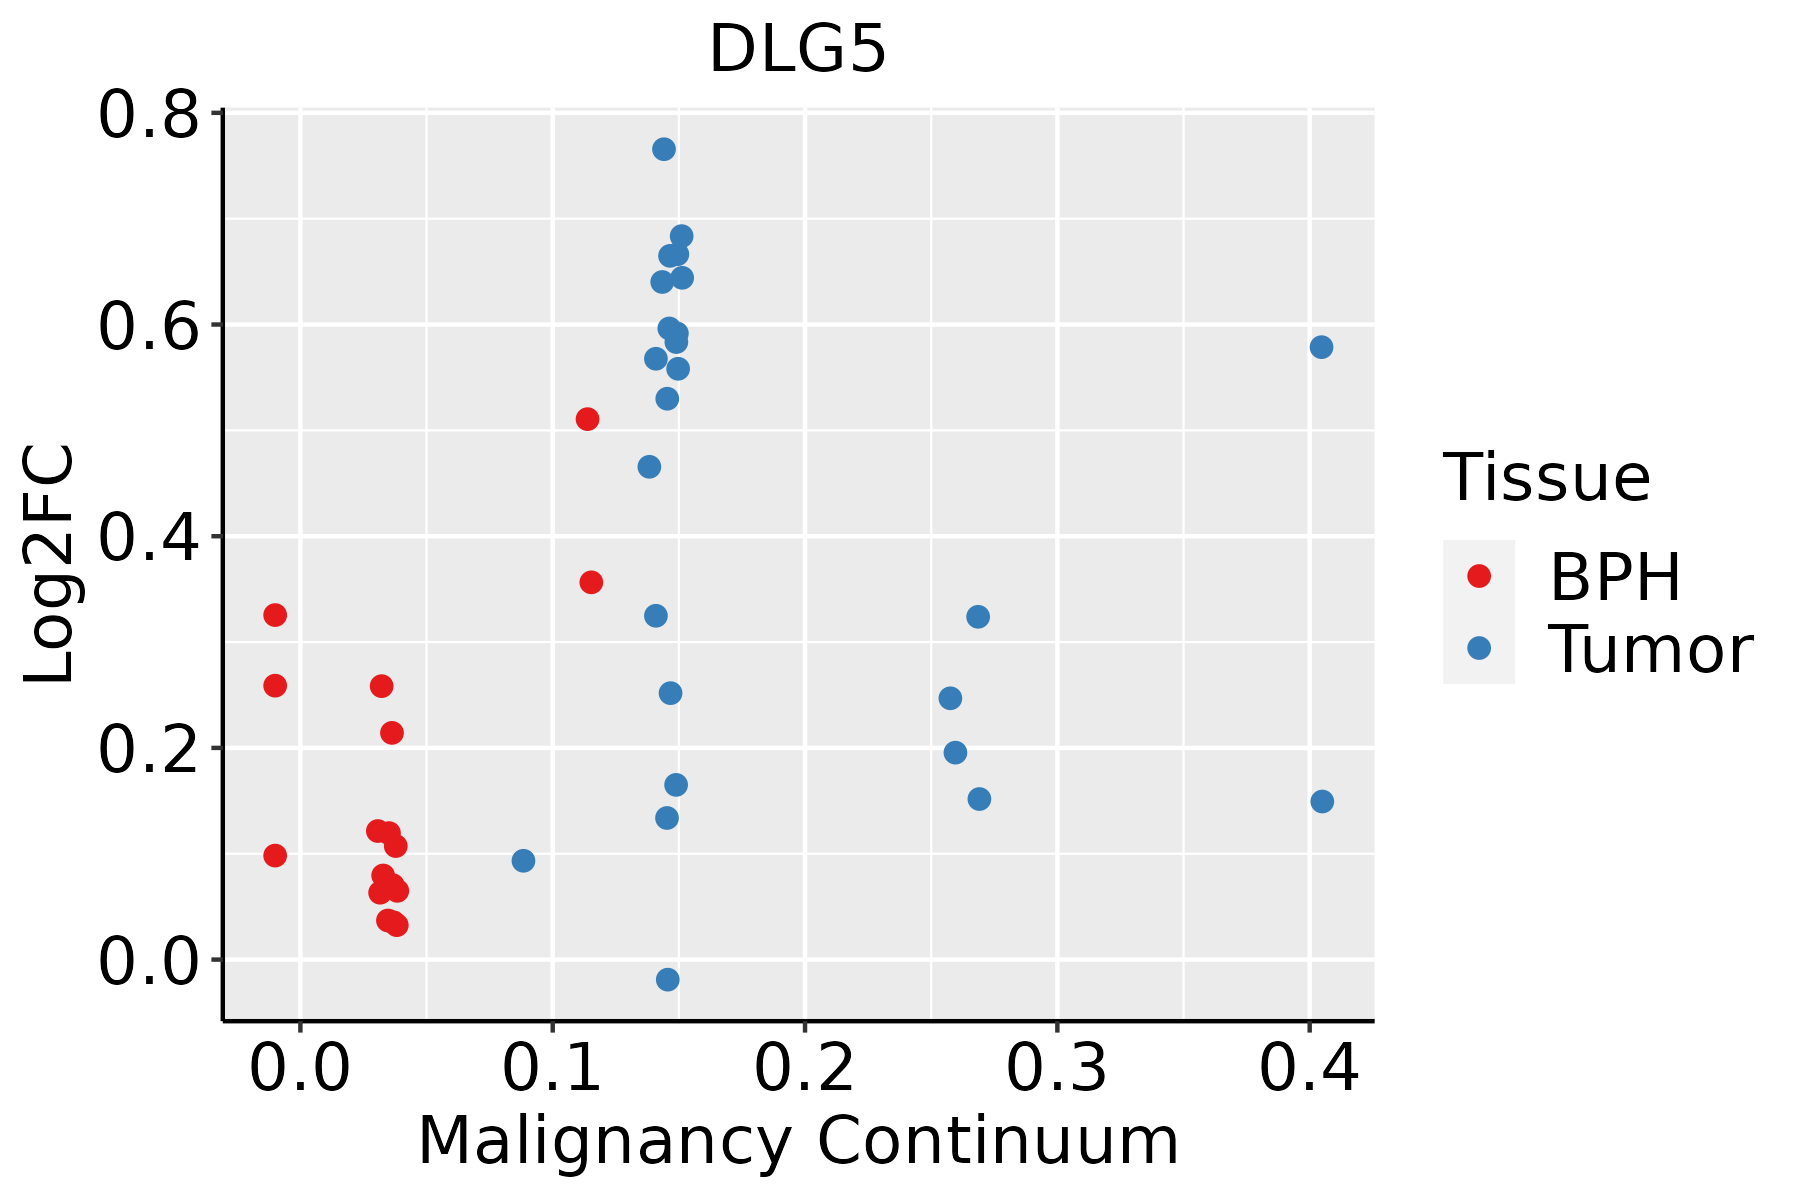 | BPH: Benign Prostatic Hyperplasia |
| Skin |  | AK: Actinic keratosis |
| cSCC: Cutaneous squamous cell carcinoma | ||
| SCCIS:squamous cell carcinoma in situ | ||
| Thyroid | 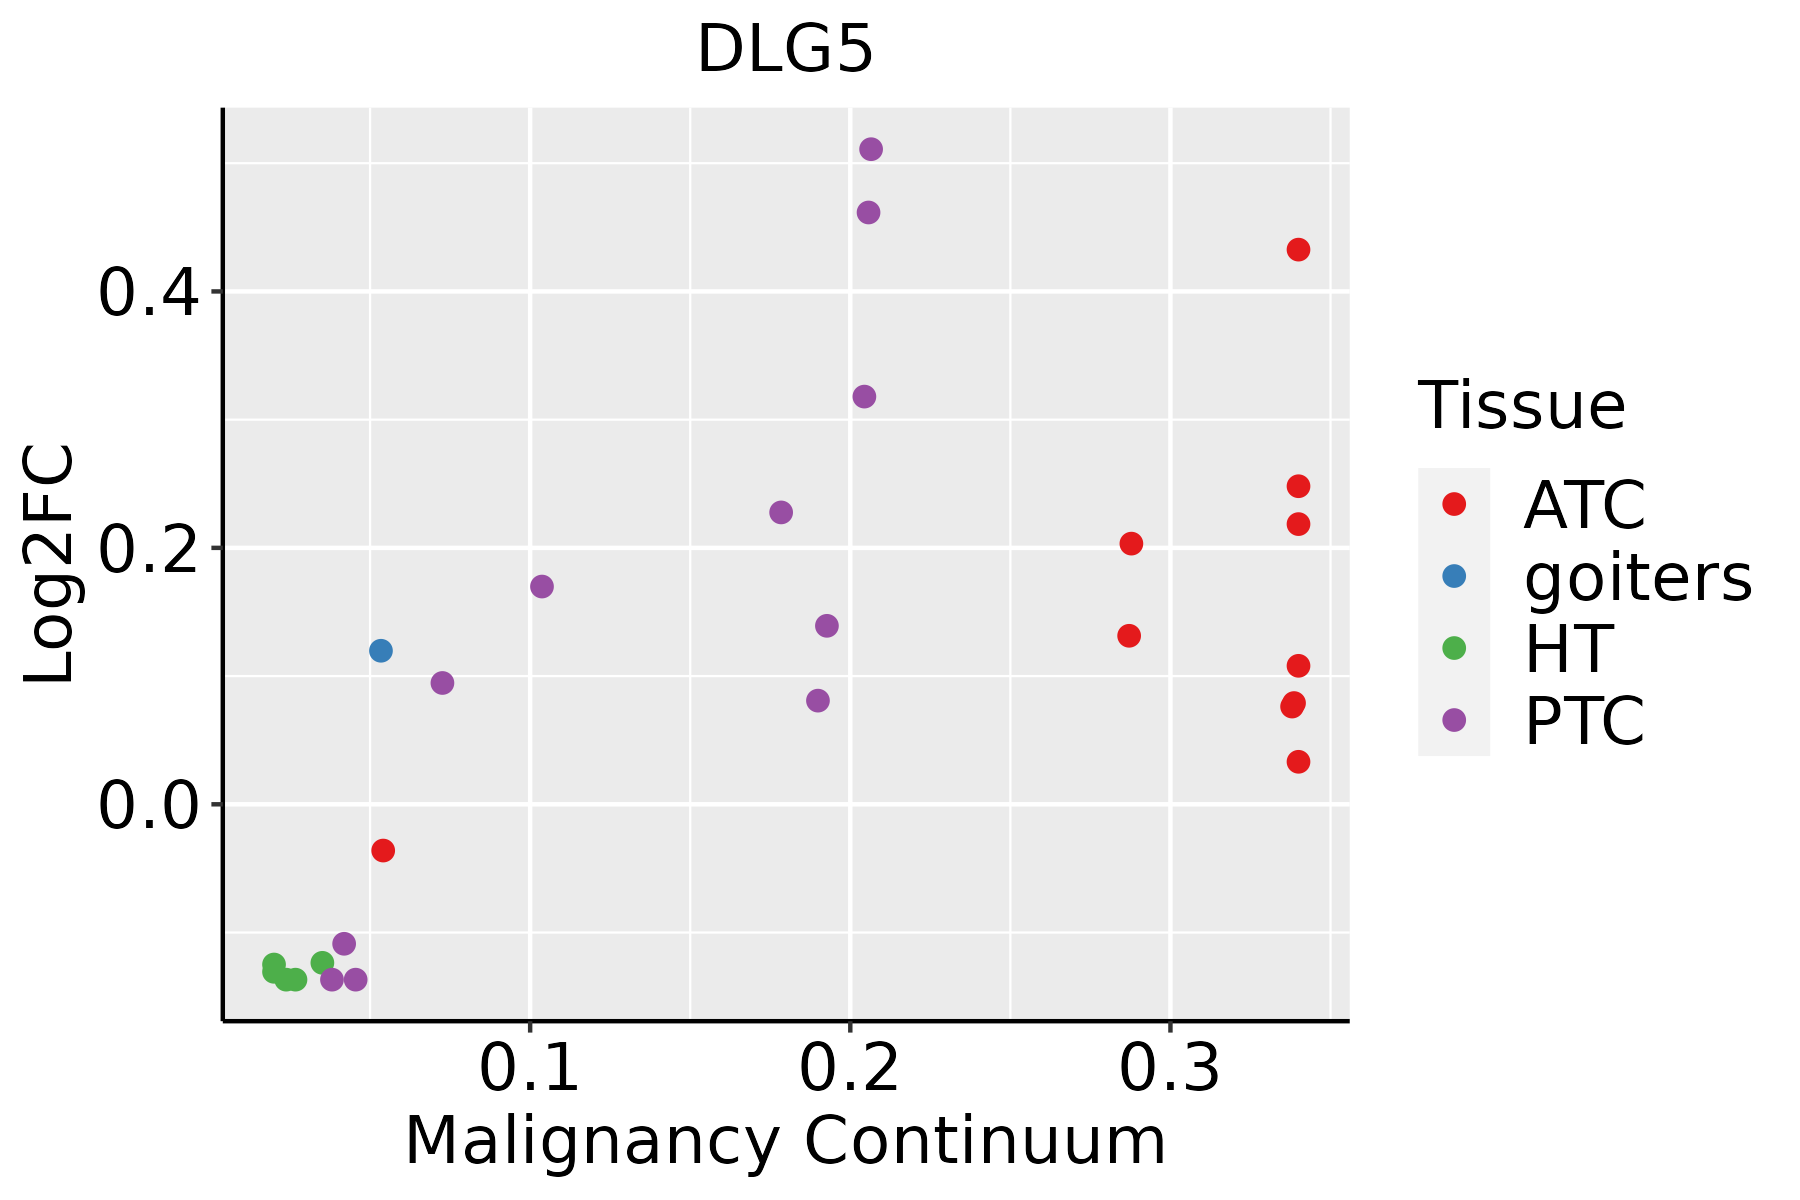 | ATC: Anaplastic thyroid cancer |
| HT: Hashimoto's thyroiditis | ||
| PTC: Papillary thyroid cancer |
| ∗log2FC in expression of this searched gene in stem-like cells from each diseased tissue sample relative to stem-like cells in normal samples in each tissue plotted against the malignancy continuum. Samples are colored based on if they are from different disease stage. |
Top |
Malignant transformation related pathway analysis |
| Find out the enriched GO biological processes and KEGG pathways involved in transition from healthy to precancer to cancer |
| Tissue | Disease Stage | Enriched GO biological Processes |
| Colorectum | AD |  |
| Colorectum | SER |  |
| Colorectum | MSS |  |
| Colorectum | MSI-H |  |
| Colorectum | FAP |  |
| ∗Top 15 enriched GO BP terms are showed in the bar plot of each disease state in each tissue. Each row represents a significant GO biological process which is colored according to the -log10(p.adjust). |
| Page: 1 2 3 4 5 6 7 8 9 |
| GO ID | Tissue | Disease Stage | Description | Gene Ratio | Bg Ratio | pvalue | p.adjust | Count |
| GO:003090112 | Breast | IDC | midbrain development | 24/1434 | 90/18723 | 4.35e-08 | 2.87e-06 | 24 |
| GO:004211012 | Breast | IDC | T cell activation | 64/1434 | 487/18723 | 1.49e-05 | 3.77e-04 | 64 |
| GO:005086311 | Breast | IDC | regulation of T cell activation | 47/1434 | 329/18723 | 2.49e-05 | 5.91e-04 | 47 |
| GO:000715912 | Breast | IDC | leukocyte cell-cell adhesion | 49/1434 | 371/18723 | 1.27e-04 | 2.33e-03 | 49 |
| GO:000268311 | Breast | IDC | negative regulation of immune system process | 55/1434 | 434/18723 | 1.53e-04 | 2.67e-03 | 55 |
| GO:006056212 | Breast | IDC | epithelial tube morphogenesis | 44/1434 | 325/18723 | 1.58e-04 | 2.73e-03 | 44 |
| GO:190303711 | Breast | IDC | regulation of leukocyte cell-cell adhesion | 45/1434 | 336/18723 | 1.72e-04 | 2.92e-03 | 45 |
| GO:00512712 | Breast | IDC | negative regulation of cellular component movement | 48/1434 | 367/18723 | 1.88e-04 | 3.12e-03 | 48 |
| GO:00303244 | Breast | IDC | lung development | 28/1434 | 177/18723 | 1.90e-04 | 3.15e-03 | 28 |
| GO:00303234 | Breast | IDC | respiratory tube development | 28/1434 | 181/18723 | 2.78e-04 | 4.26e-03 | 28 |
| GO:000716314 | Breast | IDC | establishment or maintenance of cell polarity | 32/1434 | 218/18723 | 2.84e-04 | 4.33e-03 | 32 |
| GO:00611383 | Breast | IDC | morphogenesis of a branching epithelium | 28/1434 | 182/18723 | 3.05e-04 | 4.60e-03 | 28 |
| GO:002240712 | Breast | IDC | regulation of cell-cell adhesion | 55/1434 | 448/18723 | 3.43e-04 | 5.07e-03 | 55 |
| GO:00605412 | Breast | IDC | respiratory system development | 30/1434 | 203/18723 | 3.85e-04 | 5.40e-03 | 30 |
| GO:20001462 | Breast | IDC | negative regulation of cell motility | 46/1434 | 359/18723 | 4.01e-04 | 5.60e-03 | 46 |
| GO:00017635 | Breast | IDC | morphogenesis of a branching structure | 29/1434 | 196/18723 | 4.68e-04 | 6.26e-03 | 29 |
| GO:0001656 | Breast | IDC | metanephros development | 16/1434 | 85/18723 | 6.49e-04 | 8.04e-03 | 16 |
| GO:00303362 | Breast | IDC | negative regulation of cell migration | 43/1434 | 344/18723 | 1.01e-03 | 1.13e-02 | 43 |
| GO:004209812 | Breast | IDC | T cell proliferation | 28/1434 | 199/18723 | 1.29e-03 | 1.35e-02 | 28 |
| GO:0034333 | Breast | IDC | adherens junction assembly | 5/1434 | 12/18723 | 1.31e-03 | 1.37e-02 | 5 |
| Page: 1 2 3 4 5 6 7 8 9 10 11 12 13 14 15 16 17 18 19 20 21 22 23 |
| Pathway ID | Tissue | Disease Stage | Description | Gene Ratio | Bg Ratio | pvalue | p.adjust | qvalue | Count |
| hsa043908 | Cervix | CC | Hippo signaling pathway | 40/1267 | 157/8465 | 3.64e-04 | 1.82e-03 | 1.07e-03 | 40 |
| hsa0439013 | Cervix | CC | Hippo signaling pathway | 40/1267 | 157/8465 | 3.64e-04 | 1.82e-03 | 1.07e-03 | 40 |
| hsa0439018 | Esophagus | ESCC | Hippo signaling pathway | 92/4205 | 157/8465 | 1.46e-02 | 3.31e-02 | 1.69e-02 | 92 |
| hsa0439019 | Esophagus | ESCC | Hippo signaling pathway | 92/4205 | 157/8465 | 1.46e-02 | 3.31e-02 | 1.69e-02 | 92 |
| hsa0439016 | Oral cavity | OSCC | Hippo signaling pathway | 86/3704 | 157/8465 | 3.30e-03 | 8.24e-03 | 4.20e-03 | 86 |
| hsa0439017 | Oral cavity | OSCC | Hippo signaling pathway | 86/3704 | 157/8465 | 3.30e-03 | 8.24e-03 | 4.20e-03 | 86 |
| hsa0439010 | Prostate | BPH | Hippo signaling pathway | 52/1718 | 157/8465 | 9.93e-05 | 6.00e-04 | 3.71e-04 | 52 |
| hsa0439015 | Prostate | BPH | Hippo signaling pathway | 52/1718 | 157/8465 | 9.93e-05 | 6.00e-04 | 3.71e-04 | 52 |
| hsa0439024 | Prostate | Tumor | Hippo signaling pathway | 54/1791 | 157/8465 | 7.52e-05 | 5.30e-04 | 3.28e-04 | 54 |
| hsa0439034 | Prostate | Tumor | Hippo signaling pathway | 54/1791 | 157/8465 | 7.52e-05 | 5.30e-04 | 3.28e-04 | 54 |
| Page: 1 |
Top |
Cell-cell communication analysis |
| Identification of potential cell-cell interactions between two cell types and their ligand-receptor pairs for different disease states |
| Ligand | Receptor | LRpair | Pathway | Tissue | Disease Stage |
| Page: 1 |
Top |
Single-cell gene regulatory network inference analysis |
| Find out the significant the regulons (TFs) and the target genes of each regulon across cell types for different disease states |
| TF | Cell Type | Tissue | Disease Stage | Target Gene | RSS | Regulon Activity |
| ∗The dot plots of a searched regulon are shown for all cell subpopulations in each disease state of each tissue based on the regulon specific score inferred using pySCENIC and by calculating the average expression. |
| Page: 1 |
Top |
Somatic mutation of malignant transformation related genes |
| Annotation of somatic variants for genes involved in malignant transformation |
| Hugo Symbol | Variant Class | Variant Classification | dbSNP RS | HGVSc | HGVSp | HGVSp Short | SWISSPROT | BIOTYPE | SIFT | PolyPhen | Tumor Sample Barcode | Tissue | Histology | Sex | Age | Stage | Therapy Types | Drugs | Outcome |
| DLG5 | SNV | Missense_Mutation | c.2146N>C | p.Val716Leu | p.V716L | Q8TDM6 | protein_coding | tolerated(0.55) | benign(0.005) | TCGA-A1-A0SO-01 | Breast | breast invasive carcinoma | Female | >=65 | I/II | Chemotherapy | SD | ||
| DLG5 | SNV | Missense_Mutation | rs750819054 | c.1496N>A | p.Arg499Gln | p.R499Q | Q8TDM6 | protein_coding | deleterious(0) | probably_damaging(0.996) | TCGA-A2-A0YH-01 | Breast | breast invasive carcinoma | Female | <65 | III/IV | Chemotherapy | adriamycin | SD |
| DLG5 | SNV | Missense_Mutation | rs200259340 | c.2038G>A | p.Asp680Asn | p.D680N | Q8TDM6 | protein_coding | tolerated(0.39) | probably_damaging(1) | TCGA-A2-A0YK-01 | Breast | breast invasive carcinoma | Female | <65 | I/II | Chemotherapy | cytoxan | SD |
| DLG5 | SNV | Missense_Mutation | novel | c.3988N>C | p.Val1330Leu | p.V1330L | Q8TDM6 | protein_coding | tolerated(0.14) | benign(0.071) | TCGA-A8-A06P-01 | Breast | breast invasive carcinoma | Female | <65 | III/IV | Unspecific | SD | |
| DLG5 | SNV | Missense_Mutation | rs372158883 | c.1354N>A | p.Glu452Lys | p.E452K | Q8TDM6 | protein_coding | tolerated(0.17) | possibly_damaging(0.795) | TCGA-A8-A08B-01 | Breast | breast invasive carcinoma | Female | <65 | I/II | Chemotherapy | 5-fluorouracil | CR |
| DLG5 | SNV | Missense_Mutation | rs753964604 | c.4343N>T | p.Gly1448Val | p.G1448V | Q8TDM6 | protein_coding | deleterious(0.03) | benign(0.024) | TCGA-AN-A0FD-01 | Breast | breast invasive carcinoma | Female | >=65 | I/II | Unknown | Unknown | SD |
| DLG5 | SNV | Missense_Mutation | rs753964604 | c.4343G>T | p.Gly1448Val | p.G1448V | Q8TDM6 | protein_coding | deleterious(0.03) | benign(0.024) | TCGA-AR-A0TQ-01 | Breast | breast invasive carcinoma | Female | <65 | III/IV | Chemotherapy | doxorubicin | SD |
| DLG5 | SNV | Missense_Mutation | rs753964604 | c.4343G>T | p.Gly1448Val | p.G1448V | Q8TDM6 | protein_coding | deleterious(0.03) | benign(0.024) | TCGA-BH-A0BW-01 | Breast | breast invasive carcinoma | Female | >=65 | I/II | Chemotherapy | adriamycin | CR |
| DLG5 | SNV | Missense_Mutation | rs753964604 | c.4343N>T | p.Gly1448Val | p.G1448V | Q8TDM6 | protein_coding | deleterious(0.03) | benign(0.024) | TCGA-C8-A135-01 | Breast | breast invasive carcinoma | Female | <65 | I/II | Chemotherapy | 5-fluorouracil | CR |
| DLG5 | SNV | Missense_Mutation | rs753964604 | c.4343N>T | p.Gly1448Val | p.G1448V | Q8TDM6 | protein_coding | deleterious(0.03) | benign(0.024) | TCGA-E2-A10C-01 | Breast | breast invasive carcinoma | Female | <65 | I/II | Chemotherapy | cytoxan | SD |
| Page: 1 2 3 4 5 6 7 8 9 10 11 12 13 14 15 16 17 18 19 |
Top |
Related drugs of malignant transformation related genes |
| Identification of chemicals and drugs interact with genes involved in malignant transfromation |
| (DGIdb 4.0) |
| Entrez ID | Symbol | Category | Interaction Types | Drug Claim Name | Drug Name | PMIDs |
| 9231 | DLG5 | KINASE | capecitabine | CAPECITABINE | ||
| 9231 | DLG5 | KINASE | fluorouracil | FLUOROURACIL |
| Page: 1 |

Copyright 2023-Present -The University of Texas Health Science Center at Houston |