
|
|||||
|
 | |
| |
| |
| |
| |
| |
|
Gene: DLG3 |
Gene summary for DLG3 |
| Gene information | Species | Human | Gene symbol | DLG3 | Gene ID | 1741 |
| Gene name | discs large MAGUK scaffold protein 3 | |
| Gene Alias | MRX | |
| Cytomap | Xq13.1 | |
| Gene Type | protein-coding | GO ID | GO:0001736 | UniProtAcc | Q92796 |
Top |
Malignant transformation analysis |
| Identification of the aberrant gene expression in precancerous and cancerous lesions by comparing the gene expression of stem-like cells in diseased tissues with normal stem cells |
| Entrez ID | Symbol | Replicates | Species | Organ | Tissue | Adj P-value | Log2FC | Malignancy |
| 1741 | DLG3 | male-WTA | Human | Thyroid | PTC | 1.33e-17 | 1.83e-01 | 0.1037 |
| 1741 | DLG3 | PTC01 | Human | Thyroid | PTC | 9.36e-04 | 8.67e-02 | 0.1899 |
| 1741 | DLG3 | PTC04 | Human | Thyroid | PTC | 2.07e-10 | 2.62e-01 | 0.1927 |
| 1741 | DLG3 | PTC05 | Human | Thyroid | PTC | 6.16e-18 | 3.44e-01 | 0.2065 |
| 1741 | DLG3 | PTC06 | Human | Thyroid | PTC | 1.62e-17 | 5.02e-01 | 0.2057 |
| 1741 | DLG3 | PTC07 | Human | Thyroid | PTC | 6.28e-23 | 4.05e-01 | 0.2044 |
| 1741 | DLG3 | ATC09 | Human | Thyroid | ATC | 1.14e-05 | 1.30e-01 | 0.2871 |
| 1741 | DLG3 | ATC13 | Human | Thyroid | ATC | 2.57e-06 | 9.64e-02 | 0.34 |
| 1741 | DLG3 | ATC1 | Human | Thyroid | ATC | 2.31e-06 | 1.61e-01 | 0.2878 |
| 1741 | DLG3 | ATC4 | Human | Thyroid | ATC | 4.58e-02 | 5.08e-03 | 0.34 |
| 1741 | DLG3 | ATC5 | Human | Thyroid | ATC | 7.02e-05 | 1.20e-01 | 0.34 |
| Page: 1 |
| Tissue | Expression Dynamics | Abbreviation |
| Thyroid | 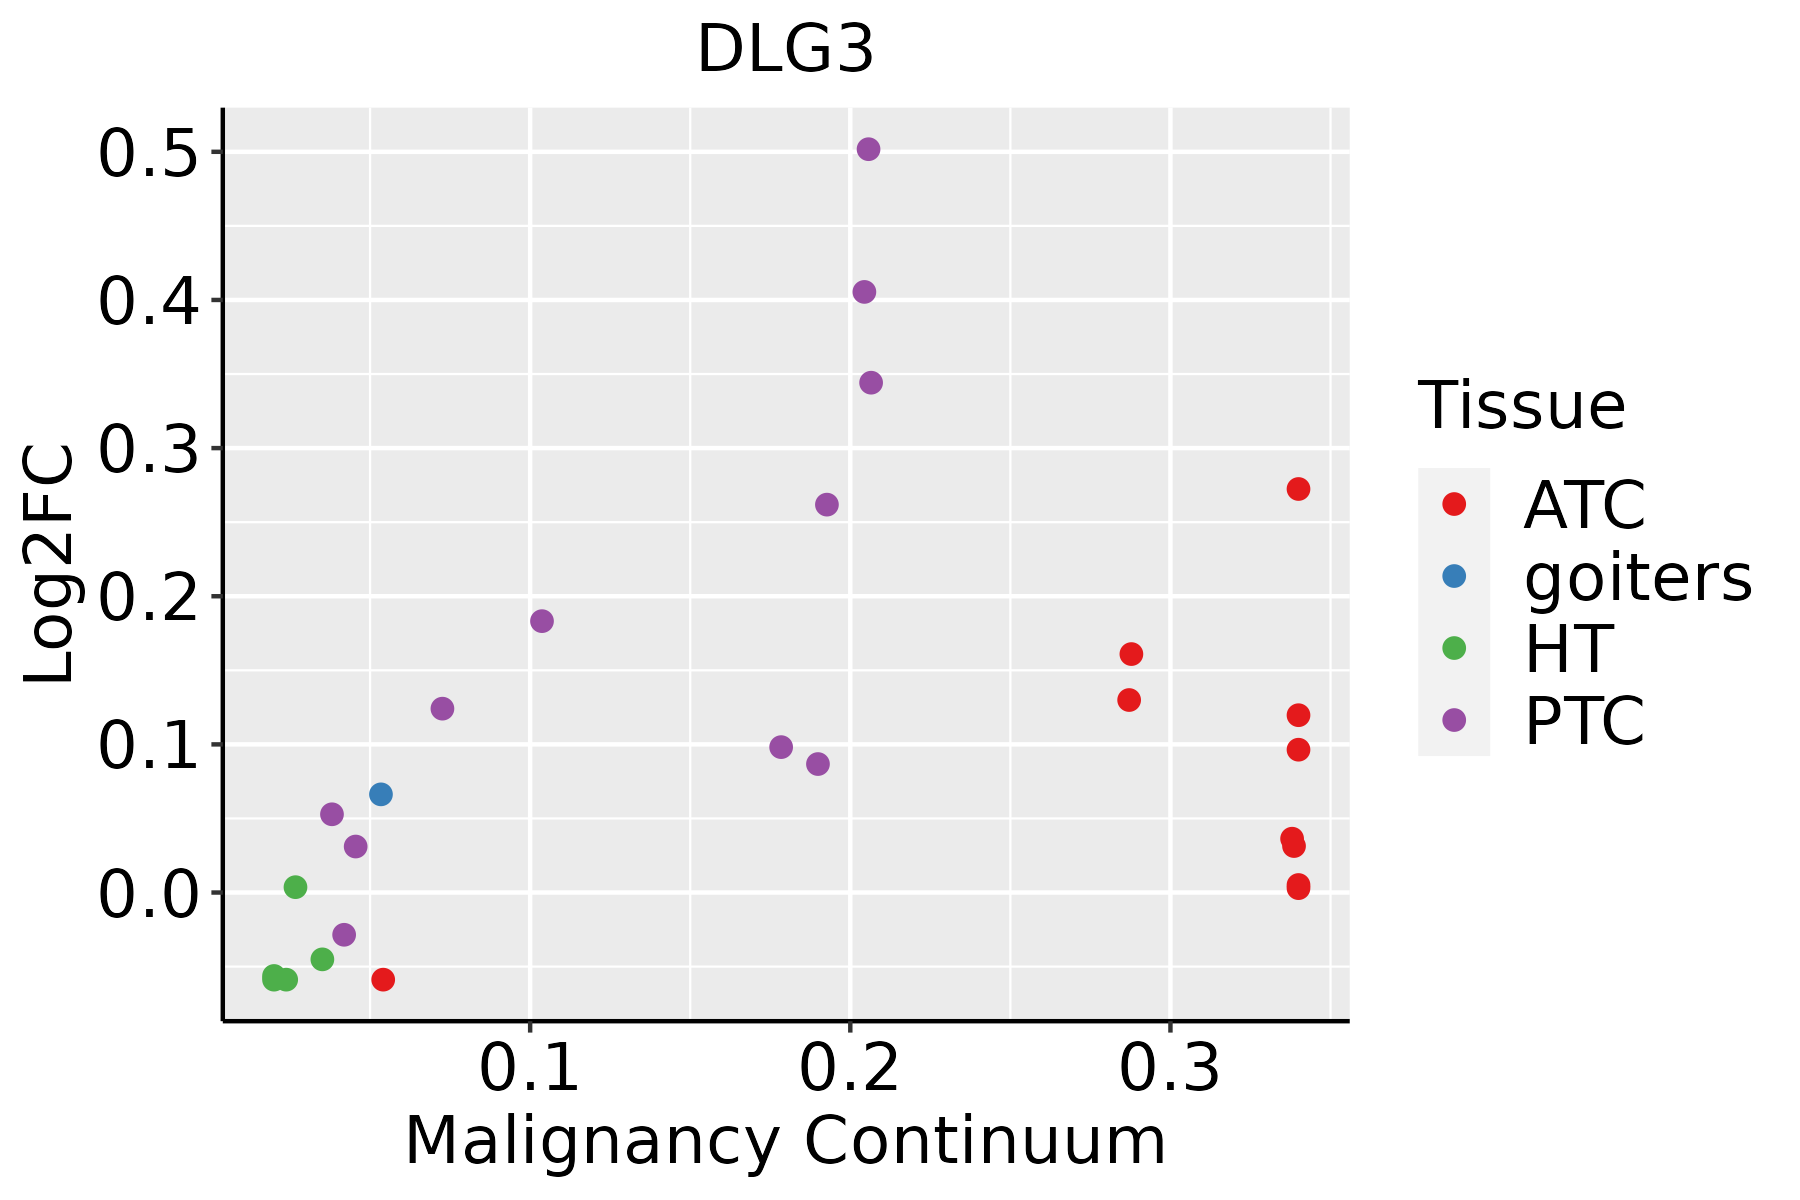 | ATC: Anaplastic thyroid cancer |
| HT: Hashimoto's thyroiditis | ||
| PTC: Papillary thyroid cancer |
| ∗log2FC in expression of this searched gene in stem-like cells from each diseased tissue sample relative to stem-like cells in normal samples in each tissue plotted against the malignancy continuum. Samples are colored based on if they are from different disease stage. |
Top |
Malignant transformation related pathway analysis |
| Find out the enriched GO biological processes and KEGG pathways involved in transition from healthy to precancer to cancer |
| Tissue | Disease Stage | Enriched GO biological Processes |
| Colorectum | AD |  |
| Colorectum | SER |  |
| Colorectum | MSS |  |
| Colorectum | MSI-H |  |
| Colorectum | FAP |  |
| ∗Top 15 enriched GO BP terms are showed in the bar plot of each disease state in each tissue. Each row represents a significant GO biological process which is colored according to the -log10(p.adjust). |
| Page: 1 2 3 4 5 6 7 8 9 |
| GO ID | Tissue | Disease Stage | Description | Gene Ratio | Bg Ratio | pvalue | p.adjust | Count |
| GO:0007163111 | Thyroid | PTC | establishment or maintenance of cell polarity | 115/5968 | 218/18723 | 1.15e-10 | 3.90e-09 | 115 |
| GO:0045860111 | Thyroid | PTC | positive regulation of protein kinase activity | 176/5968 | 386/18723 | 8.89e-09 | 2.17e-07 | 176 |
| GO:00315037 | Thyroid | PTC | protein-containing complex localization | 107/5968 | 220/18723 | 1.47e-07 | 2.82e-06 | 107 |
| GO:0033674111 | Thyroid | PTC | positive regulation of kinase activity | 201/5968 | 467/18723 | 1.95e-07 | 3.54e-06 | 201 |
| GO:00991738 | Thyroid | PTC | postsynapse organization | 77/5968 | 168/18723 | 1.01e-04 | 8.25e-04 | 77 |
| GO:00610974 | Thyroid | PTC | regulation of protein tyrosine kinase activity | 45/5968 | 90/18723 | 2.57e-04 | 1.84e-03 | 45 |
| GO:004519710 | Thyroid | PTC | establishment or maintenance of epithelial cell apical/basal polarity | 24/5968 | 44/18723 | 1.52e-03 | 8.49e-03 | 24 |
| GO:003508810 | Thyroid | PTC | establishment or maintenance of apical/basal cell polarity | 26/5968 | 49/18723 | 1.68e-03 | 9.20e-03 | 26 |
| GO:006124510 | Thyroid | PTC | establishment or maintenance of bipolar cell polarity | 26/5968 | 49/18723 | 1.68e-03 | 9.20e-03 | 26 |
| GO:00508089 | Thyroid | PTC | synapse organization | 161/5968 | 426/18723 | 5.11e-03 | 2.36e-02 | 161 |
| GO:00182126 | Thyroid | PTC | peptidyl-tyrosine modification | 142/5968 | 378/18723 | 1.02e-02 | 4.14e-02 | 142 |
| GO:00017389 | Thyroid | PTC | morphogenesis of a polarized epithelium | 41/5968 | 94/18723 | 1.10e-02 | 4.38e-02 | 41 |
| GO:000716329 | Thyroid | ATC | establishment or maintenance of cell polarity | 122/6293 | 218/18723 | 8.46e-12 | 3.16e-10 | 122 |
| GO:004586026 | Thyroid | ATC | positive regulation of protein kinase activity | 185/6293 | 386/18723 | 3.00e-09 | 7.02e-08 | 185 |
| GO:003367427 | Thyroid | ATC | positive regulation of kinase activity | 212/6293 | 467/18723 | 5.89e-08 | 1.05e-06 | 212 |
| GO:003150316 | Thyroid | ATC | protein-containing complex localization | 108/6293 | 220/18723 | 1.33e-06 | 1.69e-05 | 108 |
| GO:009917314 | Thyroid | ATC | postsynapse organization | 78/6293 | 168/18723 | 3.66e-04 | 2.26e-03 | 78 |
| GO:006109712 | Thyroid | ATC | regulation of protein tyrosine kinase activity | 45/6293 | 90/18723 | 9.39e-04 | 5.04e-03 | 45 |
| GO:001821211 | Thyroid | ATC | peptidyl-tyrosine modification | 156/6293 | 378/18723 | 1.01e-03 | 5.36e-03 | 156 |
| GO:003508815 | Thyroid | ATC | establishment or maintenance of apical/basal cell polarity | 27/6293 | 49/18723 | 1.58e-03 | 7.99e-03 | 27 |
| Page: 1 2 |
| Pathway ID | Tissue | Disease Stage | Description | Gene Ratio | Bg Ratio | pvalue | p.adjust | qvalue | Count |
| Page: 1 |
Top |
Cell-cell communication analysis |
| Identification of potential cell-cell interactions between two cell types and their ligand-receptor pairs for different disease states |
| Ligand | Receptor | LRpair | Pathway | Tissue | Disease Stage |
| Page: 1 |
Top |
Single-cell gene regulatory network inference analysis |
| Find out the significant the regulons (TFs) and the target genes of each regulon across cell types for different disease states |
| TF | Cell Type | Tissue | Disease Stage | Target Gene | RSS | Regulon Activity |
| ∗The dot plots of a searched regulon are shown for all cell subpopulations in each disease state of each tissue based on the regulon specific score inferred using pySCENIC and by calculating the average expression. |
| Page: 1 |
Top |
Somatic mutation of malignant transformation related genes |
| Annotation of somatic variants for genes involved in malignant transformation |
| Hugo Symbol | Variant Class | Variant Classification | dbSNP RS | HGVSc | HGVSp | HGVSp Short | SWISSPROT | BIOTYPE | SIFT | PolyPhen | Tumor Sample Barcode | Tissue | Histology | Sex | Age | Stage | Therapy Types | Drugs | Outcome |
| DLG3 | SNV | Missense_Mutation | novel | c.1706N>G | p.Lys569Arg | p.K569R | Q92796 | protein_coding | tolerated(1) | benign(0.003) | TCGA-A7-A425-01 | Breast | breast invasive carcinoma | Female | >=65 | III/IV | Chemotherapy | adriamycin | PD |
| DLG3 | SNV | Missense_Mutation | c.602N>T | p.Glu201Val | p.E201V | Q92796 | protein_coding | deleterious(0.02) | probably_damaging(0.998) | TCGA-A8-A09G-01 | Breast | breast invasive carcinoma | Female | >=65 | III/IV | Unknown | Unknown | SD | |
| DLG3 | SNV | Missense_Mutation | novel | c.577N>A | p.Glu193Lys | p.E193K | Q92796 | protein_coding | deleterious(0.04) | probably_damaging(0.997) | TCGA-E2-A14V-01 | Breast | breast invasive carcinoma | Female | <65 | I/II | Chemotherapy | cyclophosphamide | SD |
| DLG3 | insertion | Frame_Shift_Ins | novel | c.1120_1121insGAACTGAGTCCAGATCCCAGTTCTGTCTTTGTTTTTTTGTT | p.Met374ArgfsTer42 | p.M374Rfs*42 | Q92796 | protein_coding | TCGA-AQ-A04J-01 | Breast | breast invasive carcinoma | Female | <65 | I/II | Chemotherapy | cytoxan | SD | ||
| DLG3 | SNV | Missense_Mutation | c.1420N>C | p.Glu474Gln | p.E474Q | Q92796 | protein_coding | deleterious(0.02) | possibly_damaging(0.882) | TCGA-C5-A1MK-01 | Cervix | cervical & endocervical cancer | Female | >=65 | III/IV | Chemotherapy | carboplatin | PD | |
| DLG3 | SNV | Missense_Mutation | novel | c.736N>C | p.Asn246His | p.N246H | Q92796 | protein_coding | deleterious(0.02) | probably_damaging(0.984) | TCGA-DS-A7WI-01 | Cervix | cervical & endocervical cancer | Female | <65 | I/II | Chemotherapy | cisplatin | PD |
| DLG3 | SNV | Missense_Mutation | novel | c.1547N>A | p.Arg516Gln | p.R516Q | Q92796 | protein_coding | deleterious(0.01) | possibly_damaging(0.448) | TCGA-MY-A5BF-01 | Cervix | cervical & endocervical cancer | Female | >=65 | I/II | Chemotherapy | cisplatin | CR |
| DLG3 | SNV | Missense_Mutation | novel | c.1481G>C | p.Gly494Ala | p.G494A | Q92796 | protein_coding | tolerated(0.11) | probably_damaging(0.952) | TCGA-A6-3807-01 | Colorectum | colon adenocarcinoma | Female | <65 | III/IV | Ancillary | leucovorin | SD |
| DLG3 | SNV | Missense_Mutation | rs199927598 | c.811C>T | p.Arg271Cys | p.R271C | Q92796 | protein_coding | deleterious(0) | probably_damaging(0.999) | TCGA-AA-3966-01 | Colorectum | colon adenocarcinoma | Female | >=65 | I/II | Unknown | Unknown | SD |
| DLG3 | SNV | Missense_Mutation | novel | c.391N>A | p.Glu131Lys | p.E131K | Q92796 | protein_coding | tolerated(0.1) | probably_damaging(0.997) | TCGA-AA-3984-01 | Colorectum | colon adenocarcinoma | Female | <65 | I/II | Unknown | Unknown | SD |
| Page: 1 2 3 4 5 6 7 8 |
Top |
Related drugs of malignant transformation related genes |
| Identification of chemicals and drugs interact with genes involved in malignant transfromation |
| (DGIdb 4.0) |
| Entrez ID | Symbol | Category | Interaction Types | Drug Claim Name | Drug Name | PMIDs |
| Page: 1 |

Copyright 2023-Present -The University of Texas Health Science Center at Houston |