
|
|||||
|
 | |
| |
| |
| |
| |
| |
|
Gene: DKK1 |
Gene summary for DKK1 |
| Gene information | Species | Human | Gene symbol | DKK1 | Gene ID | 22943 |
| Gene name | dickkopf WNT signaling pathway inhibitor 1 | |
| Gene Alias | DKK-1 | |
| Cytomap | 10q21.1 | |
| Gene Type | protein-coding | GO ID | GO:0000122 | UniProtAcc | I1W660 |
Top |
Malignant transformation analysis |
| Identification of the aberrant gene expression in precancerous and cancerous lesions by comparing the gene expression of stem-like cells in diseased tissues with normal stem cells |
| Entrez ID | Symbol | Replicates | Species | Organ | Tissue | Adj P-value | Log2FC | Malignancy |
| 22943 | DKK1 | LZE24T | Human | Esophagus | ESCC | 4.23e-04 | -3.35e-01 | 0.0596 |
| 22943 | DKK1 | P10T-E | Human | Esophagus | ESCC | 5.34e-06 | -3.08e-01 | 0.116 |
| 22943 | DKK1 | P16T-E | Human | Esophagus | ESCC | 1.52e-10 | 9.05e-01 | 0.1153 |
| 22943 | DKK1 | P26T-E | Human | Esophagus | ESCC | 7.22e-09 | 1.20e+00 | 0.1276 |
| 22943 | DKK1 | P31T-E | Human | Esophagus | ESCC | 1.88e-15 | 9.91e-01 | 0.1251 |
| 22943 | DKK1 | P40T-E | Human | Esophagus | ESCC | 2.18e-02 | 1.18e+00 | 0.109 |
| 22943 | DKK1 | P62T-E | Human | Esophagus | ESCC | 8.91e-13 | 1.58e+00 | 0.1302 |
| 22943 | DKK1 | P65T-E | Human | Esophagus | ESCC | 7.37e-04 | 6.49e-01 | 0.0978 |
| 22943 | DKK1 | P75T-E | Human | Esophagus | ESCC | 5.85e-77 | 3.21e+00 | 0.1125 |
| 22943 | DKK1 | HCC1_Meng | Human | Liver | HCC | 2.16e-04 | 5.67e-02 | 0.0246 |
| 22943 | DKK1 | HCC2_Meng | Human | Liver | HCC | 9.68e-04 | 7.19e-02 | 0.0107 |
| 22943 | DKK1 | HCC1 | Human | Liver | HCC | 9.85e-15 | 5.25e+00 | 0.5336 |
| 22943 | DKK1 | S014 | Human | Liver | HCC | 3.59e-72 | 4.31e+00 | 0.2254 |
| 22943 | DKK1 | S015 | Human | Liver | HCC | 2.35e-72 | 5.11e+00 | 0.2375 |
| 22943 | DKK1 | S016 | Human | Liver | HCC | 6.22e-87 | 4.91e+00 | 0.2243 |
| 22943 | DKK1 | C04 | Human | Oral cavity | OSCC | 1.96e-20 | 1.90e+00 | 0.2633 |
| 22943 | DKK1 | C21 | Human | Oral cavity | OSCC | 4.43e-57 | 2.92e+00 | 0.2678 |
| 22943 | DKK1 | C30 | Human | Oral cavity | OSCC | 2.19e-41 | 2.91e+00 | 0.3055 |
| 22943 | DKK1 | C07 | Human | Oral cavity | OSCC | 9.93e-03 | 2.11e+00 | 0.2491 |
| 22943 | DKK1 | C08 | Human | Oral cavity | OSCC | 2.14e-31 | 1.28e+00 | 0.1919 |
| Page: 1 2 3 |
| Tissue | Expression Dynamics | Abbreviation |
| Esophagus | 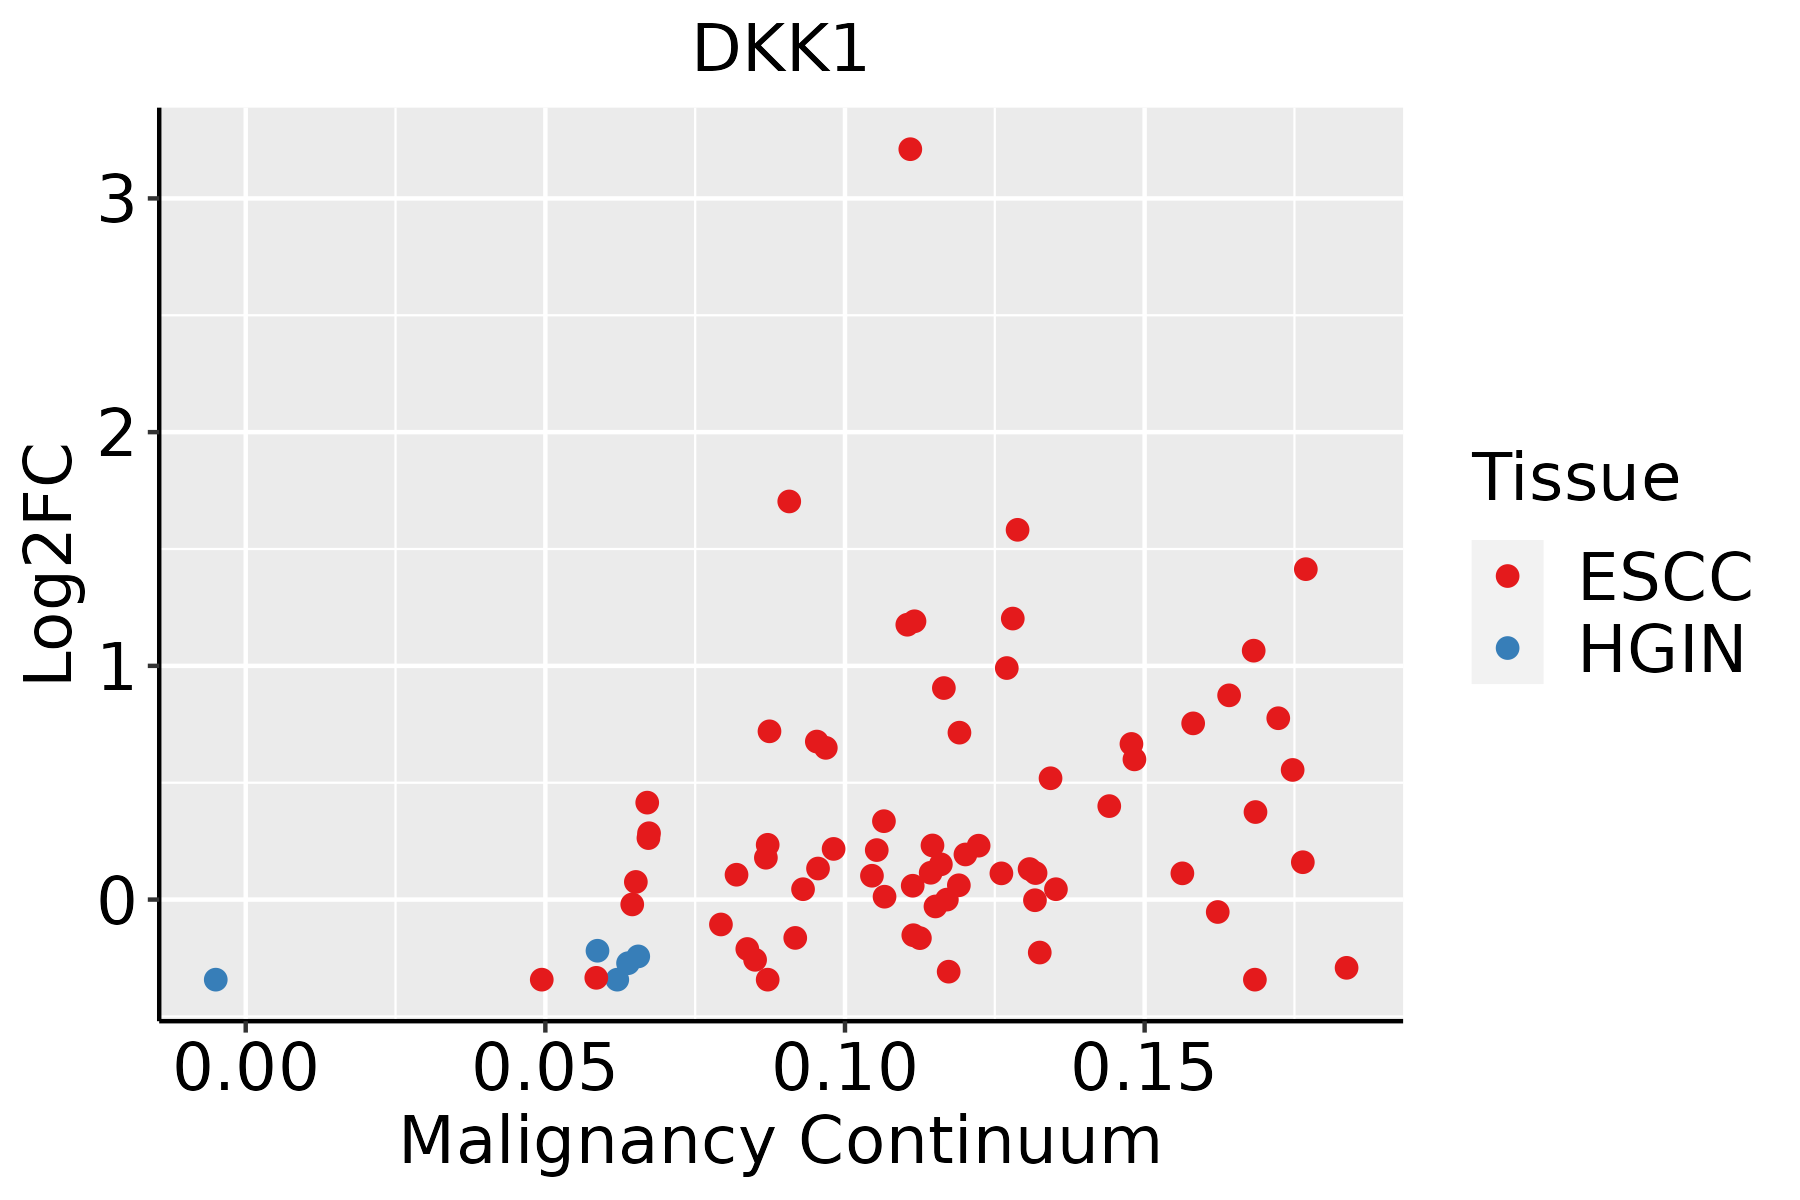 | ESCC: Esophageal squamous cell carcinoma |
| HGIN: High-grade intraepithelial neoplasias | ||
| LGIN: Low-grade intraepithelial neoplasias | ||
| Liver | 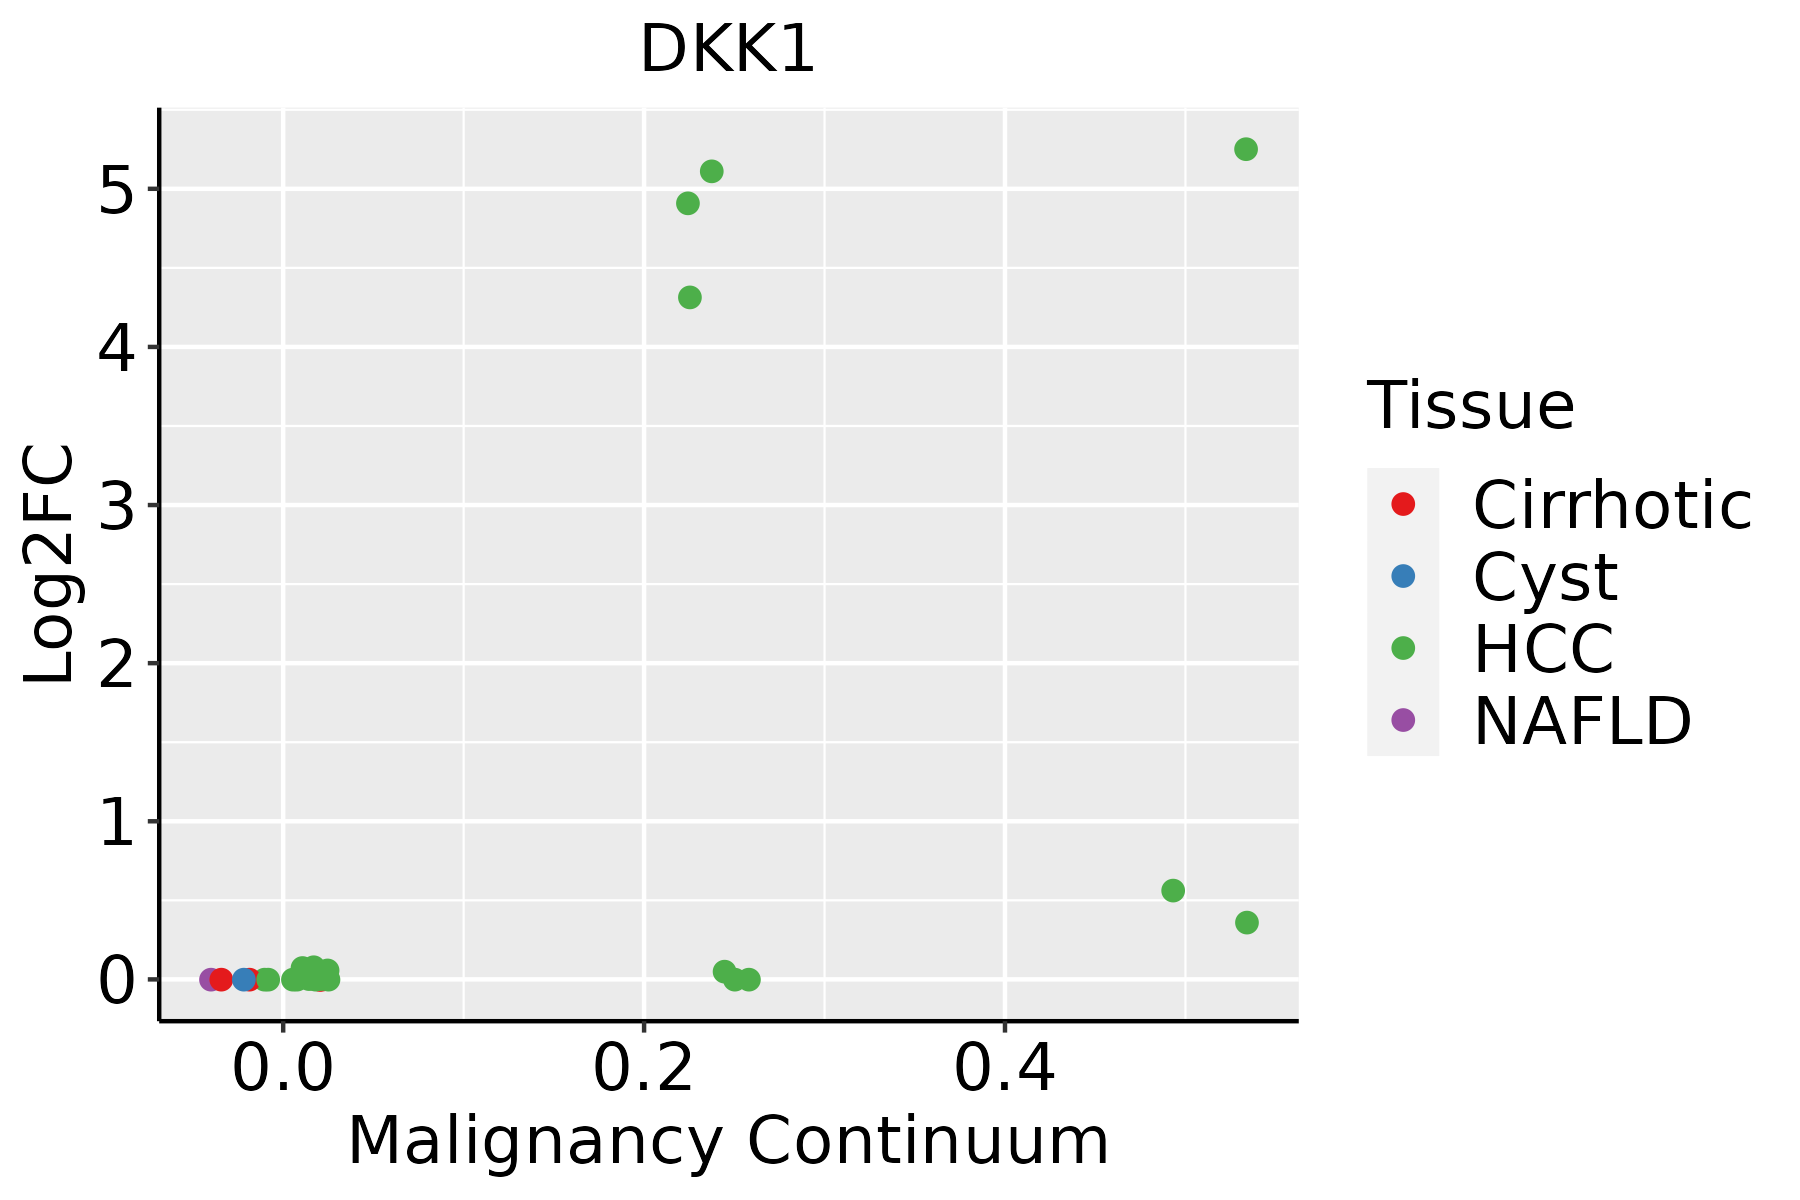 | HCC: Hepatocellular carcinoma |
| NAFLD: Non-alcoholic fatty liver disease | ||
| Oral Cavity | 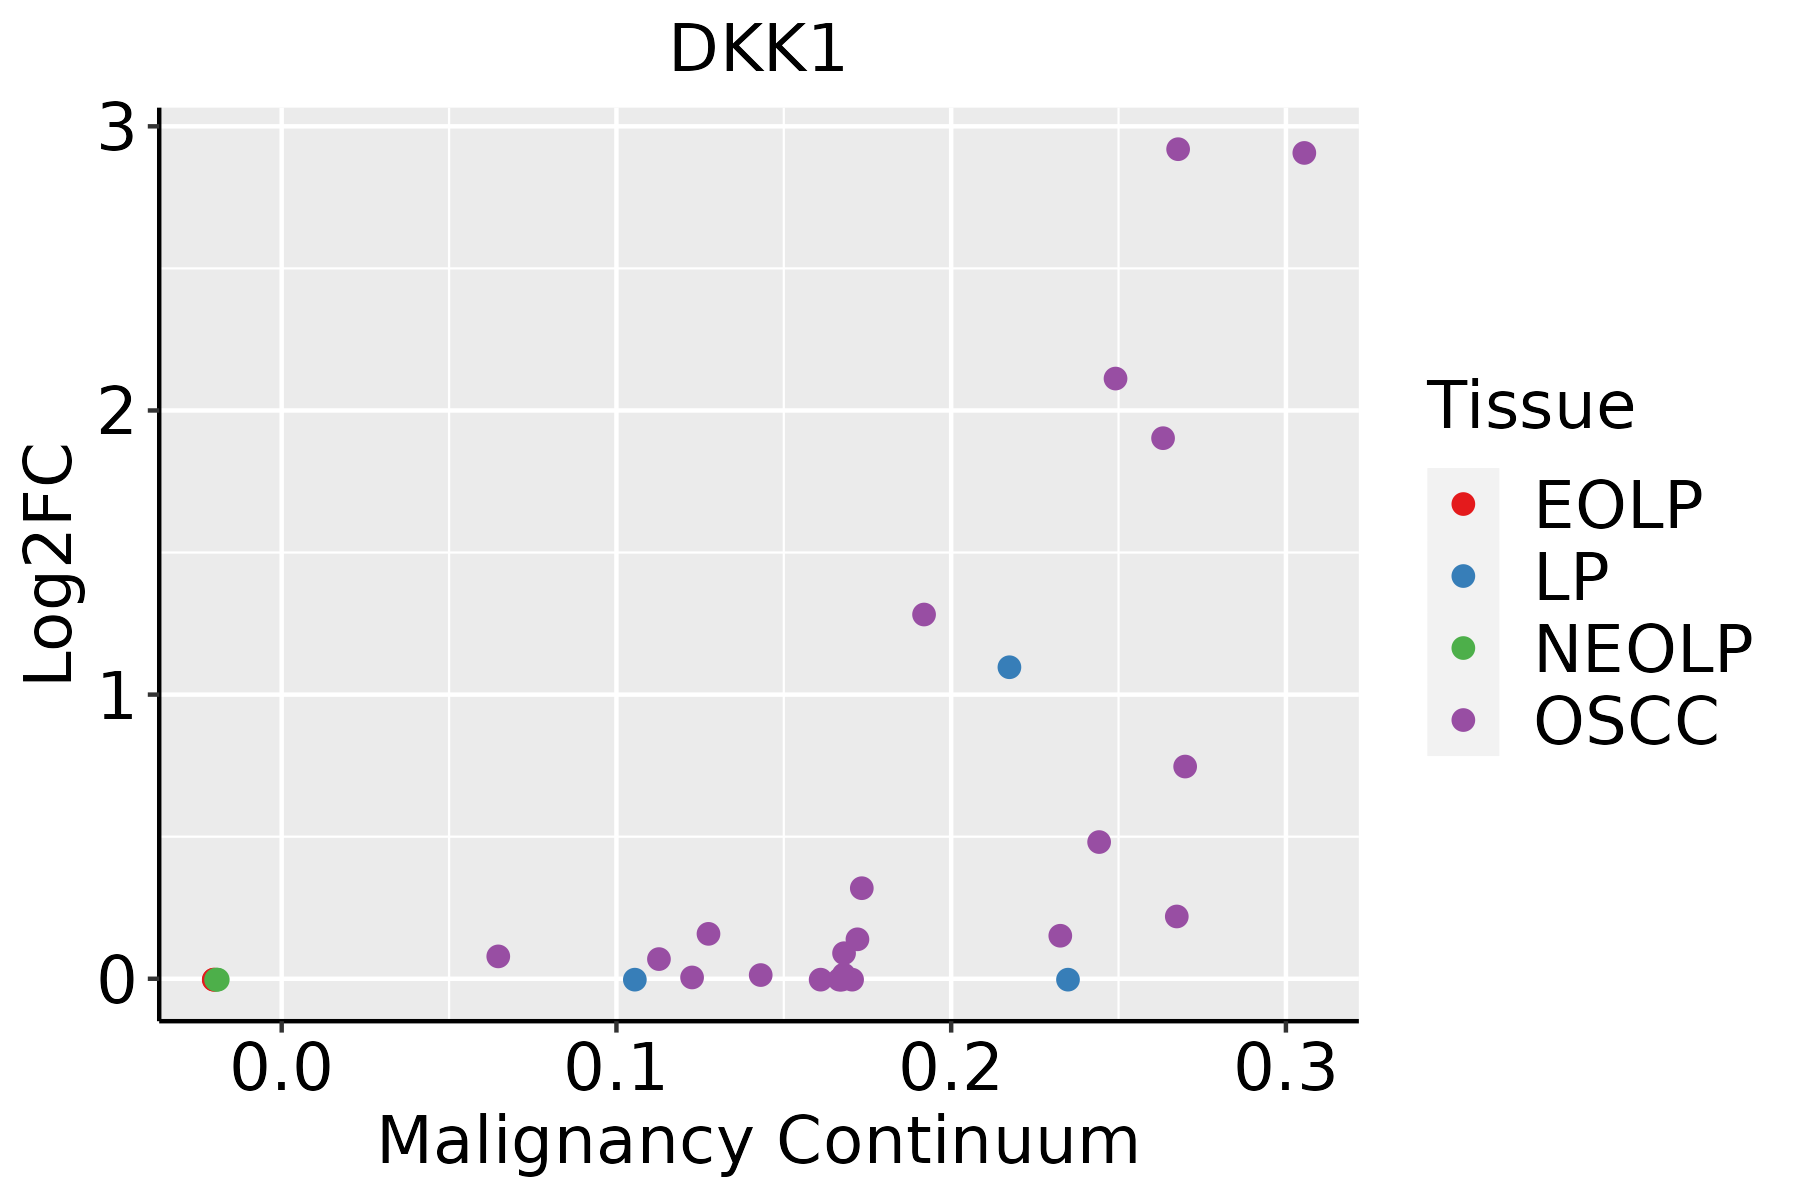 | EOLP: Erosive Oral lichen planus |
| LP: leukoplakia | ||
| NEOLP: Non-erosive oral lichen planus | ||
| OSCC: Oral squamous cell carcinoma | ||
| Prostate |  | BPH: Benign Prostatic Hyperplasia |
| Thyroid |  | ATC: Anaplastic thyroid cancer |
| HT: Hashimoto's thyroiditis | ||
| PTC: Papillary thyroid cancer |
| ∗log2FC in expression of this searched gene in stem-like cells from each diseased tissue sample relative to stem-like cells in normal samples in each tissue plotted against the malignancy continuum. Samples are colored based on if they are from different disease stage. |
Top |
Malignant transformation related pathway analysis |
| Find out the enriched GO biological processes and KEGG pathways involved in transition from healthy to precancer to cancer |
| Tissue | Disease Stage | Enriched GO biological Processes |
| Colorectum | AD |  |
| Colorectum | SER |  |
| Colorectum | MSS |  |
| Colorectum | MSI-H |  |
| Colorectum | FAP |  |
| ∗Top 15 enriched GO BP terms are showed in the bar plot of each disease state in each tissue. Each row represents a significant GO biological process which is colored according to the -log10(p.adjust). |
| Page: 1 2 3 4 5 6 7 8 9 |
| GO ID | Tissue | Disease Stage | Description | Gene Ratio | Bg Ratio | pvalue | p.adjust | Count |
| GO:0022411111 | Esophagus | ESCC | cellular component disassembly | 305/8552 | 443/18723 | 1.94e-23 | 4.57e-21 | 305 |
| GO:0051098111 | Esophagus | ESCC | regulation of binding | 251/8552 | 363/18723 | 6.73e-20 | 8.46e-18 | 251 |
| GO:0043254111 | Esophagus | ESCC | regulation of protein-containing complex assembly | 278/8552 | 428/18723 | 3.81e-16 | 2.77e-14 | 278 |
| GO:0010563111 | Esophagus | ESCC | negative regulation of phosphorus metabolic process | 274/8552 | 442/18723 | 2.32e-12 | 9.41e-11 | 274 |
| GO:0045936111 | Esophagus | ESCC | negative regulation of phosphate metabolic process | 273/8552 | 441/18723 | 3.18e-12 | 1.25e-10 | 273 |
| GO:007190016 | Esophagus | ESCC | regulation of protein serine/threonine kinase activity | 227/8552 | 359/18723 | 1.12e-11 | 4.10e-10 | 227 |
| GO:004339320 | Esophagus | ESCC | regulation of protein binding | 135/8552 | 196/18723 | 3.69e-11 | 1.22e-09 | 135 |
| GO:0042326111 | Esophagus | ESCC | negative regulation of phosphorylation | 237/8552 | 385/18723 | 1.86e-10 | 5.33e-09 | 237 |
| GO:001605517 | Esophagus | ESCC | Wnt signaling pathway | 268/8552 | 444/18723 | 2.32e-10 | 6.58e-09 | 268 |
| GO:019873817 | Esophagus | ESCC | cell-cell signaling by wnt | 269/8552 | 446/18723 | 2.41e-10 | 6.79e-09 | 269 |
| GO:0001933111 | Esophagus | ESCC | negative regulation of protein phosphorylation | 213/8552 | 342/18723 | 3.54e-10 | 9.76e-09 | 213 |
| GO:0051100111 | Esophagus | ESCC | negative regulation of binding | 109/8552 | 162/18723 | 2.10e-08 | 4.03e-07 | 109 |
| GO:0070997111 | Esophagus | ESCC | neuron death | 216/8552 | 361/18723 | 3.49e-08 | 6.45e-07 | 216 |
| GO:003010018 | Esophagus | ESCC | regulation of endocytosis | 135/8552 | 211/18723 | 5.75e-08 | 1.02e-06 | 135 |
| GO:000756820 | Esophagus | ESCC | aging | 201/8552 | 339/18723 | 2.64e-07 | 3.94e-06 | 201 |
| GO:003011117 | Esophagus | ESCC | regulation of Wnt signaling pathway | 194/8552 | 328/18723 | 5.39e-07 | 7.14e-06 | 194 |
| GO:006007016 | Esophagus | ESCC | canonical Wnt signaling pathway | 180/8552 | 303/18723 | 9.15e-07 | 1.17e-05 | 180 |
| GO:006082817 | Esophagus | ESCC | regulation of canonical Wnt signaling pathway | 153/8552 | 253/18723 | 1.38e-06 | 1.67e-05 | 153 |
| GO:00719029 | Esophagus | ESCC | positive regulation of protein serine/threonine kinase activity | 124/8552 | 200/18723 | 2.27e-06 | 2.61e-05 | 124 |
| GO:000150317 | Esophagus | ESCC | ossification | 232/8552 | 408/18723 | 3.00e-06 | 3.40e-05 | 232 |
| Page: 1 2 3 4 5 6 7 8 9 10 11 12 13 14 15 16 17 18 |
| Pathway ID | Tissue | Disease Stage | Description | Gene Ratio | Bg Ratio | pvalue | p.adjust | qvalue | Count |
| hsa05022210 | Esophagus | ESCC | Pathways of neurodegeneration - multiple diseases | 318/4205 | 476/8465 | 6.10e-15 | 2.04e-13 | 1.05e-13 | 318 |
| hsa05010210 | Esophagus | ESCC | Alzheimer disease | 263/4205 | 384/8465 | 1.80e-14 | 5.47e-13 | 2.80e-13 | 263 |
| hsa0502238 | Esophagus | ESCC | Pathways of neurodegeneration - multiple diseases | 318/4205 | 476/8465 | 6.10e-15 | 2.04e-13 | 1.05e-13 | 318 |
| hsa0501038 | Esophagus | ESCC | Alzheimer disease | 263/4205 | 384/8465 | 1.80e-14 | 5.47e-13 | 2.80e-13 | 263 |
| hsa0501022 | Liver | HCC | Alzheimer disease | 254/4020 | 384/8465 | 3.75e-14 | 8.97e-13 | 4.99e-13 | 254 |
| hsa0502222 | Liver | HCC | Pathways of neurodegeneration - multiple diseases | 298/4020 | 476/8465 | 6.59e-12 | 1.30e-10 | 7.22e-11 | 298 |
| hsa0501032 | Liver | HCC | Alzheimer disease | 254/4020 | 384/8465 | 3.75e-14 | 8.97e-13 | 4.99e-13 | 254 |
| hsa0502232 | Liver | HCC | Pathways of neurodegeneration - multiple diseases | 298/4020 | 476/8465 | 6.59e-12 | 1.30e-10 | 7.22e-11 | 298 |
| hsa0501028 | Oral cavity | OSCC | Alzheimer disease | 244/3704 | 384/8465 | 1.18e-15 | 3.60e-14 | 1.83e-14 | 244 |
| hsa0502228 | Oral cavity | OSCC | Pathways of neurodegeneration - multiple diseases | 292/3704 | 476/8465 | 1.60e-15 | 4.47e-14 | 2.28e-14 | 292 |
| hsa05010112 | Oral cavity | OSCC | Alzheimer disease | 244/3704 | 384/8465 | 1.18e-15 | 3.60e-14 | 1.83e-14 | 244 |
| hsa05022112 | Oral cavity | OSCC | Pathways of neurodegeneration - multiple diseases | 292/3704 | 476/8465 | 1.60e-15 | 4.47e-14 | 2.28e-14 | 292 |
| hsa0501029 | Oral cavity | LP | Alzheimer disease | 197/2418 | 384/8465 | 6.66e-22 | 3.69e-20 | 2.38e-20 | 197 |
| hsa0502229 | Oral cavity | LP | Pathways of neurodegeneration - multiple diseases | 232/2418 | 476/8465 | 7.77e-22 | 3.69e-20 | 2.38e-20 | 232 |
| hsa0501037 | Oral cavity | LP | Alzheimer disease | 197/2418 | 384/8465 | 6.66e-22 | 3.69e-20 | 2.38e-20 | 197 |
| hsa0502237 | Oral cavity | LP | Pathways of neurodegeneration - multiple diseases | 232/2418 | 476/8465 | 7.77e-22 | 3.69e-20 | 2.38e-20 | 232 |
| hsa0501026 | Prostate | BPH | Alzheimer disease | 165/1718 | 384/8465 | 4.03e-25 | 1.66e-23 | 1.03e-23 | 165 |
| hsa0502226 | Prostate | BPH | Pathways of neurodegeneration - multiple diseases | 180/1718 | 476/8465 | 7.70e-20 | 1.81e-18 | 1.12e-18 | 180 |
| hsa0431014 | Prostate | BPH | Wnt signaling pathway | 50/1718 | 171/8465 | 3.11e-03 | 1.15e-02 | 7.14e-03 | 50 |
| hsa05010111 | Prostate | BPH | Alzheimer disease | 165/1718 | 384/8465 | 4.03e-25 | 1.66e-23 | 1.03e-23 | 165 |
| Page: 1 2 |
Top |
Cell-cell communication analysis |
| Identification of potential cell-cell interactions between two cell types and their ligand-receptor pairs for different disease states |
| Ligand | Receptor | LRpair | Pathway | Tissue | Disease Stage |
| Page: 1 |
Top |
Single-cell gene regulatory network inference analysis |
| Find out the significant the regulons (TFs) and the target genes of each regulon across cell types for different disease states |
| TF | Cell Type | Tissue | Disease Stage | Target Gene | RSS | Regulon Activity |
| ∗The dot plots of a searched regulon are shown for all cell subpopulations in each disease state of each tissue based on the regulon specific score inferred using pySCENIC and by calculating the average expression. |
| Page: 1 |
Top |
Somatic mutation of malignant transformation related genes |
| Annotation of somatic variants for genes involved in malignant transformation |
| Hugo Symbol | Variant Class | Variant Classification | dbSNP RS | HGVSc | HGVSp | HGVSp Short | SWISSPROT | BIOTYPE | SIFT | PolyPhen | Tumor Sample Barcode | Tissue | Histology | Sex | Age | Stage | Therapy Types | Drugs | Outcome |
| DKK1 | SNV | Missense_Mutation | novel | c.424G>A | p.Asp142Asn | p.D142N | O94907 | protein_coding | deleterious(0.04) | benign(0.026) | TCGA-BH-A28O-01 | Breast | breast invasive carcinoma | Female | <65 | III/IV | Chemotherapy | cytoxan | CR |
| DKK1 | SNV | Missense_Mutation | rs761830028 | c.187N>A | p.Ala63Thr | p.A63T | O94907 | protein_coding | tolerated(0.38) | benign(0.001) | TCGA-A6-3809-01 | Colorectum | colon adenocarcinoma | Female | >=65 | I/II | Unknown | Unknown | SD |
| DKK1 | SNV | Missense_Mutation | rs138915253 | c.358N>T | p.Arg120Cys | p.R120C | O94907 | protein_coding | deleterious(0) | probably_damaging(0.999) | TCGA-A6-5665-01 | Colorectum | colon adenocarcinoma | Female | >=65 | I/II | Unknown | Unknown | PD |
| DKK1 | SNV | Missense_Mutation | c.292N>A | p.Ala98Thr | p.A98T | O94907 | protein_coding | tolerated(0.33) | benign(0.15) | TCGA-AA-3821-01 | Colorectum | colon adenocarcinoma | Female | >=65 | I/II | Unknown | Unknown | SD | |
| DKK1 | SNV | Missense_Mutation | rs145640971 | c.121G>A | p.Ala41Thr | p.A41T | O94907 | protein_coding | deleterious(0) | benign(0.28) | TCGA-AA-3947-01 | Colorectum | colon adenocarcinoma | Female | <65 | I/II | Unknown | Unknown | SD |
| DKK1 | SNV | Missense_Mutation | c.539N>C | p.His180Pro | p.H180P | O94907 | protein_coding | tolerated(0.3) | possibly_damaging(0.731) | TCGA-AA-A03F-01 | Colorectum | colon adenocarcinoma | Female | >=65 | III/IV | Unknown | Unknown | PD | |
| DKK1 | SNV | Missense_Mutation | rs759707601 | c.707N>A | p.Arg236His | p.R236H | O94907 | protein_coding | deleterious(0) | probably_damaging(0.997) | TCGA-CA-6719-01 | Colorectum | colon adenocarcinoma | Male | >=65 | I/II | Unknown | Unknown | PD |
| DKK1 | SNV | Missense_Mutation | novel | c.632N>C | p.Lys211Thr | p.K211T | O94907 | protein_coding | deleterious(0) | probably_damaging(0.997) | TCGA-AG-3892-01 | Colorectum | rectum adenocarcinoma | Female | <65 | I/II | Unknown | Unknown | SD |
| DKK1 | SNV | Missense_Mutation | novel | c.436N>C | p.Phe146Leu | p.F146L | O94907 | protein_coding | tolerated(0.5) | benign(0) | TCGA-A5-A0G2-01 | Endometrium | uterine corpus endometrioid carcinoma | Female | <65 | III/IV | Unknown | Unknown | SD |
| DKK1 | SNV | Missense_Mutation | c.373G>A | p.Ala125Thr | p.A125T | O94907 | protein_coding | tolerated(0.08) | benign(0.044) | TCGA-AP-A056-01 | Endometrium | uterine corpus endometrioid carcinoma | Female | <65 | I/II | Unknown | Unknown | SD |
| Page: 1 2 3 4 5 |
Top |
Related drugs of malignant transformation related genes |
| Identification of chemicals and drugs interact with genes involved in malignant transfromation |
| (DGIdb 4.0) |
| Entrez ID | Symbol | Category | Interaction Types | Drug Claim Name | Drug Name | PMIDs |
| 22943 | DKK1 | GROWTH FACTOR, DRUGGABLE GENOME, DRUG RESISTANCE | FLUOROURACIL | FLUOROURACIL | 25788273 | |
| 22943 | DKK1 | GROWTH FACTOR, DRUGGABLE GENOME, DRUG RESISTANCE | PROTEASOME INHIBITOR | 17910634 | ||
| 22943 | DKK1 | GROWTH FACTOR, DRUGGABLE GENOME, DRUG RESISTANCE | DHT | ANDROSTANOLONE | 17657240 | |
| 22943 | DKK1 | GROWTH FACTOR, DRUGGABLE GENOME, DRUG RESISTANCE | PF-04840082 | |||
| 22943 | DKK1 | GROWTH FACTOR, DRUGGABLE GENOME, DRUG RESISTANCE | PMID27539678-Compound-8 | |||
| 22943 | DKK1 | GROWTH FACTOR, DRUGGABLE GENOME, DRUG RESISTANCE | PMID27539678-Compound-3 | |||
| 22943 | DKK1 | GROWTH FACTOR, DRUGGABLE GENOME, DRUG RESISTANCE | Imidamide derivative 1 | |||
| 22943 | DKK1 | GROWTH FACTOR, DRUGGABLE GENOME, DRUG RESISTANCE | OXALIPLATIN | OXALIPLATIN | 25788273 | |
| 22943 | DKK1 | GROWTH FACTOR, DRUGGABLE GENOME, DRUG RESISTANCE | 2-piperidine thiazole derivative 2 | |||
| 22943 | DKK1 | GROWTH FACTOR, DRUGGABLE GENOME, DRUG RESISTANCE | 2-piperidine thiazole derivative 1 |
| Page: 1 2 |

Copyright 2023-Present -The University of Texas Health Science Center at Houston |