| Tissue | Expression Dynamics | Abbreviation |
| Colorectum (GSE201348) | 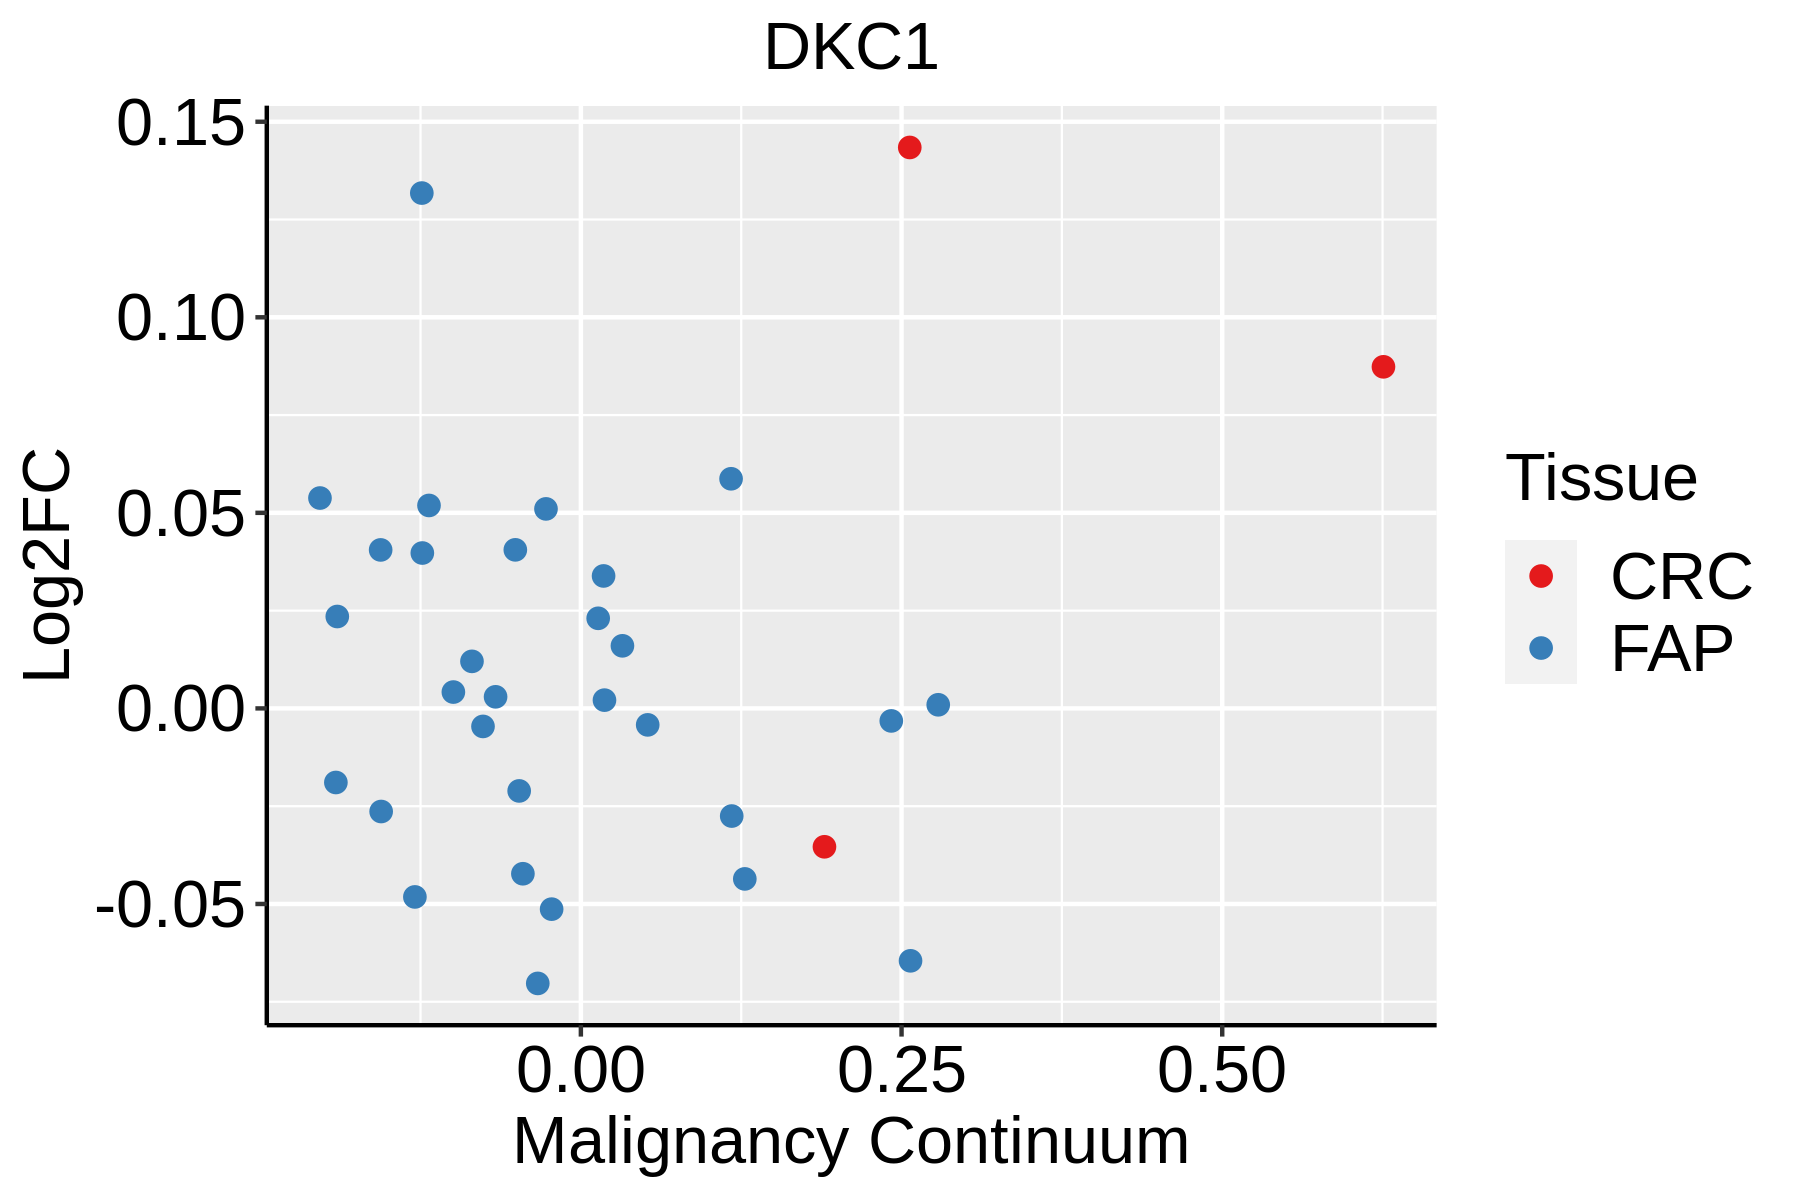 | FAP: Familial adenomatous polyposis |
| CRC: Colorectal cancer |
| Colorectum (HTA11) | 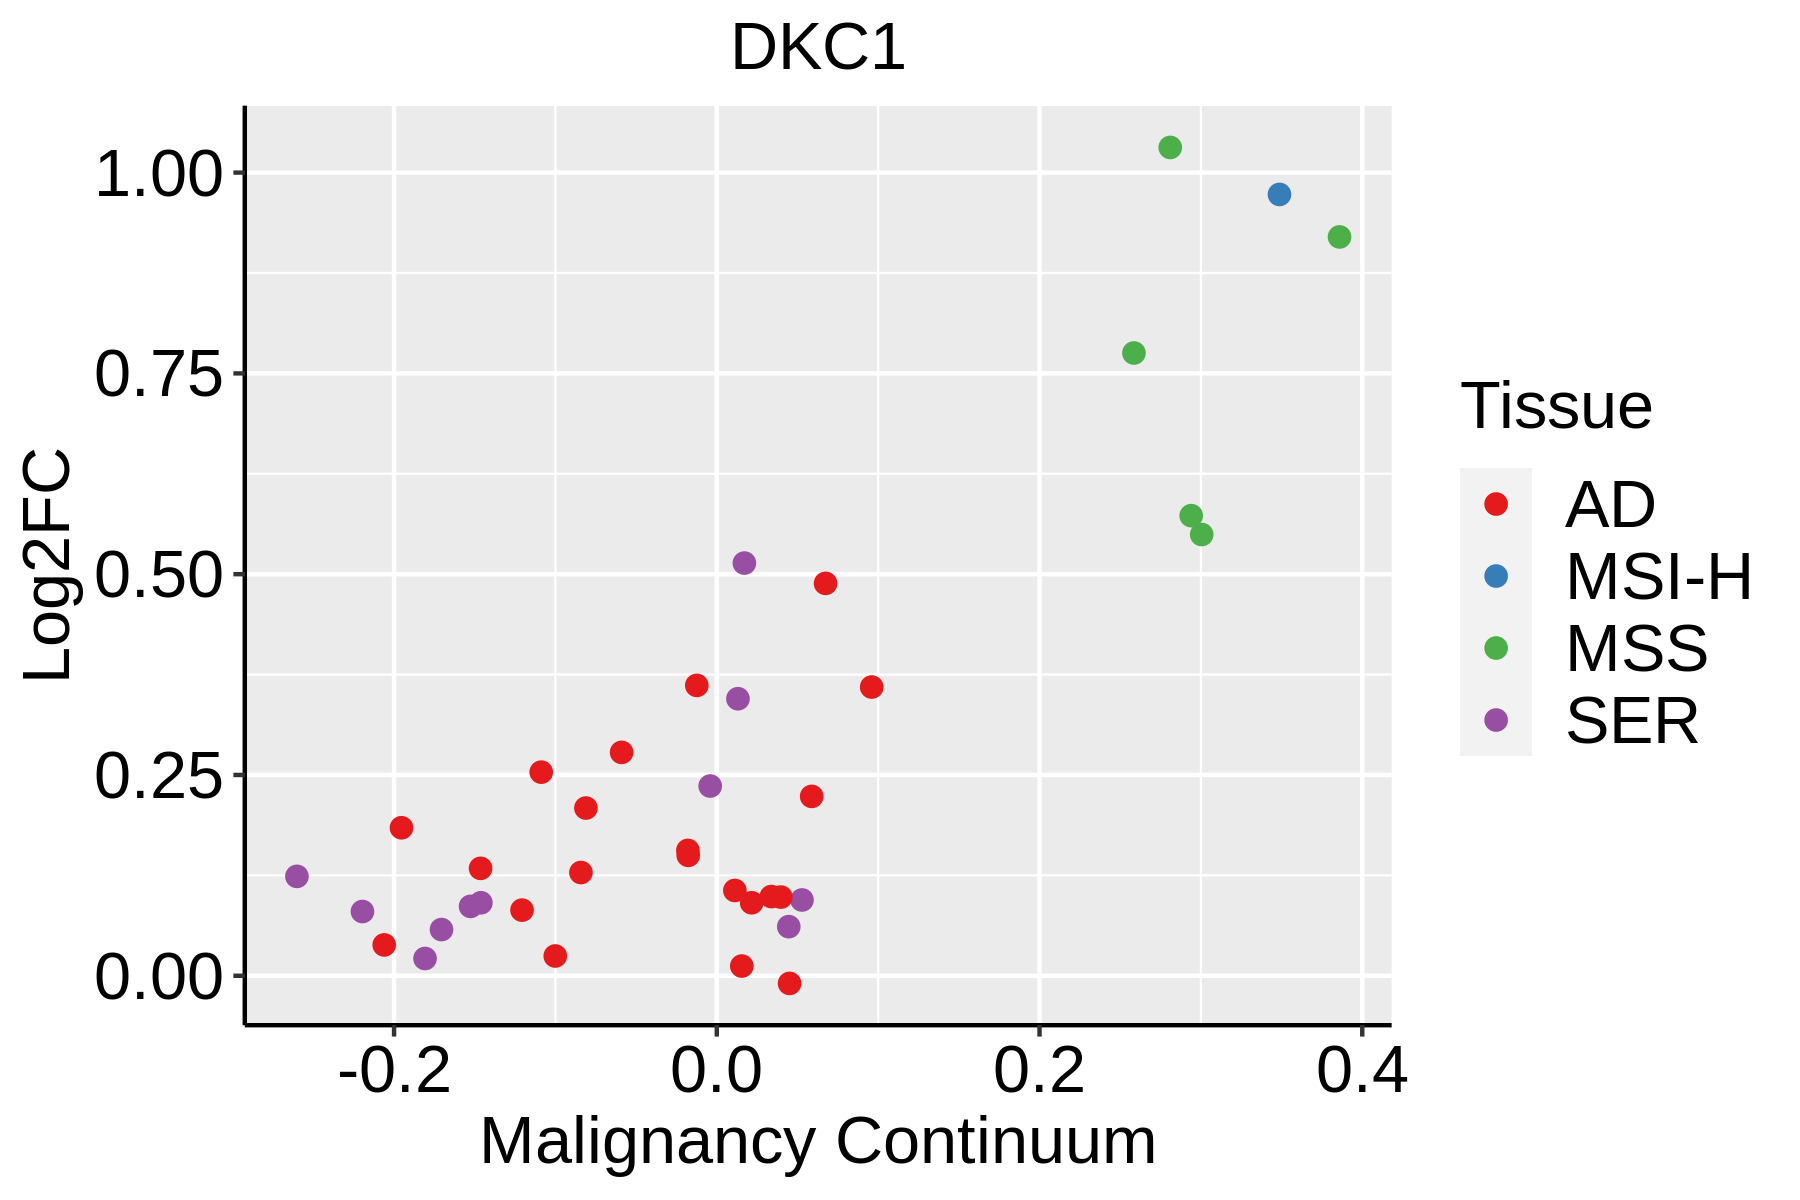 | AD: Adenomas |
| SER: Sessile serrated lesions |
| MSI-H: Microsatellite-high colorectal cancer |
| MSS: Microsatellite stable colorectal cancer |
| Esophagus | 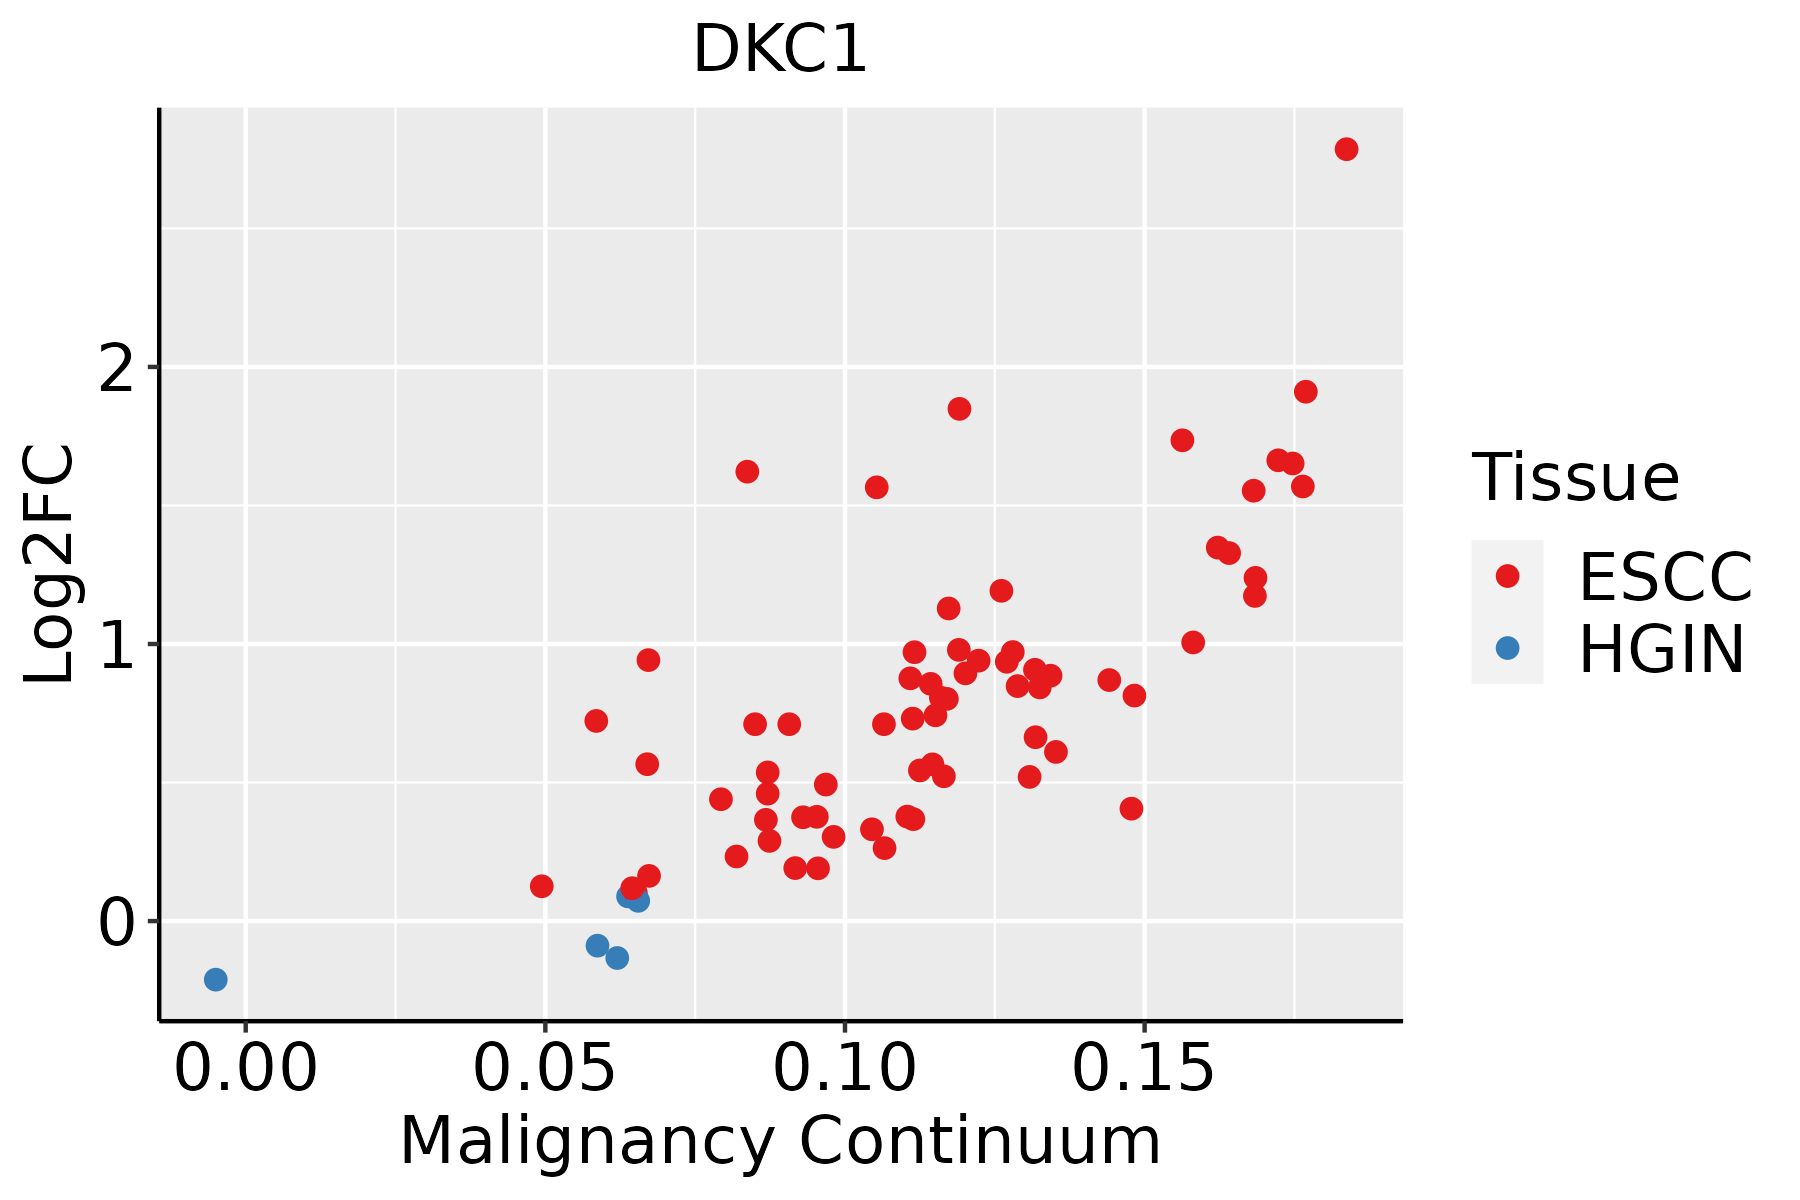 | ESCC: Esophageal squamous cell carcinoma |
| HGIN: High-grade intraepithelial neoplasias |
| LGIN: Low-grade intraepithelial neoplasias |
| Liver | 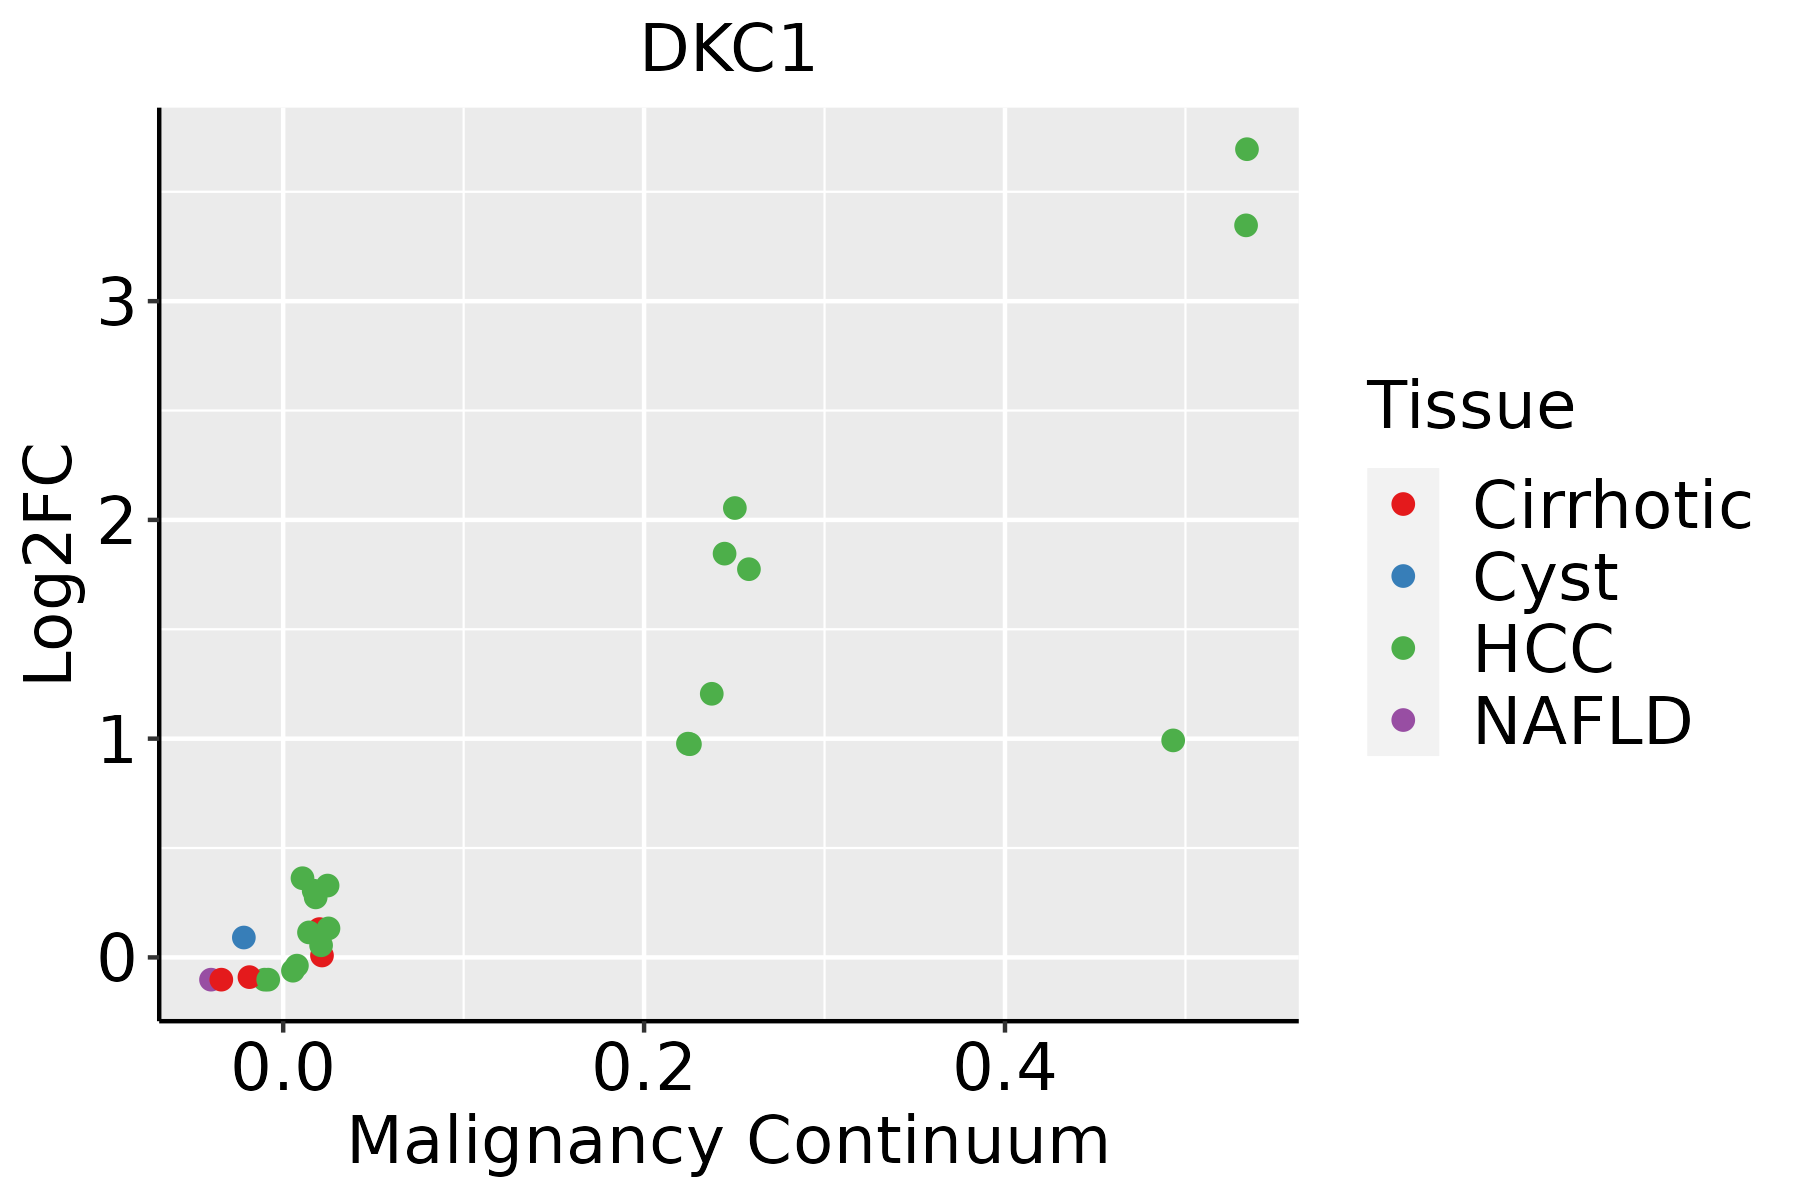 | HCC: Hepatocellular carcinoma |
| NAFLD: Non-alcoholic fatty liver disease |
| Oral Cavity | 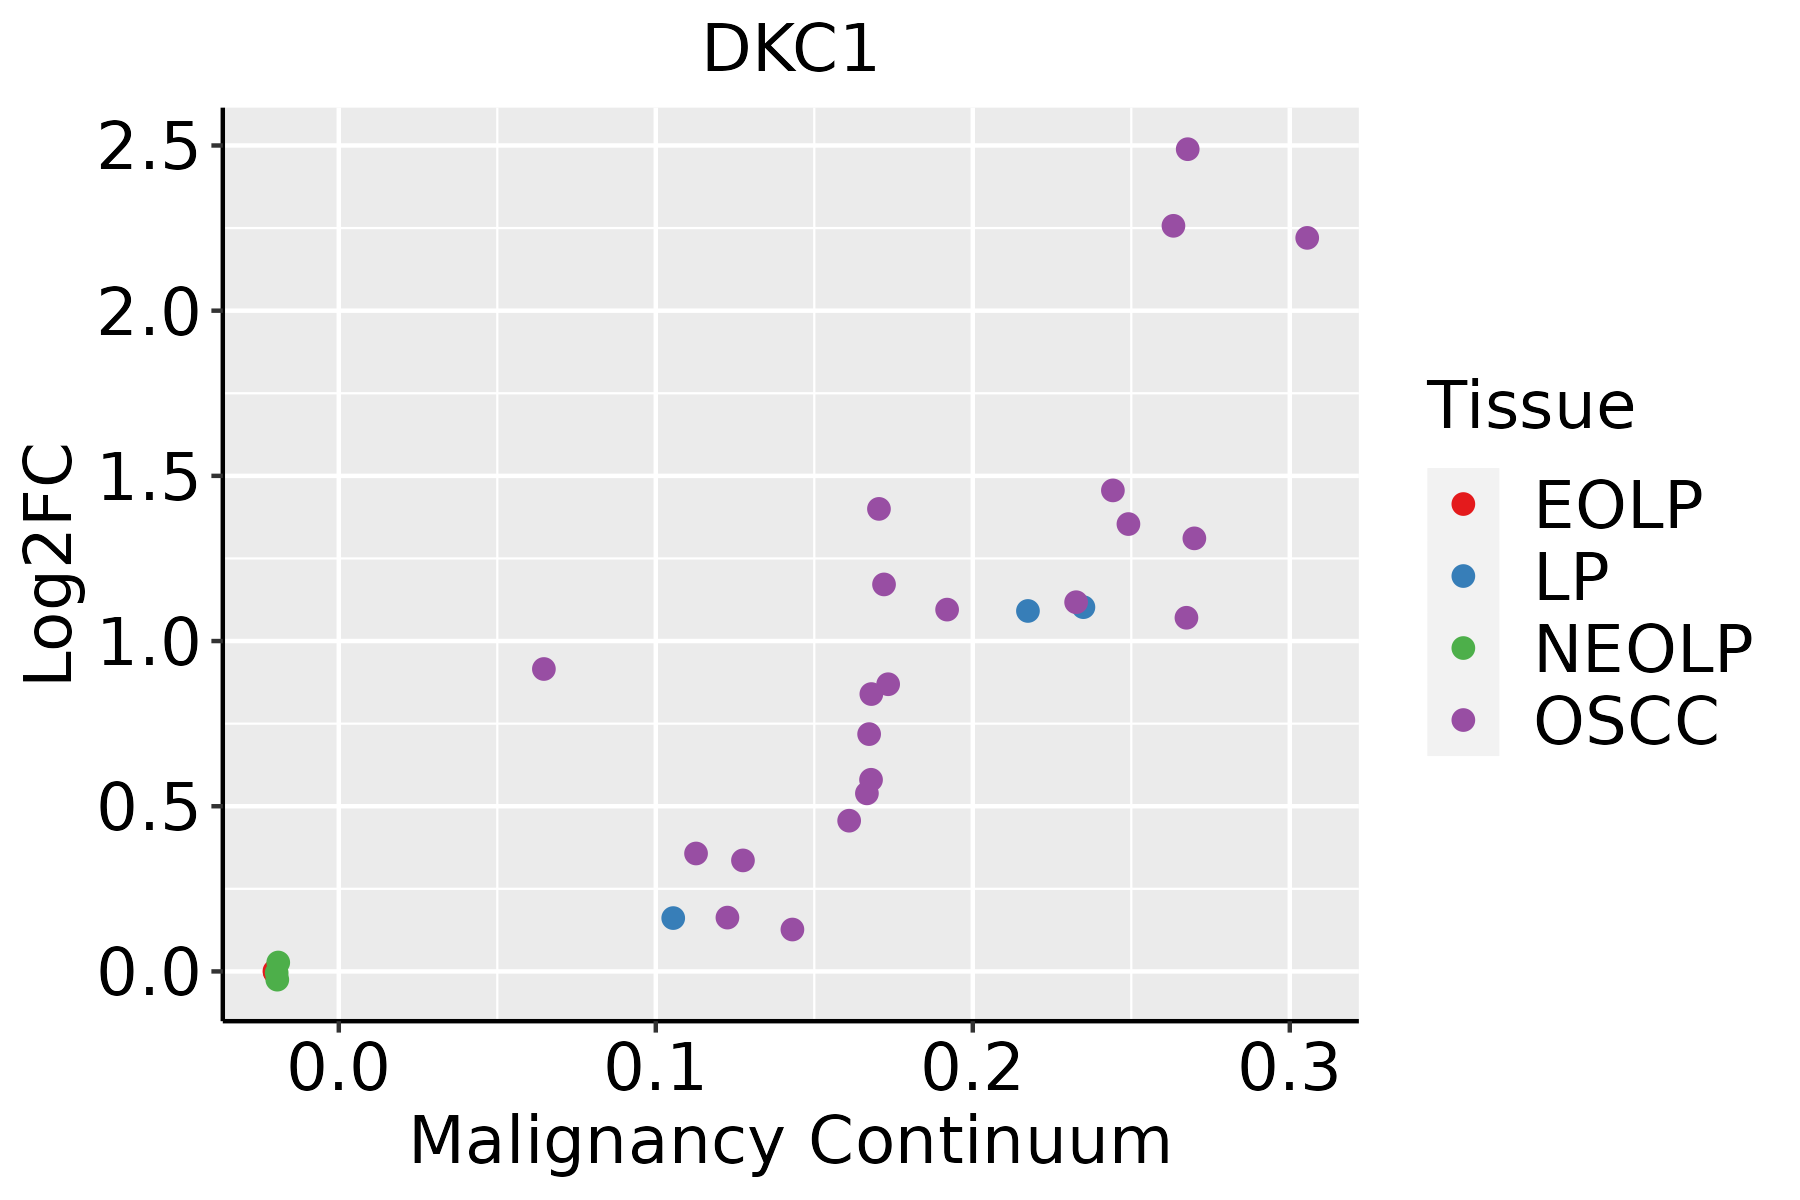 | EOLP: Erosive Oral lichen planus |
| LP: leukoplakia |
| NEOLP: Non-erosive oral lichen planus |
| OSCC: Oral squamous cell carcinoma |
| Skin |  | AK: Actinic keratosis |
| cSCC: Cutaneous squamous cell carcinoma |
| SCCIS:squamous cell carcinoma in situ |
| Thyroid |  | ATC: Anaplastic thyroid cancer |
| HT: Hashimoto's thyroiditis |
| PTC: Papillary thyroid cancer |
| GO ID | Tissue | Disease Stage | Description | Gene Ratio | Bg Ratio | pvalue | p.adjust | Count |
| GO:0009895 | Colorectum | AD | negative regulation of catabolic process | 124/3918 | 320/18723 | 1.66e-13 | 3.35e-11 | 124 |
| GO:1903829 | Colorectum | AD | positive regulation of cellular protein localization | 110/3918 | 276/18723 | 4.58e-13 | 8.44e-11 | 110 |
| GO:0031330 | Colorectum | AD | negative regulation of cellular catabolic process | 104/3918 | 262/18723 | 2.66e-12 | 3.96e-10 | 104 |
| GO:0072594 | Colorectum | AD | establishment of protein localization to organelle | 148/3918 | 422/18723 | 7.95e-12 | 1.04e-09 | 148 |
| GO:0006401 | Colorectum | AD | RNA catabolic process | 102/3918 | 278/18723 | 8.64e-10 | 6.76e-08 | 102 |
| GO:0022613 | Colorectum | AD | ribonucleoprotein complex biogenesis | 151/3918 | 463/18723 | 1.96e-09 | 1.39e-07 | 151 |
| GO:1904951 | Colorectum | AD | positive regulation of establishment of protein localization | 112/3918 | 319/18723 | 2.55e-09 | 1.80e-07 | 112 |
| GO:0044270 | Colorectum | AD | cellular nitrogen compound catabolic process | 147/3918 | 451/18723 | 3.35e-09 | 2.23e-07 | 147 |
| GO:0046700 | Colorectum | AD | heterocycle catabolic process | 145/3918 | 445/18723 | 4.37e-09 | 2.84e-07 | 145 |
| GO:0034655 | Colorectum | AD | nucleobase-containing compound catabolic process | 133/3918 | 407/18723 | 1.56e-08 | 9.12e-07 | 133 |
| GO:0019439 | Colorectum | AD | aromatic compound catabolic process | 146/3918 | 467/18723 | 7.48e-08 | 3.84e-06 | 146 |
| GO:1901361 | Colorectum | AD | organic cyclic compound catabolic process | 153/3918 | 495/18723 | 8.23e-08 | 4.18e-06 | 153 |
| GO:1900180 | Colorectum | AD | regulation of protein localization to nucleus | 55/3918 | 136/18723 | 1.70e-07 | 7.34e-06 | 55 |
| GO:0051052 | Colorectum | AD | regulation of DNA metabolic process | 116/3918 | 359/18723 | 2.47e-07 | 1.00e-05 | 116 |
| GO:0051054 | Colorectum | AD | positive regulation of DNA metabolic process | 73/3918 | 201/18723 | 3.27e-07 | 1.29e-05 | 73 |
| GO:0043487 | Colorectum | AD | regulation of RNA stability | 63/3918 | 170/18723 | 9.17e-07 | 3.12e-05 | 63 |
| GO:1900182 | Colorectum | AD | positive regulation of protein localization to nucleus | 38/3918 | 87/18723 | 1.43e-06 | 4.52e-05 | 38 |
| GO:0006403 | Colorectum | AD | RNA localization | 71/3918 | 201/18723 | 1.54e-06 | 4.76e-05 | 71 |
| GO:0034504 | Colorectum | AD | protein localization to nucleus | 94/3918 | 290/18723 | 2.83e-06 | 8.09e-05 | 94 |
| GO:2001252 | Colorectum | AD | positive regulation of chromosome organization | 35/3918 | 82/18723 | 6.90e-06 | 1.72e-04 | 35 |
| Hugo Symbol | Variant Class | Variant Classification | dbSNP RS | HGVSc | HGVSp | HGVSp Short | SWISSPROT | BIOTYPE | SIFT | PolyPhen | Tumor Sample Barcode | Tissue | Histology | Sex | Age | Stage | Therapy Types | Drugs | Outcome |
| DKC1 | SNV | Missense_Mutation | novel | c.601G>A | p.Glu201Lys | p.E201K | O60832 | protein_coding | deleterious(0.03) | benign(0.094) | TCGA-AN-A046-01 | Breast | breast invasive carcinoma | Female | >=65 | I/II | Unknown | Unknown | SD |
| DKC1 | SNV | Missense_Mutation | | c.58N>G | p.Lys20Glu | p.K20E | O60832 | protein_coding | deleterious_low_confidence(0.02) | benign(0.196) | TCGA-AR-A0TW-01 | Breast | breast invasive carcinoma | Female | <65 | III/IV | Chemotherapy | doxorubicin | PD |
| DKC1 | SNV | Missense_Mutation | | c.39N>G | p.His13Gln | p.H13Q | O60832 | protein_coding | tolerated_low_confidence(0.12) | benign(0.048) | TCGA-AR-A24H-01 | Breast | breast invasive carcinoma | Female | >=65 | I/II | Hormone Therapy | tamoxiphen | SD |
| DKC1 | insertion | Frame_Shift_Ins | novel | c.558_559insCTACTCGGGAGGCTGAGGCAGGAGA | p.Ile187LeufsTer28 | p.I187Lfs*28 | O60832 | protein_coding | | | TCGA-A2-A0EQ-01 | Breast | breast invasive carcinoma | Female | <65 | I/II | Chemotherapy | adriamycin | SD |
| DKC1 | SNV | Missense_Mutation | | c.1378N>T | p.Pro460Ser | p.P460S | O60832 | protein_coding | tolerated_low_confidence(0.11) | benign(0) | TCGA-C5-A1BJ-01 | Cervix | cervical & endocervical cancer | Female | <65 | I/II | Unknown | Unknown | SD |
| DKC1 | SNV | Missense_Mutation | novel | c.89N>C | p.Ile30Thr | p.I30T | O60832 | protein_coding | tolerated(0.14) | benign(0.017) | TCGA-5M-AAT6-01 | Colorectum | colon adenocarcinoma | Female | <65 | III/IV | Unknown | Unknown | PD |
| DKC1 | SNV | Missense_Mutation | | c.763N>G | p.Ser255Gly | p.S255G | O60832 | protein_coding | tolerated(0.61) | benign(0.009) | TCGA-AA-3977-01 | Colorectum | colon adenocarcinoma | Male | >=65 | I/II | Unknown | Unknown | SD |
| DKC1 | SNV | Missense_Mutation | | c.1106T>C | p.Val369Ala | p.V369A | O60832 | protein_coding | deleterious(0.01) | probably_damaging(0.942) | TCGA-AY-6197-01 | Colorectum | colon adenocarcinoma | Male | <65 | I/II | Unknown | Unknown | SD |
| DKC1 | SNV | Missense_Mutation | rs782117503 | c.1334N>T | p.Ala445Val | p.A445V | O60832 | protein_coding | tolerated(0.46) | benign(0) | TCGA-CM-5861-01 | Colorectum | colon adenocarcinoma | Female | <65 | I/II | Unknown | Unknown | PD |
| DKC1 | SNV | Missense_Mutation | rs782010351 | c.55N>T | p.Arg19Trp | p.R19W | O60832 | protein_coding | deleterious_low_confidence(0) | benign(0.249) | TCGA-CM-6171-01 | Colorectum | colon adenocarcinoma | Female | >=65 | I/II | Unknown | Unknown | SD |


