
|
|||||
|
 | |
| |
| |
| |
| |
| |
|
Gene: DIXDC1 |
Gene summary for DIXDC1 |
| Gene information | Species | Human | Gene symbol | DIXDC1 | Gene ID | 85458 |
| Gene name | DIX domain containing 1 | |
| Gene Alias | CCD1 | |
| Cytomap | 11q23.1 | |
| Gene Type | protein-coding | GO ID | GO:0000226 | UniProtAcc | Q155Q3 |
Top |
Malignant transformation analysis |
| Identification of the aberrant gene expression in precancerous and cancerous lesions by comparing the gene expression of stem-like cells in diseased tissues with normal stem cells |
| Entrez ID | Symbol | Replicates | Species | Organ | Tissue | Adj P-value | Log2FC | Malignancy |
| 85458 | DIXDC1 | male-WTA | Human | Thyroid | PTC | 6.65e-04 | 5.62e-02 | 0.1037 |
| 85458 | DIXDC1 | PTC01 | Human | Thyroid | PTC | 4.59e-05 | 6.71e-02 | 0.1899 |
| 85458 | DIXDC1 | PTC04 | Human | Thyroid | PTC | 7.36e-12 | 3.95e-02 | 0.1927 |
| 85458 | DIXDC1 | PTC05 | Human | Thyroid | PTC | 1.87e-04 | 3.07e-01 | 0.2065 |
| 85458 | DIXDC1 | PTC06 | Human | Thyroid | PTC | 2.36e-14 | 3.34e-01 | 0.2057 |
| 85458 | DIXDC1 | PTC07 | Human | Thyroid | PTC | 3.15e-17 | 3.03e-01 | 0.2044 |
| 85458 | DIXDC1 | ATC09 | Human | Thyroid | ATC | 1.34e-07 | 2.10e-01 | 0.2871 |
| 85458 | DIXDC1 | ATC12 | Human | Thyroid | ATC | 1.12e-13 | 2.51e-01 | 0.34 |
| 85458 | DIXDC1 | ATC13 | Human | Thyroid | ATC | 6.70e-15 | 3.15e-01 | 0.34 |
| 85458 | DIXDC1 | ATC1 | Human | Thyroid | ATC | 1.18e-07 | 2.40e-01 | 0.2878 |
| 85458 | DIXDC1 | ATC2 | Human | Thyroid | ATC | 3.45e-06 | 3.32e-01 | 0.34 |
| 85458 | DIXDC1 | ATC3 | Human | Thyroid | ATC | 3.20e-06 | 4.69e-01 | 0.338 |
| 85458 | DIXDC1 | ATC4 | Human | Thyroid | ATC | 3.47e-18 | 3.63e-01 | 0.34 |
| 85458 | DIXDC1 | ATC5 | Human | Thyroid | ATC | 4.11e-19 | 3.56e-01 | 0.34 |
| Page: 1 |
| Tissue | Expression Dynamics | Abbreviation |
| Thyroid | 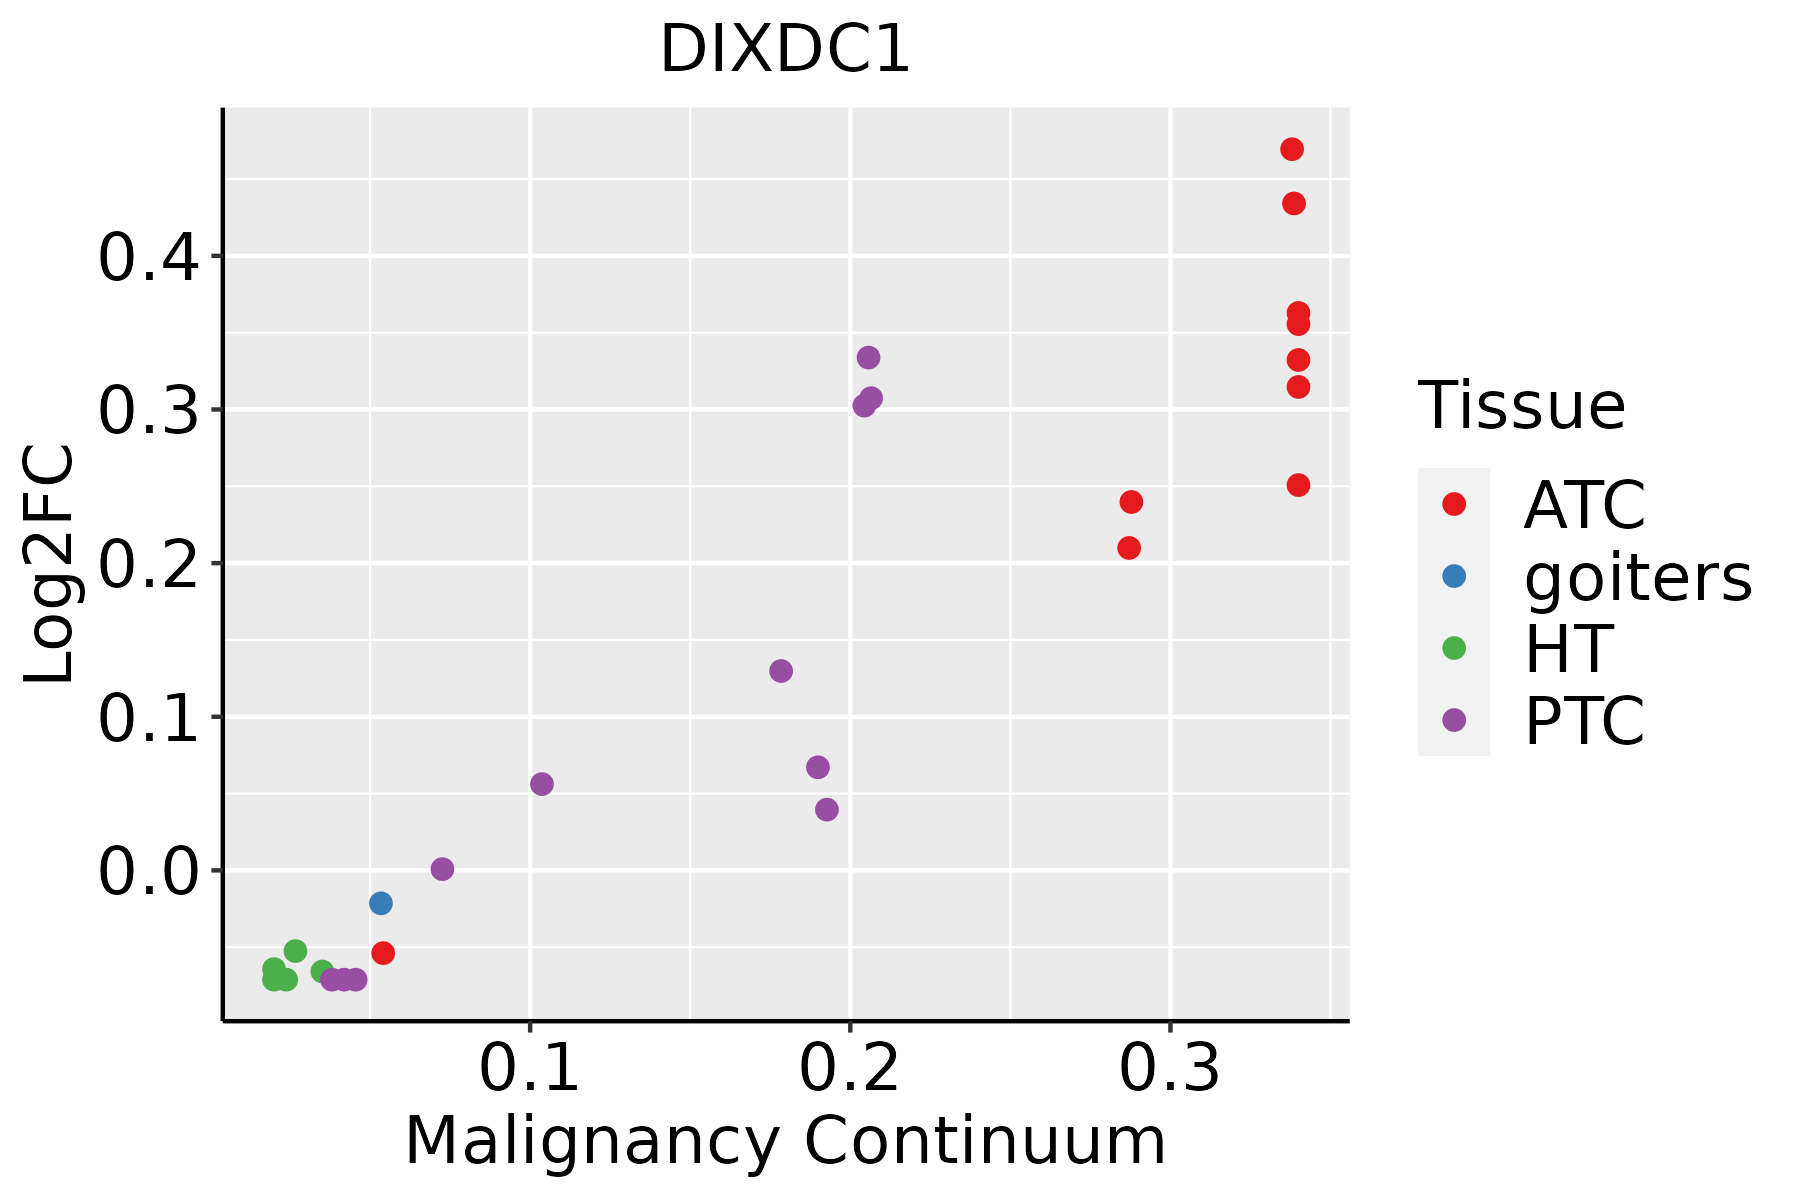 | ATC: Anaplastic thyroid cancer |
| HT: Hashimoto's thyroiditis | ||
| PTC: Papillary thyroid cancer |
| ∗log2FC in expression of this searched gene in stem-like cells from each diseased tissue sample relative to stem-like cells in normal samples in each tissue plotted against the malignancy continuum. Samples are colored based on if they are from different disease stage. |
Top |
Malignant transformation related pathway analysis |
| Find out the enriched GO biological processes and KEGG pathways involved in transition from healthy to precancer to cancer |
| Tissue | Disease Stage | Enriched GO biological Processes |
| Colorectum | AD |  |
| Colorectum | SER |  |
| Colorectum | MSS |  |
| Colorectum | MSI-H |  |
| Colorectum | FAP |  |
| ∗Top 15 enriched GO BP terms are showed in the bar plot of each disease state in each tissue. Each row represents a significant GO biological process which is colored according to the -log10(p.adjust). |
| Page: 1 2 3 4 5 6 7 8 9 |
| GO ID | Tissue | Disease Stage | Description | Gene Ratio | Bg Ratio | pvalue | p.adjust | Count |
| GO:0016055110 | Thyroid | PTC | Wnt signaling pathway | 217/5968 | 444/18723 | 3.71e-14 | 2.30e-12 | 217 |
| GO:0032956113 | Thyroid | PTC | regulation of actin cytoskeleton organization | 182/5968 | 358/18723 | 4.64e-14 | 2.79e-12 | 182 |
| GO:0198738110 | Thyroid | PTC | cell-cell signaling by wnt | 217/5968 | 446/18723 | 6.68e-14 | 3.73e-12 | 217 |
| GO:0032970113 | Thyroid | PTC | regulation of actin filament-based process | 197/5968 | 397/18723 | 8.91e-14 | 4.89e-12 | 197 |
| GO:0030111110 | Thyroid | PTC | regulation of Wnt signaling pathway | 163/5968 | 328/18723 | 1.05e-11 | 4.29e-10 | 163 |
| GO:007050717 | Thyroid | PTC | regulation of microtubule cytoskeleton organization | 80/5968 | 148/18723 | 1.79e-08 | 4.19e-07 | 80 |
| GO:0060070110 | Thyroid | PTC | canonical Wnt signaling pathway | 141/5968 | 303/18723 | 5.71e-08 | 1.21e-06 | 141 |
| GO:003017719 | Thyroid | PTC | positive regulation of Wnt signaling pathway | 72/5968 | 140/18723 | 1.16e-06 | 1.69e-05 | 72 |
| GO:00328866 | Thyroid | PTC | regulation of microtubule-based process | 105/5968 | 240/18723 | 6.91e-05 | 6.03e-04 | 105 |
| GO:00215438 | Thyroid | PTC | pallium development | 72/5968 | 169/18723 | 2.09e-03 | 1.11e-02 | 72 |
| GO:00215373 | Thyroid | PTC | telencephalon development | 100/5968 | 248/18723 | 2.90e-03 | 1.44e-02 | 100 |
| GO:002198713 | Thyroid | PTC | cerebral cortex development | 50/5968 | 114/18723 | 4.71e-03 | 2.21e-02 | 50 |
| GO:00309007 | Thyroid | PTC | forebrain development | 143/5968 | 379/18723 | 8.47e-03 | 3.56e-02 | 143 |
| GO:001605525 | Thyroid | ATC | Wnt signaling pathway | 234/6293 | 444/18723 | 4.64e-17 | 4.31e-15 | 234 |
| GO:019873825 | Thyroid | ATC | cell-cell signaling by wnt | 234/6293 | 446/18723 | 9.26e-17 | 8.25e-15 | 234 |
| GO:0032970210 | Thyroid | ATC | regulation of actin filament-based process | 208/6293 | 397/18723 | 5.82e-15 | 3.80e-13 | 208 |
| GO:0032956210 | Thyroid | ATC | regulation of actin cytoskeleton organization | 190/6293 | 358/18723 | 1.73e-14 | 1.01e-12 | 190 |
| GO:003011125 | Thyroid | ATC | regulation of Wnt signaling pathway | 177/6293 | 328/18723 | 1.83e-14 | 1.05e-12 | 177 |
| GO:006007025 | Thyroid | ATC | canonical Wnt signaling pathway | 154/6293 | 303/18723 | 3.68e-10 | 1.02e-08 | 154 |
| GO:007050723 | Thyroid | ATC | regulation of microtubule cytoskeleton organization | 85/6293 | 148/18723 | 2.17e-09 | 5.21e-08 | 85 |
| Page: 1 2 |
| Pathway ID | Tissue | Disease Stage | Description | Gene Ratio | Bg Ratio | pvalue | p.adjust | qvalue | Count |
| Page: 1 |
Top |
Cell-cell communication analysis |
| Identification of potential cell-cell interactions between two cell types and their ligand-receptor pairs for different disease states |
| Ligand | Receptor | LRpair | Pathway | Tissue | Disease Stage |
| Page: 1 |
Top |
Single-cell gene regulatory network inference analysis |
| Find out the significant the regulons (TFs) and the target genes of each regulon across cell types for different disease states |
| TF | Cell Type | Tissue | Disease Stage | Target Gene | RSS | Regulon Activity |
| ∗The dot plots of a searched regulon are shown for all cell subpopulations in each disease state of each tissue based on the regulon specific score inferred using pySCENIC and by calculating the average expression. |
| Page: 1 |
Top |
Somatic mutation of malignant transformation related genes |
| Annotation of somatic variants for genes involved in malignant transformation |
| Hugo Symbol | Variant Class | Variant Classification | dbSNP RS | HGVSc | HGVSp | HGVSp Short | SWISSPROT | BIOTYPE | SIFT | PolyPhen | Tumor Sample Barcode | Tissue | Histology | Sex | Age | Stage | Therapy Types | Drugs | Outcome |
| DIXDC1 | SNV | Missense_Mutation | novel | c.1364N>C | p.Gln455Pro | p.Q455P | Q155Q3 | protein_coding | deleterious(0.02) | possibly_damaging(0.761) | TCGA-AN-A046-01 | Breast | breast invasive carcinoma | Female | >=65 | I/II | Unknown | Unknown | SD |
| DIXDC1 | SNV | Missense_Mutation | c.1022N>T | p.Ser341Ile | p.S341I | Q155Q3 | protein_coding | deleterious(0) | probably_damaging(0.996) | TCGA-AN-A0XU-01 | Breast | breast invasive carcinoma | Female | <65 | I/II | Unknown | Unknown | SD | |
| DIXDC1 | SNV | Missense_Mutation | novel | c.1703N>T | p.Ser568Leu | p.S568L | Q155Q3 | protein_coding | deleterious(0.02) | benign(0.034) | TCGA-BH-A2L8-01 | Breast | breast invasive carcinoma | Female | <65 | I/II | Chemotherapy | cytoxan | CR |
| DIXDC1 | SNV | Missense_Mutation | rs782806367 | c.824A>G | p.Tyr275Cys | p.Y275C | Q155Q3 | protein_coding | tolerated(0.19) | benign(0) | TCGA-S3-AA11-01 | Breast | breast invasive carcinoma | Female | >=65 | I/II | Hormone Therapy | letrozole | CR |
| DIXDC1 | SNV | Missense_Mutation | c.2032N>A | p.Glu678Lys | p.E678K | Q155Q3 | protein_coding | deleterious(0) | probably_damaging(0.996) | TCGA-DR-A0ZM-01 | Cervix | cervical & endocervical cancer | Female | <65 | III/IV | Unspecific | Cisplatin | SD | |
| DIXDC1 | SNV | Missense_Mutation | c.1972N>T | p.Ile658Phe | p.I658F | Q155Q3 | protein_coding | deleterious(0) | benign(0.121) | TCGA-A6-6780-01 | Colorectum | colon adenocarcinoma | Male | >=65 | I/II | Unknown | Unknown | SD | |
| DIXDC1 | SNV | Missense_Mutation | rs782103350 | c.140N>A | p.Arg47Gln | p.R47Q | Q155Q3 | protein_coding | deleterious(0) | probably_damaging(0.994) | TCGA-AA-3984-01 | Colorectum | colon adenocarcinoma | Female | <65 | I/II | Unknown | Unknown | SD |
| DIXDC1 | SNV | Missense_Mutation | rs782795876 | c.308C>T | p.Ser103Leu | p.S103L | Q155Q3 | protein_coding | deleterious(0) | probably_damaging(0.994) | TCGA-DM-A28E-01 | Colorectum | colon adenocarcinoma | Female | >=65 | I/II | Unknown | Unknown | SD |
| DIXDC1 | SNV | Missense_Mutation | c.934N>A | p.Gly312Arg | p.G312R | Q155Q3 | protein_coding | deleterious(0) | probably_damaging(1) | TCGA-A5-A0G2-01 | Endometrium | uterine corpus endometrioid carcinoma | Female | <65 | III/IV | Unknown | Unknown | SD | |
| DIXDC1 | SNV | Missense_Mutation | novel | c.367N>A | p.Ala123Thr | p.A123T | Q155Q3 | protein_coding | deleterious(0) | probably_damaging(0.997) | TCGA-AJ-A3EK-01 | Endometrium | uterine corpus endometrioid carcinoma | Female | <65 | I/II | Chemotherapy | carboplatin | CR |
| Page: 1 2 3 4 5 6 |
Top |
Related drugs of malignant transformation related genes |
| Identification of chemicals and drugs interact with genes involved in malignant transfromation |
| (DGIdb 4.0) |
| Entrez ID | Symbol | Category | Interaction Types | Drug Claim Name | Drug Name | PMIDs |
| Page: 1 |

Copyright 2023-Present -The University of Texas Health Science Center at Houston |