
|
|||||
|
 | |
| |
| |
| |
| |
| |
|
Gene: DIRAS3 |
Gene summary for DIRAS3 |
| Gene information | Species | Human | Gene symbol | DIRAS3 | Gene ID | 9077 |
| Gene name | DIRAS family GTPase 3 | |
| Gene Alias | ARHI | |
| Cytomap | 1p31.3 | |
| Gene Type | protein-coding | GO ID | GO:0000079 | UniProtAcc | O95661 |
Top |
Malignant transformation analysis |
| Identification of the aberrant gene expression in precancerous and cancerous lesions by comparing the gene expression of stem-like cells in diseased tissues with normal stem cells |
| Entrez ID | Symbol | Replicates | Species | Organ | Tissue | Adj P-value | Log2FC | Malignancy |
| 9077 | DIRAS3 | male-WTA | Human | Thyroid | PTC | 6.68e-25 | 2.34e-01 | 0.1037 |
| 9077 | DIRAS3 | PTC01 | Human | Thyroid | PTC | 9.97e-15 | 3.85e-01 | 0.1899 |
| 9077 | DIRAS3 | PTC04 | Human | Thyroid | PTC | 3.75e-04 | 9.06e-02 | 0.1927 |
| 9077 | DIRAS3 | PTC05 | Human | Thyroid | PTC | 1.37e-13 | 5.63e-01 | 0.2065 |
| 9077 | DIRAS3 | PTC06 | Human | Thyroid | PTC | 2.38e-24 | 6.12e-01 | 0.2057 |
| 9077 | DIRAS3 | PTC07 | Human | Thyroid | PTC | 4.42e-39 | 6.75e-01 | 0.2044 |
| 9077 | DIRAS3 | ATC5 | Human | Thyroid | ATC | 1.78e-09 | 1.56e-01 | 0.34 |
| Page: 1 |
| Tissue | Expression Dynamics | Abbreviation |
| Thyroid | 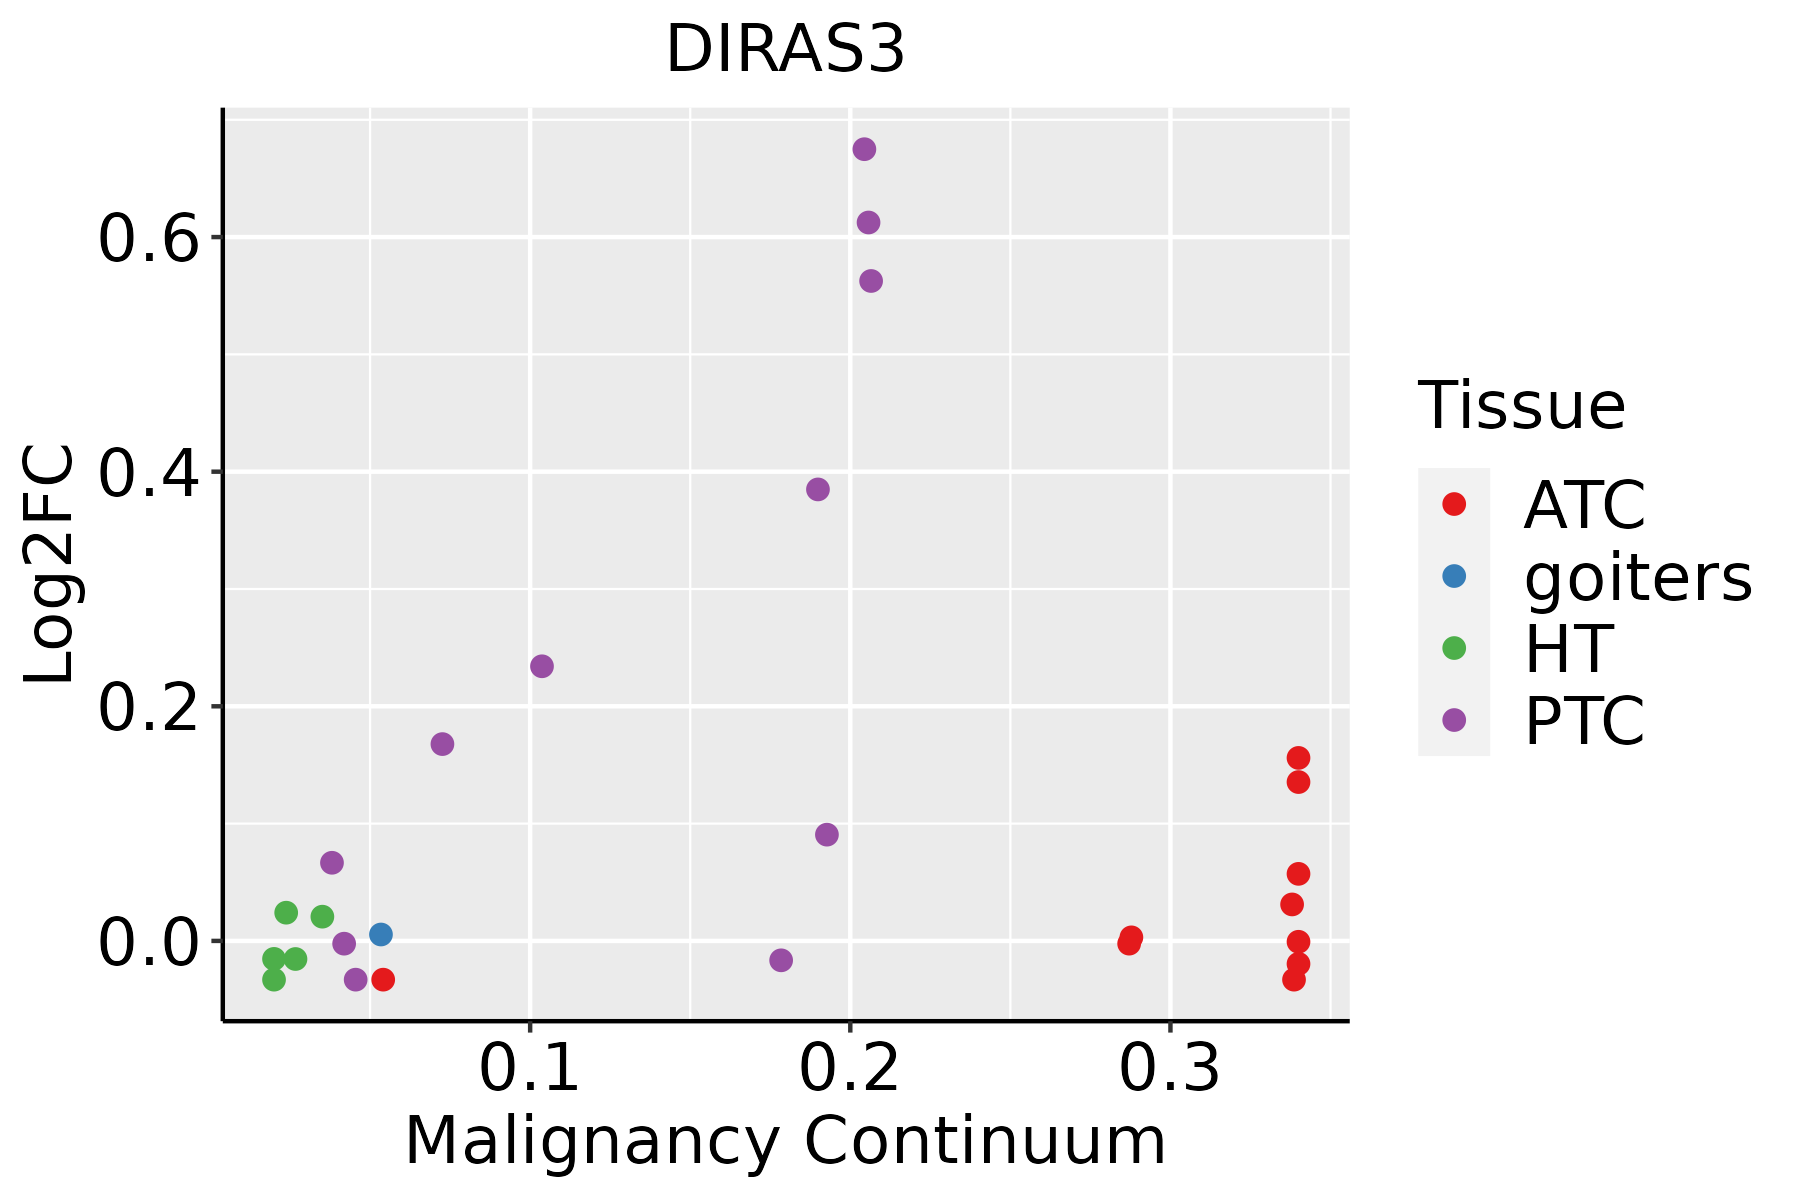 | ATC: Anaplastic thyroid cancer |
| HT: Hashimoto's thyroiditis | ||
| PTC: Papillary thyroid cancer |
| ∗log2FC in expression of this searched gene in stem-like cells from each diseased tissue sample relative to stem-like cells in normal samples in each tissue plotted against the malignancy continuum. Samples are colored based on if they are from different disease stage. |
Top |
Malignant transformation related pathway analysis |
| Find out the enriched GO biological processes and KEGG pathways involved in transition from healthy to precancer to cancer |
| Tissue | Disease Stage | Enriched GO biological Processes |
| Colorectum | AD |  |
| Colorectum | SER |  |
| Colorectum | MSS |  |
| Colorectum | MSI-H |  |
| Colorectum | FAP |  |
| ∗Top 15 enriched GO BP terms are showed in the bar plot of each disease state in each tissue. Each row represents a significant GO biological process which is colored according to the -log10(p.adjust). |
| Page: 1 2 3 4 5 6 7 8 9 |
| GO ID | Tissue | Disease Stage | Description | Gene Ratio | Bg Ratio | pvalue | p.adjust | Count |
| GO:0071900110 | Thyroid | PTC | regulation of protein serine/threonine kinase activity | 164/5968 | 359/18723 | 2.41e-08 | 5.43e-07 | 164 |
| GO:00400297 | Thyroid | PTC | regulation of gene expression, epigenetic | 57/5968 | 105/18723 | 1.60e-06 | 2.25e-05 | 57 |
| GO:190402912 | Thyroid | PTC | regulation of cyclin-dependent protein kinase activity | 49/5968 | 98/18723 | 1.40e-04 | 1.09e-03 | 49 |
| GO:000007912 | Thyroid | PTC | regulation of cyclin-dependent protein serine/threonine kinase activity | 47/5968 | 94/18723 | 1.90e-04 | 1.42e-03 | 47 |
| GO:007190025 | Thyroid | ATC | regulation of protein serine/threonine kinase activity | 176/6293 | 359/18723 | 8.35e-10 | 2.17e-08 | 176 |
| GO:004002913 | Thyroid | ATC | regulation of gene expression, epigenetic | 57/6293 | 105/18723 | 1.01e-05 | 1.00e-04 | 57 |
| GO:190402921 | Thyroid | ATC | regulation of cyclin-dependent protein kinase activity | 53/6293 | 98/18723 | 2.36e-05 | 2.06e-04 | 53 |
| GO:000007921 | Thyroid | ATC | regulation of cyclin-dependent protein serine/threonine kinase activity | 51/6293 | 94/18723 | 2.97e-05 | 2.48e-04 | 51 |
| Page: 1 |
| Pathway ID | Tissue | Disease Stage | Description | Gene Ratio | Bg Ratio | pvalue | p.adjust | qvalue | Count |
| Page: 1 |
Top |
Cell-cell communication analysis |
| Identification of potential cell-cell interactions between two cell types and their ligand-receptor pairs for different disease states |
| Ligand | Receptor | LRpair | Pathway | Tissue | Disease Stage |
| Page: 1 |
Top |
Single-cell gene regulatory network inference analysis |
| Find out the significant the regulons (TFs) and the target genes of each regulon across cell types for different disease states |
| TF | Cell Type | Tissue | Disease Stage | Target Gene | RSS | Regulon Activity |
| ∗The dot plots of a searched regulon are shown for all cell subpopulations in each disease state of each tissue based on the regulon specific score inferred using pySCENIC and by calculating the average expression. |
| Page: 1 |
Top |
Somatic mutation of malignant transformation related genes |
| Annotation of somatic variants for genes involved in malignant transformation |
| Hugo Symbol | Variant Class | Variant Classification | dbSNP RS | HGVSc | HGVSp | HGVSp Short | SWISSPROT | BIOTYPE | SIFT | PolyPhen | Tumor Sample Barcode | Tissue | Histology | Sex | Age | Stage | Therapy Types | Drugs | Outcome |
| DIRAS3 | SNV | Missense_Mutation | c.660G>T | p.Glu220Asp | p.E220D | O95661 | protein_coding | tolerated(0.25) | benign(0.042) | TCGA-AN-A046-01 | Breast | breast invasive carcinoma | Female | >=65 | I/II | Unknown | Unknown | SD | |
| DIRAS3 | insertion | In_Frame_Ins | novel | c.304_305insGTGTAG | p.Gln102delinsArgValGlu | p.Q102delinsRVE | O95661 | protein_coding | TCGA-AN-A0FS-01 | Breast | breast invasive carcinoma | Female | <65 | I/II | Unknown | Unknown | SD | ||
| DIRAS3 | insertion | Nonsense_Mutation | novel | c.302_303insTCCTATCCTGTA | p.Leu101_Gln102insProIleLeuTer | p.L101_Q102insPIL* | O95661 | protein_coding | TCGA-AN-A0FS-01 | Breast | breast invasive carcinoma | Female | <65 | I/II | Unknown | Unknown | SD | ||
| DIRAS3 | deletion | Frame_Shift_Del | novel | c.602delA | p.Lys201SerfsTer27 | p.K201Sfs*27 | O95661 | protein_coding | TCGA-D8-A27V-01 | Breast | breast invasive carcinoma | Female | <65 | I/II | Hormone Therapy | tamoxiphen | SD | ||
| DIRAS3 | SNV | Missense_Mutation | c.628N>C | p.Glu210Gln | p.E210Q | O95661 | protein_coding | tolerated(0.74) | benign(0.024) | TCGA-DR-A0ZM-01 | Cervix | cervical & endocervical cancer | Female | <65 | III/IV | Unspecific | Cisplatin | SD | |
| DIRAS3 | SNV | Missense_Mutation | c.542N>T | p.Ser181Leu | p.S181L | O95661 | protein_coding | deleterious(0.01) | probably_damaging(0.999) | TCGA-EK-A3GK-01 | Cervix | cervical & endocervical cancer | Female | <65 | I/II | Unknown | Unknown | SD | |
| DIRAS3 | SNV | Missense_Mutation | c.136G>A | p.Ala46Thr | p.A46T | O95661 | protein_coding | deleterious(0.02) | possibly_damaging(0.85) | TCGA-Q1-A73O-01 | Cervix | cervical & endocervical cancer | Female | <65 | I/II | Chemotherapy | cisplatin | CR | |
| DIRAS3 | SNV | Missense_Mutation | c.331N>A | p.Ala111Thr | p.A111T | O95661 | protein_coding | deleterious(0) | probably_damaging(0.954) | TCGA-AA-3715-01 | Colorectum | colon adenocarcinoma | Male | >=65 | I/II | Unknown | Unknown | PD | |
| DIRAS3 | SNV | Missense_Mutation | novel | c.64N>A | p.Ala22Thr | p.A22T | O95661 | protein_coding | tolerated(1) | benign(0.003) | TCGA-G4-6297-01 | Colorectum | colon adenocarcinoma | Female | <65 | III/IV | Chemotherapy | fluorouracil | PD |
| DIRAS3 | SNV | Missense_Mutation | novel | c.630N>T | p.Glu210Asp | p.E210D | O95661 | protein_coding | tolerated(0.44) | benign(0.013) | TCGA-A5-A0G2-01 | Endometrium | uterine corpus endometrioid carcinoma | Female | <65 | III/IV | Unknown | Unknown | SD |
| Page: 1 2 3 4 |
Top |
Related drugs of malignant transformation related genes |
| Identification of chemicals and drugs interact with genes involved in malignant transfromation |
| (DGIdb 4.0) |
| Entrez ID | Symbol | Category | Interaction Types | Drug Claim Name | Drug Name | PMIDs |
| Page: 1 |

Copyright 2023-Present -The University of Texas Health Science Center at Houston |