
|
|||||
|
 | |
| |
| |
| |
| |
| |
|
Gene: DIPK2A |
Gene summary for DIPK2A |
| Gene information | Species | Human | Gene symbol | DIPK2A | Gene ID | 205428 |
| Gene name | divergent protein kinase domain 2A | |
| Gene Alias | C3orf58 | |
| Cytomap | 3q24 | |
| Gene Type | protein-coding | GO ID | GO:0001932 | UniProtAcc | B3KTD4 |
Top |
Malignant transformation analysis |
| Identification of the aberrant gene expression in precancerous and cancerous lesions by comparing the gene expression of stem-like cells in diseased tissues with normal stem cells |
| Entrez ID | Symbol | Replicates | Species | Organ | Tissue | Adj P-value | Log2FC | Malignancy |
| 205428 | DIPK2A | CA_HPV_3 | Human | Cervix | CC | 1.85e-02 | 2.16e-01 | 0.0414 |
| 205428 | DIPK2A | CCI_1 | Human | Cervix | CC | 7.05e-03 | 5.46e-01 | 0.528 |
| 205428 | DIPK2A | CCI_2 | Human | Cervix | CC | 7.38e-03 | 5.32e-01 | 0.5249 |
| 205428 | DIPK2A | Tumor | Human | Cervix | CC | 9.00e-07 | -1.33e-01 | 0.1241 |
| 205428 | DIPK2A | LZE2T | Human | Esophagus | ESCC | 9.54e-06 | 6.08e-01 | 0.082 |
| 205428 | DIPK2A | LZE4T | Human | Esophagus | ESCC | 1.30e-31 | 7.02e-01 | 0.0811 |
| 205428 | DIPK2A | LZE7T | Human | Esophagus | ESCC | 6.13e-07 | 3.51e-01 | 0.0667 |
| 205428 | DIPK2A | LZE8T | Human | Esophagus | ESCC | 2.72e-03 | 1.44e-01 | 0.067 |
| 205428 | DIPK2A | LZE20T | Human | Esophagus | ESCC | 7.18e-07 | 2.71e-01 | 0.0662 |
| 205428 | DIPK2A | LZE22T | Human | Esophagus | ESCC | 1.00e-09 | 5.85e-01 | 0.068 |
| 205428 | DIPK2A | LZE24T | Human | Esophagus | ESCC | 8.18e-15 | 3.85e-01 | 0.0596 |
| 205428 | DIPK2A | LZE21T | Human | Esophagus | ESCC | 8.02e-04 | 2.54e-01 | 0.0655 |
| 205428 | DIPK2A | TD9 | Human | Lung | IAC | 2.13e-03 | 6.86e-01 | 0.088 |
| 205428 | DIPK2A | RNA-P17T-P17T-2 | Human | Lung | IAC | 2.13e-03 | 5.27e-01 | 0.3371 |
| 205428 | DIPK2A | RNA-P17T-P17T-6 | Human | Lung | IAC | 4.71e-02 | 4.11e-01 | 0.3385 |
| Page: 1 |
| Tissue | Expression Dynamics | Abbreviation |
| Cervix |  | CC: Cervix cancer |
| HSIL_HPV: HPV-infected high-grade squamous intraepithelial lesions | ||
| N_HPV: HPV-infected normal cervix | ||
| Esophagus | 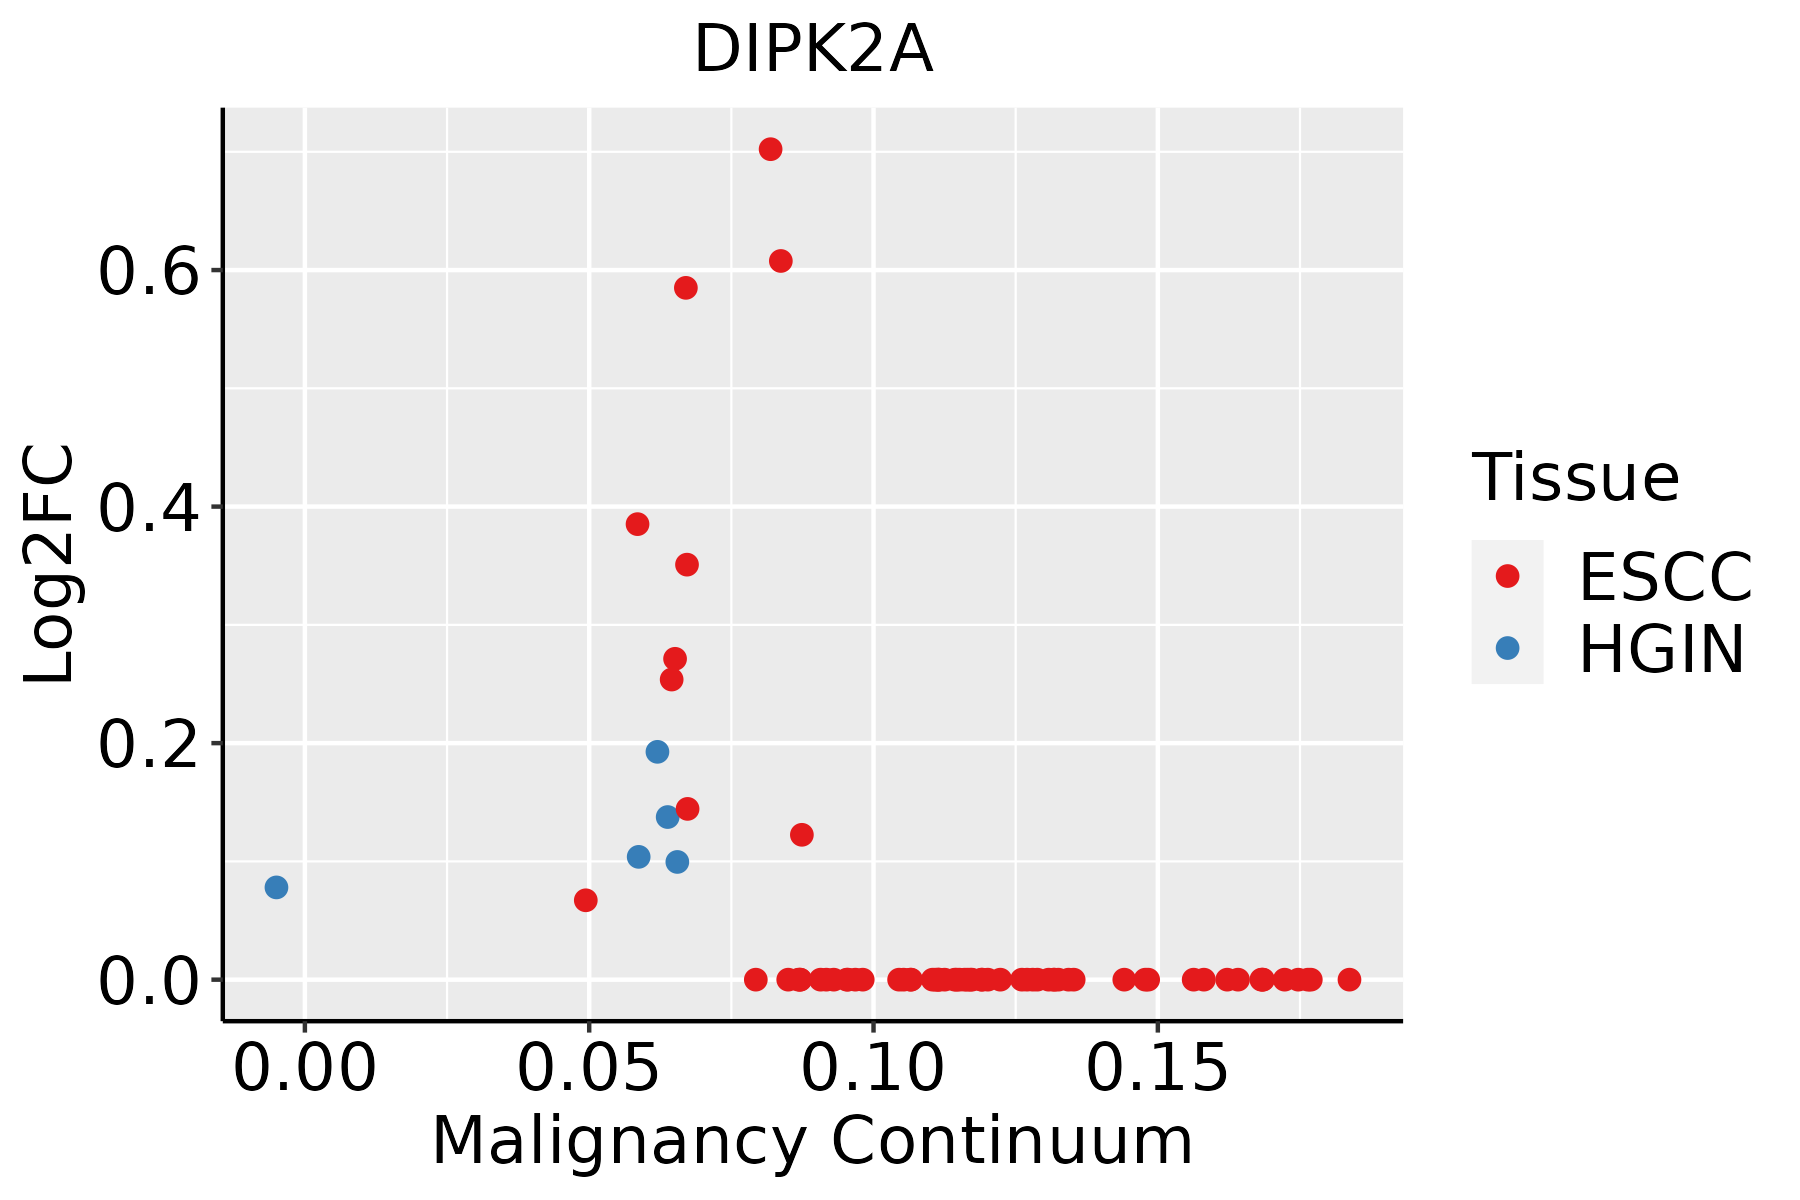 | ESCC: Esophageal squamous cell carcinoma |
| HGIN: High-grade intraepithelial neoplasias | ||
| LGIN: Low-grade intraepithelial neoplasias | ||
| Lung | 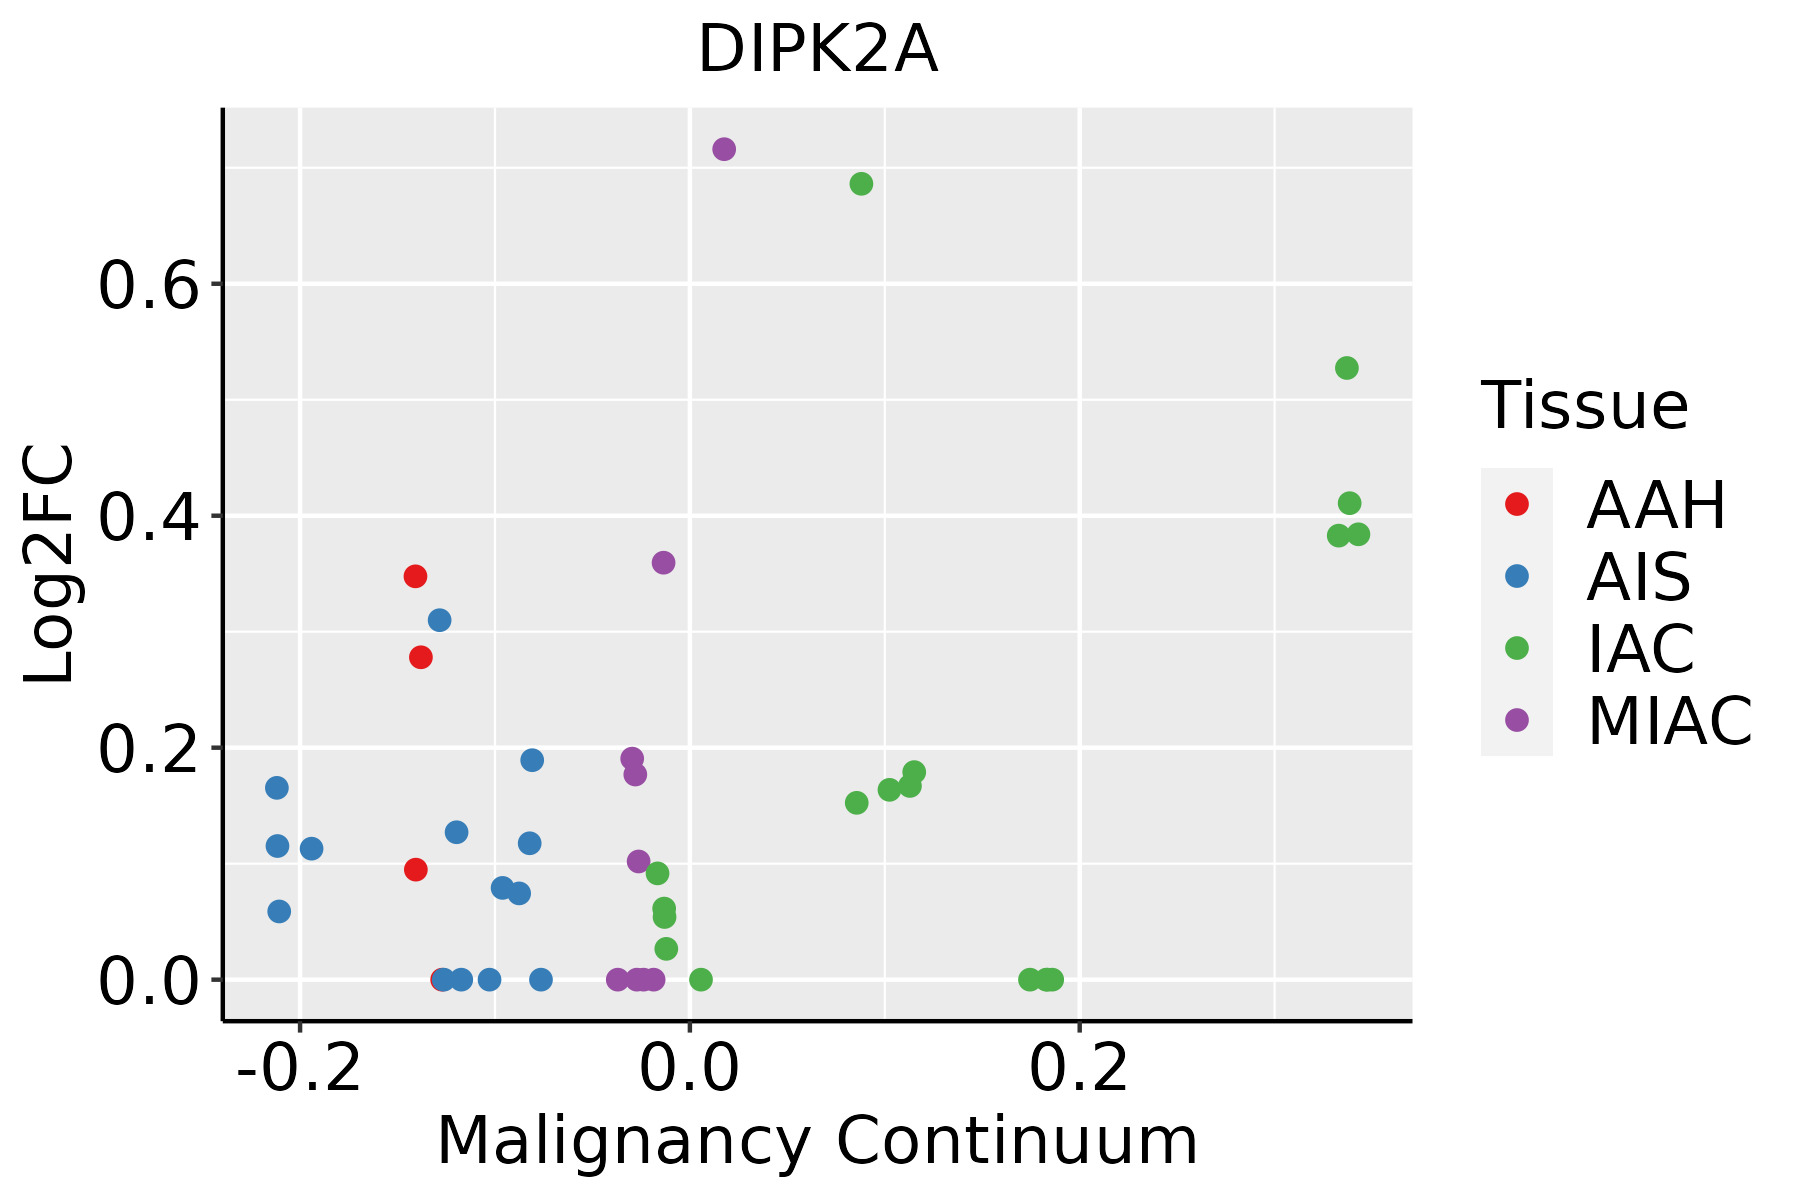 | AAH: Atypical adenomatous hyperplasia |
| AIS: Adenocarcinoma in situ | ||
| IAC: Invasive lung adenocarcinoma | ||
| MIA: Minimally invasive adenocarcinoma |
| ∗log2FC in expression of this searched gene in stem-like cells from each diseased tissue sample relative to stem-like cells in normal samples in each tissue plotted against the malignancy continuum. Samples are colored based on if they are from different disease stage. |
Top |
Malignant transformation related pathway analysis |
| Find out the enriched GO biological processes and KEGG pathways involved in transition from healthy to precancer to cancer |
| Tissue | Disease Stage | Enriched GO biological Processes |
| Colorectum | AD |  |
| Colorectum | SER |  |
| Colorectum | MSS |  |
| Colorectum | MSI-H |  |
| Colorectum | FAP |  |
| ∗Top 15 enriched GO BP terms are showed in the bar plot of each disease state in each tissue. Each row represents a significant GO biological process which is colored according to the -log10(p.adjust). |
| Page: 1 2 3 4 5 6 7 8 9 |
| GO ID | Tissue | Disease Stage | Description | Gene Ratio | Bg Ratio | pvalue | p.adjust | Count |
| GO:003367410 | Cervix | CC | positive regulation of kinase activity | 101/2311 | 467/18723 | 8.66e-09 | 7.22e-07 | 101 |
| GO:00458608 | Cervix | CC | positive regulation of protein kinase activity | 85/2311 | 386/18723 | 5.61e-08 | 3.29e-06 | 85 |
| GO:00719007 | Cervix | CC | regulation of protein serine/threonine kinase activity | 75/2311 | 359/18723 | 2.76e-06 | 8.02e-05 | 75 |
| GO:00719025 | Cervix | CC | positive regulation of protein serine/threonine kinase activity | 46/2311 | 200/18723 | 1.87e-05 | 3.47e-04 | 46 |
| GO:00605375 | Cervix | CC | muscle tissue development | 76/2311 | 403/18723 | 9.76e-05 | 1.27e-03 | 76 |
| GO:00147064 | Cervix | CC | striated muscle tissue development | 72/2311 | 384/18723 | 1.76e-04 | 2.07e-03 | 72 |
| GO:0033002 | Cervix | CC | muscle cell proliferation | 49/2311 | 248/18723 | 5.43e-04 | 5.24e-03 | 49 |
| GO:0014855 | Cervix | CC | striated muscle cell proliferation | 18/2311 | 76/18723 | 4.45e-03 | 2.71e-02 | 18 |
| GO:0014065 | Cervix | CC | phosphatidylinositol 3-kinase signaling | 28/2311 | 144/18723 | 9.50e-03 | 4.72e-02 | 28 |
| GO:007190016 | Esophagus | ESCC | regulation of protein serine/threonine kinase activity | 227/8552 | 359/18723 | 1.12e-11 | 4.10e-10 | 227 |
| GO:00719029 | Esophagus | ESCC | positive regulation of protein serine/threonine kinase activity | 124/8552 | 200/18723 | 2.27e-06 | 2.61e-05 | 124 |
| GO:004586018 | Esophagus | ESCC | positive regulation of protein kinase activity | 219/8552 | 386/18723 | 6.91e-06 | 6.97e-05 | 219 |
| GO:003367420 | Esophagus | ESCC | positive regulation of kinase activity | 260/8552 | 467/18723 | 7.26e-06 | 7.22e-05 | 260 |
| GO:006053716 | Esophagus | ESCC | muscle tissue development | 211/8552 | 403/18723 | 3.84e-03 | 1.56e-02 | 211 |
| GO:00330025 | Esophagus | ESCC | muscle cell proliferation | 134/8552 | 248/18723 | 4.80e-03 | 1.86e-02 | 134 |
| GO:001470615 | Esophagus | ESCC | striated muscle tissue development | 197/8552 | 384/18723 | 1.46e-02 | 4.74e-02 | 197 |
| GO:00719006 | Lung | IAC | regulation of protein serine/threonine kinase activity | 71/2061 | 359/18723 | 6.33e-07 | 3.72e-05 | 71 |
| GO:00458607 | Lung | IAC | positive regulation of protein kinase activity | 72/2061 | 386/18723 | 4.89e-06 | 1.96e-04 | 72 |
| GO:00719024 | Lung | IAC | positive regulation of protein serine/threonine kinase activity | 44/2061 | 200/18723 | 5.16e-06 | 2.04e-04 | 44 |
| GO:00336748 | Lung | IAC | positive regulation of kinase activity | 83/2061 | 467/18723 | 6.76e-06 | 2.45e-04 | 83 |
| Page: 1 2 |
| Pathway ID | Tissue | Disease Stage | Description | Gene Ratio | Bg Ratio | pvalue | p.adjust | qvalue | Count |
| Page: 1 |
Top |
Cell-cell communication analysis |
| Identification of potential cell-cell interactions between two cell types and their ligand-receptor pairs for different disease states |
| Ligand | Receptor | LRpair | Pathway | Tissue | Disease Stage |
| Page: 1 |
Top |
Single-cell gene regulatory network inference analysis |
| Find out the significant the regulons (TFs) and the target genes of each regulon across cell types for different disease states |
| TF | Cell Type | Tissue | Disease Stage | Target Gene | RSS | Regulon Activity |
| ∗The dot plots of a searched regulon are shown for all cell subpopulations in each disease state of each tissue based on the regulon specific score inferred using pySCENIC and by calculating the average expression. |
| Page: 1 |
Top |
Somatic mutation of malignant transformation related genes |
| Annotation of somatic variants for genes involved in malignant transformation |
| Hugo Symbol | Variant Class | Variant Classification | dbSNP RS | HGVSc | HGVSp | HGVSp Short | SWISSPROT | BIOTYPE | SIFT | PolyPhen | Tumor Sample Barcode | Tissue | Histology | Sex | Age | Stage | Therapy Types | Drugs | Outcome |
| Page: 1 |
Top |
Related drugs of malignant transformation related genes |
| Identification of chemicals and drugs interact with genes involved in malignant transfromation |
| (DGIdb 4.0) |
| Entrez ID | Symbol | Category | Interaction Types | Drug Claim Name | Drug Name | PMIDs |
| Page: 1 |

Copyright 2023-Present -The University of Texas Health Science Center at Houston |