
|
|||||
|
 | |
| |
| |
| |
| |
| |
|
Gene: DIP2C |
Gene summary for DIP2C |
| Gene information | Species | Human | Gene symbol | DIP2C | Gene ID | 22982 |
| Gene name | disco interacting protein 2 homolog C | |
| Gene Alias | KIAA0934 | |
| Cytomap | 10p15.3 | |
| Gene Type | protein-coding | GO ID | GO:0008150 | UniProtAcc | Q86XV3 |
Top |
Malignant transformation analysis |
| Identification of the aberrant gene expression in precancerous and cancerous lesions by comparing the gene expression of stem-like cells in diseased tissues with normal stem cells |
| Entrez ID | Symbol | Replicates | Species | Organ | Tissue | Adj P-value | Log2FC | Malignancy |
| 22982 | DIP2C | CA_HPV_1 | Human | Cervix | CC | 1.72e-03 | -9.24e-02 | 0.0264 |
| 22982 | DIP2C | CCI_1 | Human | Cervix | CC | 5.95e-11 | 7.74e-01 | 0.528 |
| 22982 | DIP2C | CCI_3 | Human | Cervix | CC | 1.76e-06 | 5.85e-01 | 0.516 |
| 22982 | DIP2C | HTA11_3410_2000001011 | Human | Colorectum | AD | 4.48e-14 | -5.75e-01 | 0.0155 |
| 22982 | DIP2C | HTA11_2487_2000001011 | Human | Colorectum | SER | 1.38e-03 | -4.96e-01 | -0.1808 |
| 22982 | DIP2C | HTA11_1938_2000001011 | Human | Colorectum | AD | 1.74e-02 | -5.23e-01 | -0.0811 |
| 22982 | DIP2C | HTA11_78_2000001011 | Human | Colorectum | AD | 1.04e-05 | -5.46e-01 | -0.1088 |
| 22982 | DIP2C | HTA11_3361_2000001011 | Human | Colorectum | AD | 3.07e-03 | -4.38e-01 | -0.1207 |
| 22982 | DIP2C | HTA11_696_2000001011 | Human | Colorectum | AD | 1.69e-04 | -3.08e-01 | -0.1464 |
| 22982 | DIP2C | HTA11_866_2000001011 | Human | Colorectum | AD | 3.76e-08 | -4.40e-01 | -0.1001 |
| 22982 | DIP2C | HTA11_866_3004761011 | Human | Colorectum | AD | 1.05e-04 | -4.53e-01 | 0.096 |
| 22982 | DIP2C | HTA11_10711_2000001011 | Human | Colorectum | AD | 4.88e-02 | -4.34e-01 | 0.0338 |
| 22982 | DIP2C | HTA11_99999970781_79442 | Human | Colorectum | MSS | 5.32e-11 | -4.75e-01 | 0.294 |
| 22982 | DIP2C | HTA11_99999965104_69814 | Human | Colorectum | MSS | 4.73e-07 | -6.42e-01 | 0.281 |
| 22982 | DIP2C | HTA11_99999974143_84620 | Human | Colorectum | MSS | 1.92e-13 | -4.99e-01 | 0.3005 |
| 22982 | DIP2C | F007 | Human | Colorectum | FAP | 7.94e-05 | -4.12e-01 | 0.1176 |
| 22982 | DIP2C | A002-C-010 | Human | Colorectum | FAP | 3.06e-03 | -3.17e-01 | 0.242 |
| 22982 | DIP2C | A001-C-207 | Human | Colorectum | FAP | 2.77e-05 | -3.07e-01 | 0.1278 |
| 22982 | DIP2C | A015-C-203 | Human | Colorectum | FAP | 1.08e-21 | -3.89e-01 | -0.1294 |
| 22982 | DIP2C | A015-C-204 | Human | Colorectum | FAP | 2.89e-07 | -3.66e-01 | -0.0228 |
| Page: 1 2 3 4 |
| Tissue | Expression Dynamics | Abbreviation |
| Cervix | 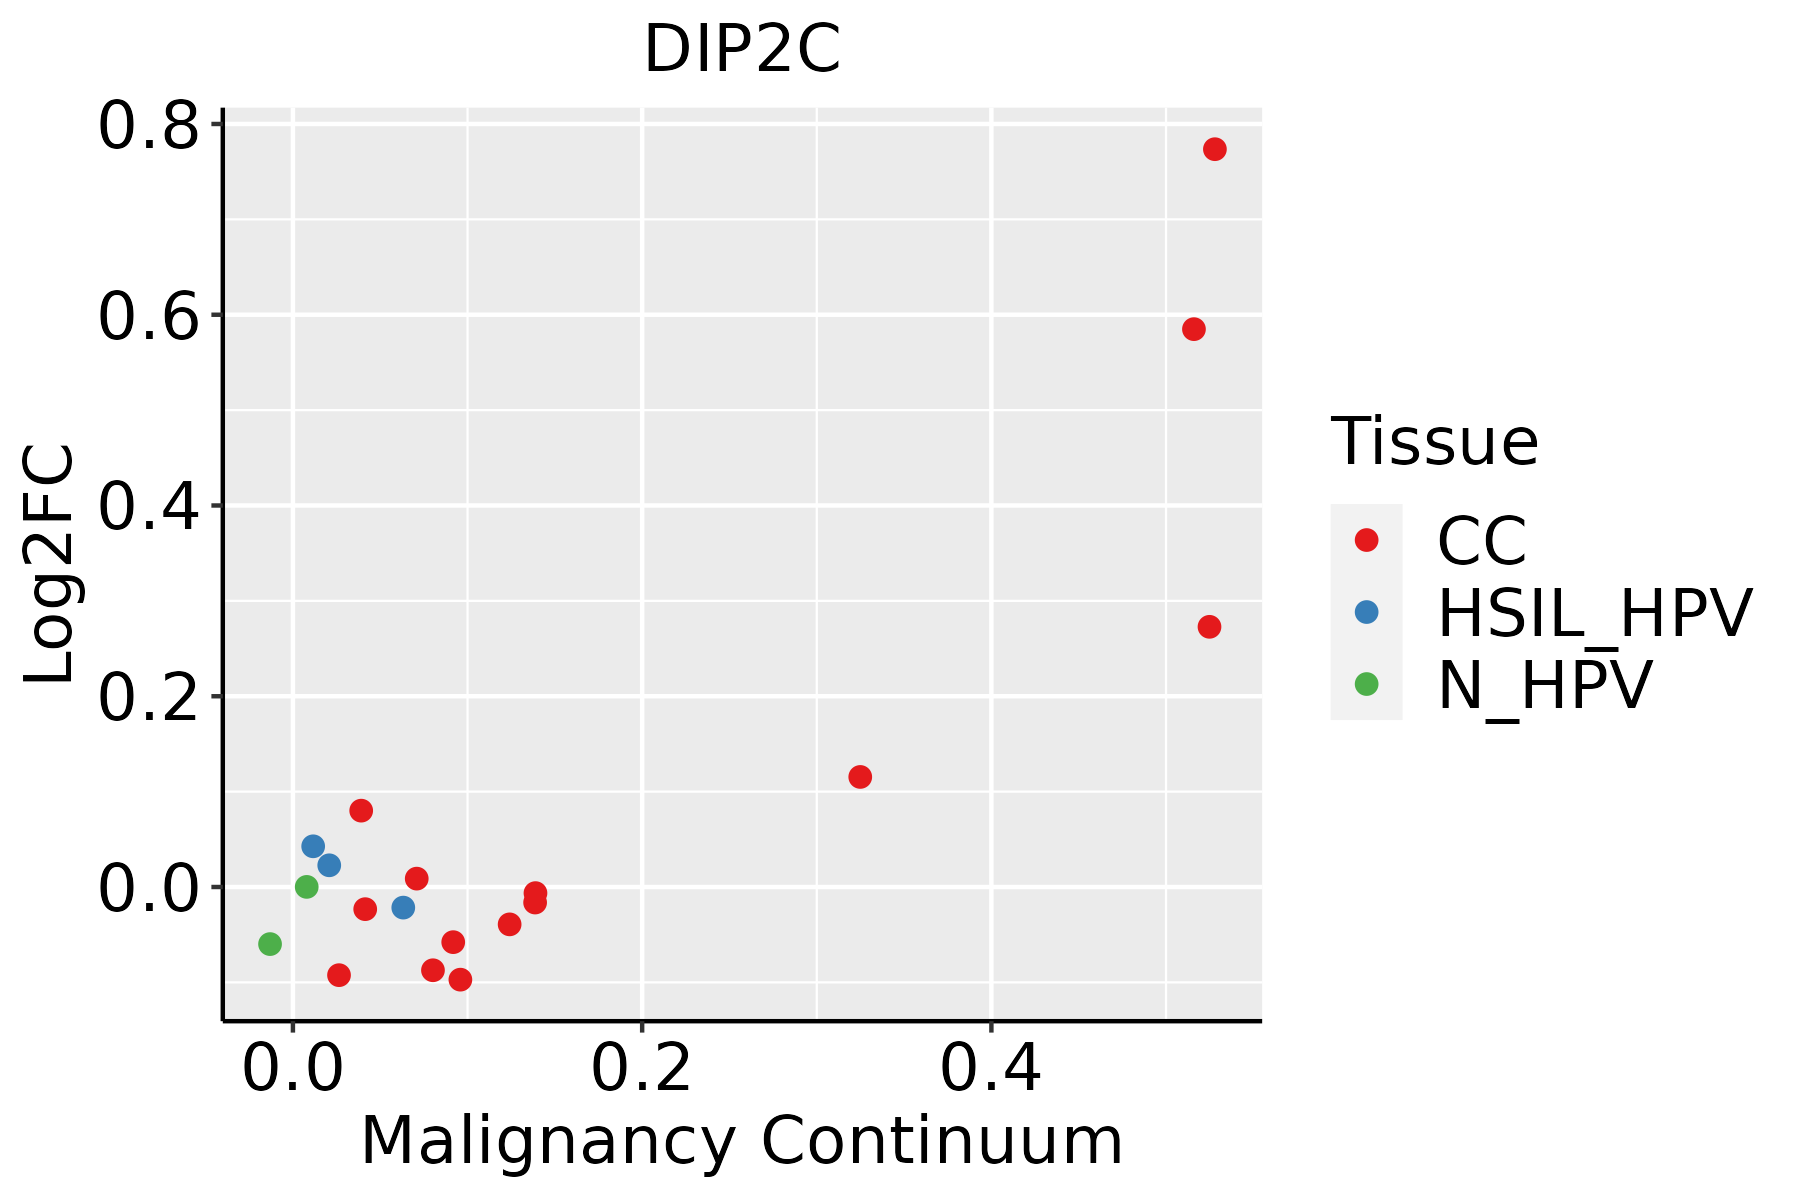 | CC: Cervix cancer |
| HSIL_HPV: HPV-infected high-grade squamous intraepithelial lesions | ||
| N_HPV: HPV-infected normal cervix | ||
| Colorectum (GSE201348) |  | FAP: Familial adenomatous polyposis |
| CRC: Colorectal cancer | ||
| Colorectum (HTA11) |  | AD: Adenomas |
| SER: Sessile serrated lesions | ||
| MSI-H: Microsatellite-high colorectal cancer | ||
| MSS: Microsatellite stable colorectal cancer | ||
| Endometrium |  | AEH: Atypical endometrial hyperplasia |
| EEC: Endometrioid Cancer | ||
| Liver | 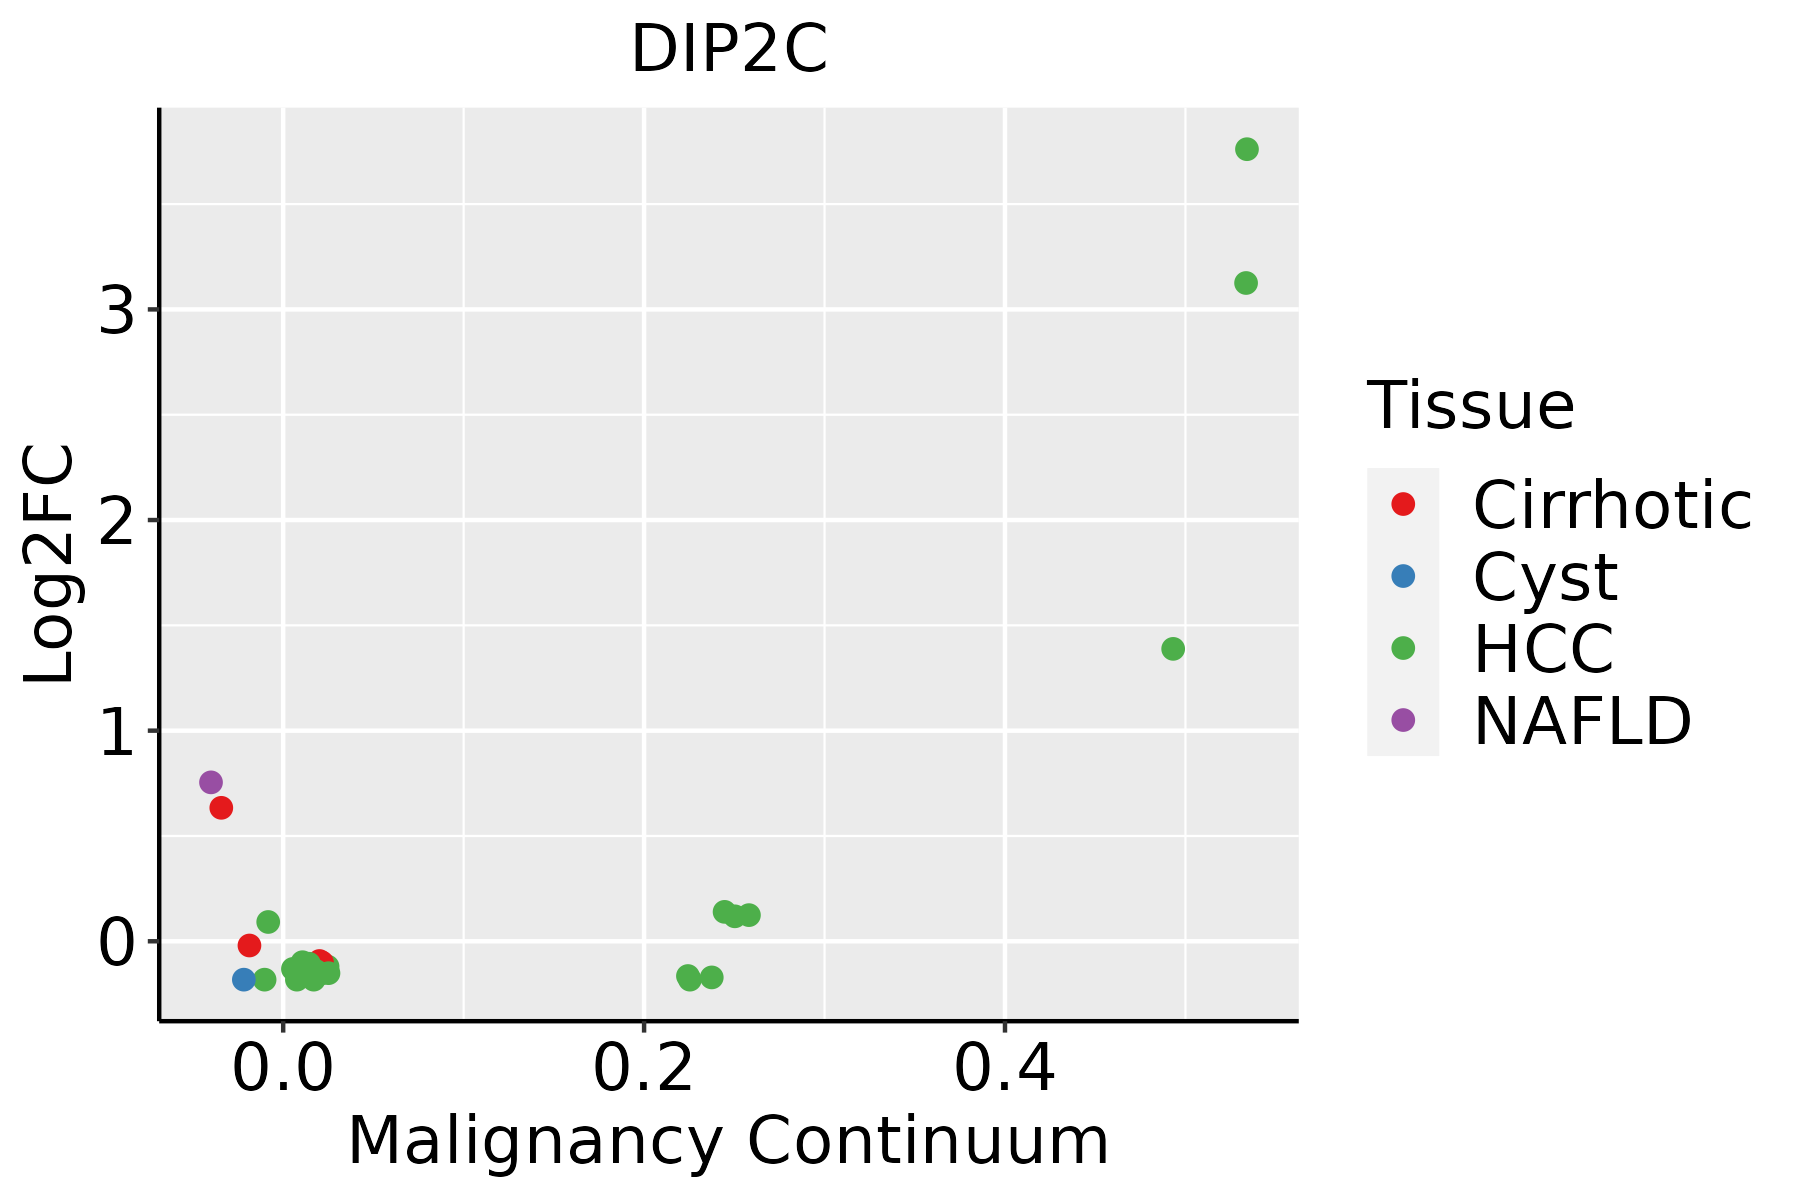 | HCC: Hepatocellular carcinoma |
| NAFLD: Non-alcoholic fatty liver disease | ||
| Thyroid | 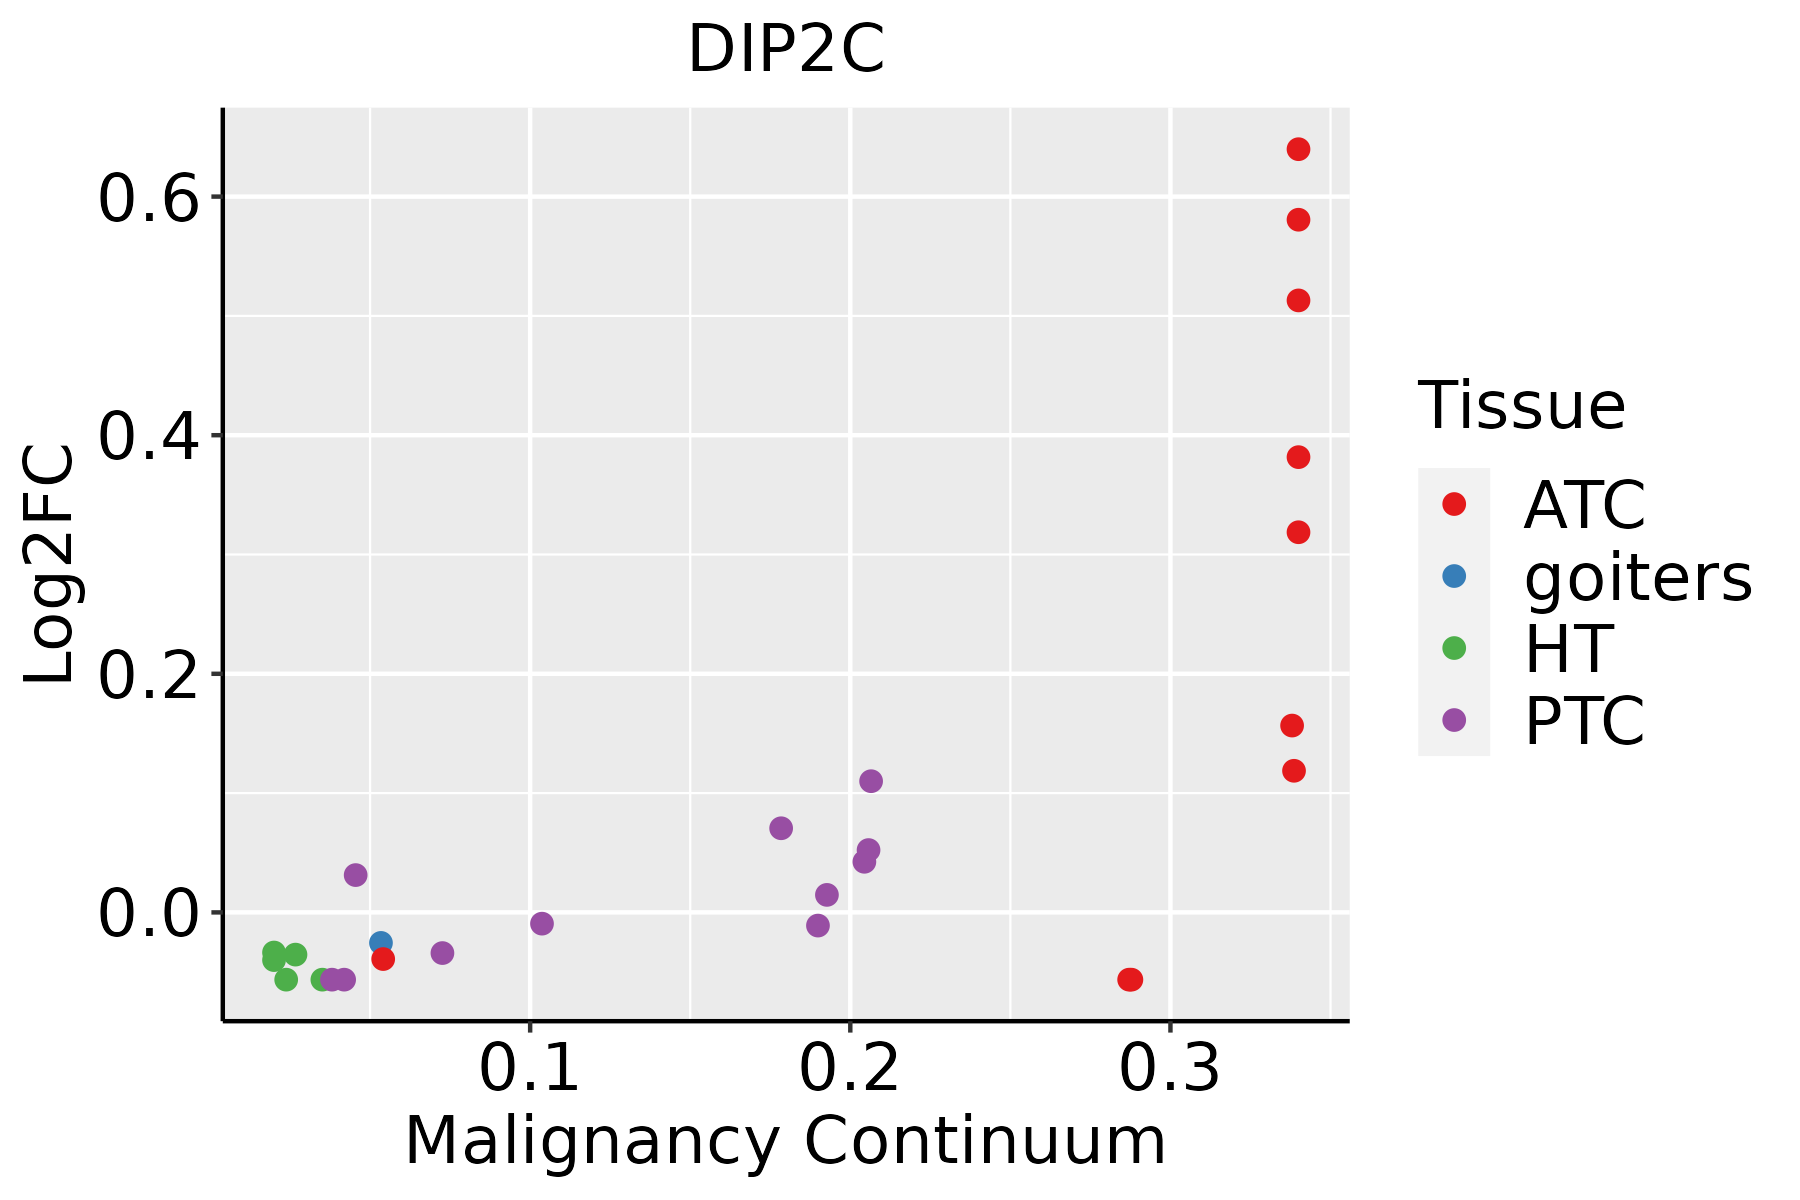 | ATC: Anaplastic thyroid cancer |
| HT: Hashimoto's thyroiditis | ||
| PTC: Papillary thyroid cancer |
| ∗log2FC in expression of this searched gene in stem-like cells from each diseased tissue sample relative to stem-like cells in normal samples in each tissue plotted against the malignancy continuum. Samples are colored based on if they are from different disease stage. |
Top |
Malignant transformation related pathway analysis |
| Find out the enriched GO biological processes and KEGG pathways involved in transition from healthy to precancer to cancer |
| Tissue | Disease Stage | Enriched GO biological Processes |
| Colorectum | AD |  |
| Colorectum | SER |  |
| Colorectum | MSS |  |
| Colorectum | MSI-H |  |
| Colorectum | FAP |  |
| ∗Top 15 enriched GO BP terms are showed in the bar plot of each disease state in each tissue. Each row represents a significant GO biological process which is colored according to the -log10(p.adjust). |
| Page: 1 2 3 4 5 6 7 8 9 |
| GO ID | Tissue | Disease Stage | Description | Gene Ratio | Bg Ratio | pvalue | p.adjust | Count |
| Page: 1 |
| Pathway ID | Tissue | Disease Stage | Description | Gene Ratio | Bg Ratio | pvalue | p.adjust | qvalue | Count |
| Page: 1 |
Top |
Cell-cell communication analysis |
| Identification of potential cell-cell interactions between two cell types and their ligand-receptor pairs for different disease states |
| Ligand | Receptor | LRpair | Pathway | Tissue | Disease Stage |
| Page: 1 |
Top |
Single-cell gene regulatory network inference analysis |
| Find out the significant the regulons (TFs) and the target genes of each regulon across cell types for different disease states |
| TF | Cell Type | Tissue | Disease Stage | Target Gene | RSS | Regulon Activity |
| ∗The dot plots of a searched regulon are shown for all cell subpopulations in each disease state of each tissue based on the regulon specific score inferred using pySCENIC and by calculating the average expression. |
| Page: 1 |
Top |
Somatic mutation of malignant transformation related genes |
| Annotation of somatic variants for genes involved in malignant transformation |
| Hugo Symbol | Variant Class | Variant Classification | dbSNP RS | HGVSc | HGVSp | HGVSp Short | SWISSPROT | BIOTYPE | SIFT | PolyPhen | Tumor Sample Barcode | Tissue | Histology | Sex | Age | Stage | Therapy Types | Drugs | Outcome |
| DIP2C | SNV | Missense_Mutation | c.4358N>A | p.Arg1453Gln | p.R1453Q | Q9Y2E4 | protein_coding | deleterious(0.01) | possibly_damaging(0.74) | TCGA-A7-A0CJ-01 | Breast | breast invasive carcinoma | Female | <65 | I/II | Chemotherapy | cytoxan | SD | |
| DIP2C | SNV | Missense_Mutation | novel | c.3745T>A | p.Ser1249Thr | p.S1249T | Q9Y2E4 | protein_coding | tolerated(0.69) | benign(0.014) | TCGA-A8-A07R-01 | Breast | breast invasive carcinoma | Female | >=65 | III/IV | Ancillary | zoledronic | SD |
| DIP2C | SNV | Missense_Mutation | c.4303G>C | p.Asp1435His | p.D1435H | Q9Y2E4 | protein_coding | deleterious(0) | probably_damaging(0.996) | TCGA-AC-A23H-01 | Breast | breast invasive carcinoma | Female | >=65 | I/II | Unknown | Unknown | PD | |
| DIP2C | SNV | Missense_Mutation | rs780374684 | c.2359N>A | p.Val787Ile | p.V787I | Q9Y2E4 | protein_coding | tolerated(0.33) | benign(0.05) | TCGA-AN-A046-01 | Breast | breast invasive carcinoma | Female | >=65 | I/II | Unknown | Unknown | SD |
| DIP2C | SNV | Missense_Mutation | c.1204G>A | p.Gly402Ser | p.G402S | Q9Y2E4 | protein_coding | deleterious(0) | probably_damaging(0.998) | TCGA-AO-A128-01 | Breast | breast invasive carcinoma | Female | <65 | I/II | Chemotherapy | doxorubicin | SD | |
| DIP2C | SNV | Missense_Mutation | c.2216N>T | p.Ala739Val | p.A739V | Q9Y2E4 | protein_coding | deleterious(0.03) | possibly_damaging(0.656) | TCGA-BH-A0AW-01 | Breast | breast invasive carcinoma | Female | <65 | I/II | Chemotherapy | carboplatin | SD | |
| DIP2C | SNV | Missense_Mutation | novel | c.1723N>T | p.Leu575Phe | p.L575F | Q9Y2E4 | protein_coding | tolerated(0.22) | possibly_damaging(0.835) | TCGA-BH-A0HF-01 | Breast | breast invasive carcinoma | Female | >=65 | I/II | Hormone Therapy | arimidex | SD |
| DIP2C | SNV | Missense_Mutation | rs751903359 | c.3655C>T | p.Leu1219Phe | p.L1219F | Q9Y2E4 | protein_coding | tolerated(0.12) | benign(0.148) | TCGA-BH-A0HU-01 | Breast | breast invasive carcinoma | Female | <65 | I/II | Chemotherapy | docetaxel | SD |
| DIP2C | SNV | Missense_Mutation | rs771254606 | c.3703N>A | p.Val1235Met | p.V1235M | Q9Y2E4 | protein_coding | deleterious(0) | probably_damaging(0.993) | TCGA-C8-A274-01 | Breast | breast invasive carcinoma | Female | <65 | I/II | Hormone Therapy | tamoxiphen | SD |
| DIP2C | SNV | Missense_Mutation | rs771896590 | c.3047T>C | p.Val1016Ala | p.V1016A | Q9Y2E4 | protein_coding | tolerated(1) | benign(0) | TCGA-D8-A1XK-01 | Breast | breast invasive carcinoma | Female | <65 | I/II | Chemotherapy | doxorubicine+cyclophosphamide | SD |
| Page: 1 2 3 4 5 6 7 8 9 10 11 12 13 14 15 16 17 18 19 20 |
Top |
Related drugs of malignant transformation related genes |
| Identification of chemicals and drugs interact with genes involved in malignant transfromation |
| (DGIdb 4.0) |
| Entrez ID | Symbol | Category | Interaction Types | Drug Claim Name | Drug Name | PMIDs |
| Page: 1 |

Copyright 2023-Present -The University of Texas Health Science Center at Houston |