Schematic overview of the cellular and molecular mechanisms involved in the cancer progression, including the proposed cellular and molecular mechanisms in cancer cells trajectory. AT1: alveolar type 1 cells; AT2: alveolar type 2 cells; AAH: atypical adenomatous hyperplasia; AIS: adenocarcinoma in situ; MIA: minimally invasive adenocarcinoma; IA: invasive adenocarcinoma; EMT: epithelial-mesenchymal transition

Home

Download

Statistics

Help

Contact

Center for Computational Systems Medicine
leaf

Gene summary

leaf

Malignant transformation analysis

leaf

Malignant transformation related pathway analysis

leaf

Cell-cell communication analysis

leaf

Single-cell gene regulatory network inference analysis

leaf

Somatic mutation of malignant transformation related genes

leaf

Related drugs of malignant transformation related genes

Gene: DIP2B

Gene summary for DIP2B

check button Gene summary.

Gene informationSpeciesHuman
Gene symbol

DIP2B

Gene ID

57609

Gene namedisco interacting protein 2 homolog B
Gene AliasDIP2B
Cytomap12q13.12
Gene Typeprotein-coding
GO ID

GO:0000902

UniProtAcc

Q7Z3H2


Top

Malignant transformation analysis

check button Identification of the aberrant gene expression in precancerous and cancerous lesions by comparing the gene expression of stem-like cells in diseased tissues with normal stem cells
check button Malignant transformation involving gene list.
Entrez IDSymbolReplicatesSpeciesOrganTissueAdj P-valueLog2FCMalignancy
57609DIP2BCCI_1HumanCervixCC9.65e-161.76e+000.528
57609DIP2BCCI_2HumanCervixCC6.99e-171.54e+000.5249
57609DIP2BCCI_3HumanCervixCC2.44e-191.75e+000.516
57609DIP2Bsample3HumanCervixCC3.24e-021.72e-010.1387
57609DIP2BT3HumanCervixCC9.64e-041.60e-010.1389
57609DIP2BHTA11_3410_2000001011HumanColorectumAD3.02e-12-4.95e-010.0155
57609DIP2BHTA11_347_2000001011HumanColorectumAD6.93e-085.22e-01-0.1954
57609DIP2BHTA11_866_3004761011HumanColorectumAD1.99e-07-4.42e-010.096
57609DIP2BHTA11_99999973899_84307HumanColorectumMSS2.60e-02-5.39e-010.2585
57609DIP2BHTA11_99999974143_84620HumanColorectumMSS1.51e-15-5.76e-010.3005
57609DIP2BF007HumanColorectumFAP6.95e-04-2.62e-010.1176
57609DIP2BA001-C-207HumanColorectumFAP1.09e-03-2.35e-010.1278
57609DIP2BA015-C-203HumanColorectumFAP3.74e-42-7.16e-01-0.1294
57609DIP2BA015-C-204HumanColorectumFAP1.18e-11-4.69e-01-0.0228
57609DIP2BA014-C-040HumanColorectumFAP5.40e-09-6.08e-01-0.1184
57609DIP2BA002-C-201HumanColorectumFAP1.19e-26-6.66e-010.0324
57609DIP2BA002-C-203HumanColorectumFAP5.96e-07-2.82e-010.2786
57609DIP2BA001-C-119HumanColorectumFAP6.03e-08-2.81e-01-0.1557
57609DIP2BA001-C-108HumanColorectumFAP4.03e-22-3.68e-01-0.0272
57609DIP2BA002-C-205HumanColorectumFAP3.70e-34-6.06e-01-0.1236
Page: 1 2 3 4 5 6 7 8 9 10 

check button Transcriptomic changes along malignancy continuum.
TissueExpression DynamicsAbbreviation
CervixThe image shows the transcriptomic changes along malignancy continuum.log2FC in expression of this searched gene in stem-like cells from each diseased tissue sample relative to stem-like cells in normal samples in each tissue plotted against the malignancy continuum. Samples are colored based on if they are from different disease stage.CC: Cervix cancer
HSIL_HPV: HPV-infected high-grade squamous intraepithelial lesions
N_HPV: HPV-infected normal cervix
Colorectum (GSE201348)The image shows the transcriptomic changes along malignancy continuum.log2FC in expression of this searched gene in stem-like cells from each diseased tissue sample relative to stem-like cells in normal samples in each tissue plotted against the malignancy continuum. Samples are colored based on if they are from different disease stage.FAP: Familial adenomatous polyposis
CRC: Colorectal cancer
Colorectum (HTA11)The image shows the transcriptomic changes along malignancy continuum.log2FC in expression of this searched gene in stem-like cells from each diseased tissue sample relative to stem-like cells in normal samples in each tissue plotted against the malignancy continuum. Samples are colored based on if they are from different disease stage.AD: Adenomas
SER: Sessile serrated lesions
MSI-H: Microsatellite-high colorectal cancer
MSS: Microsatellite stable colorectal cancer
EndometriumThe image shows the transcriptomic changes along malignancy continuum.log2FC in expression of this searched gene in stem-like cells from each diseased tissue sample relative to stem-like cells in normal samples in each tissue plotted against the malignancy continuum. Samples are colored based on if they are from different disease stage.
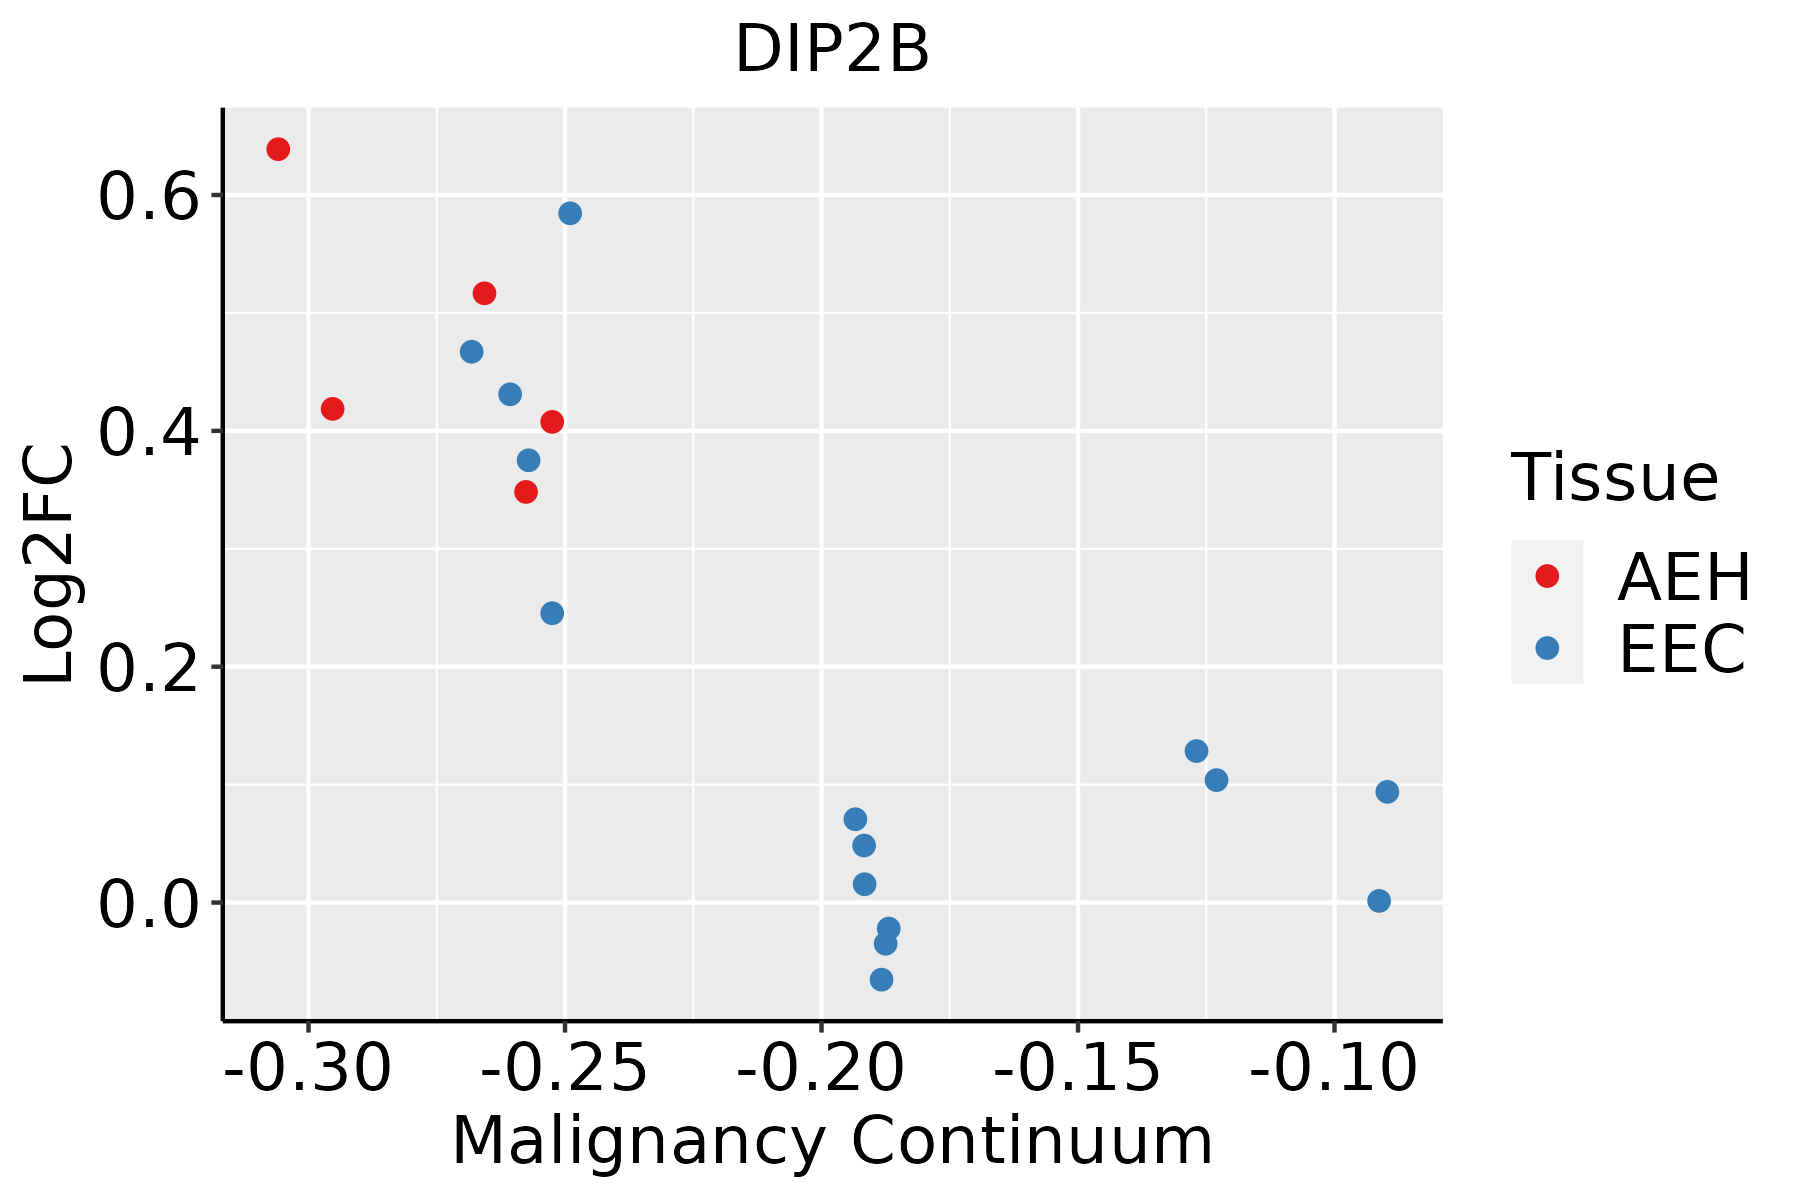
AEH: Atypical endometrial hyperplasia
EEC: Endometrioid Cancer
EsophagusThe image shows the transcriptomic changes along malignancy continuum.log2FC in expression of this searched gene in stem-like cells from each diseased tissue sample relative to stem-like cells in normal samples in each tissue plotted against the malignancy continuum. Samples are colored based on if they are from different disease stage.ESCC: Esophageal squamous cell carcinoma
HGIN: High-grade intraepithelial neoplasias
LGIN: Low-grade intraepithelial neoplasias
LiverThe image shows the transcriptomic changes along malignancy continuum.log2FC in expression of this searched gene in stem-like cells from each diseased tissue sample relative to stem-like cells in normal samples in each tissue plotted against the malignancy continuum. Samples are colored based on if they are from different disease stage.
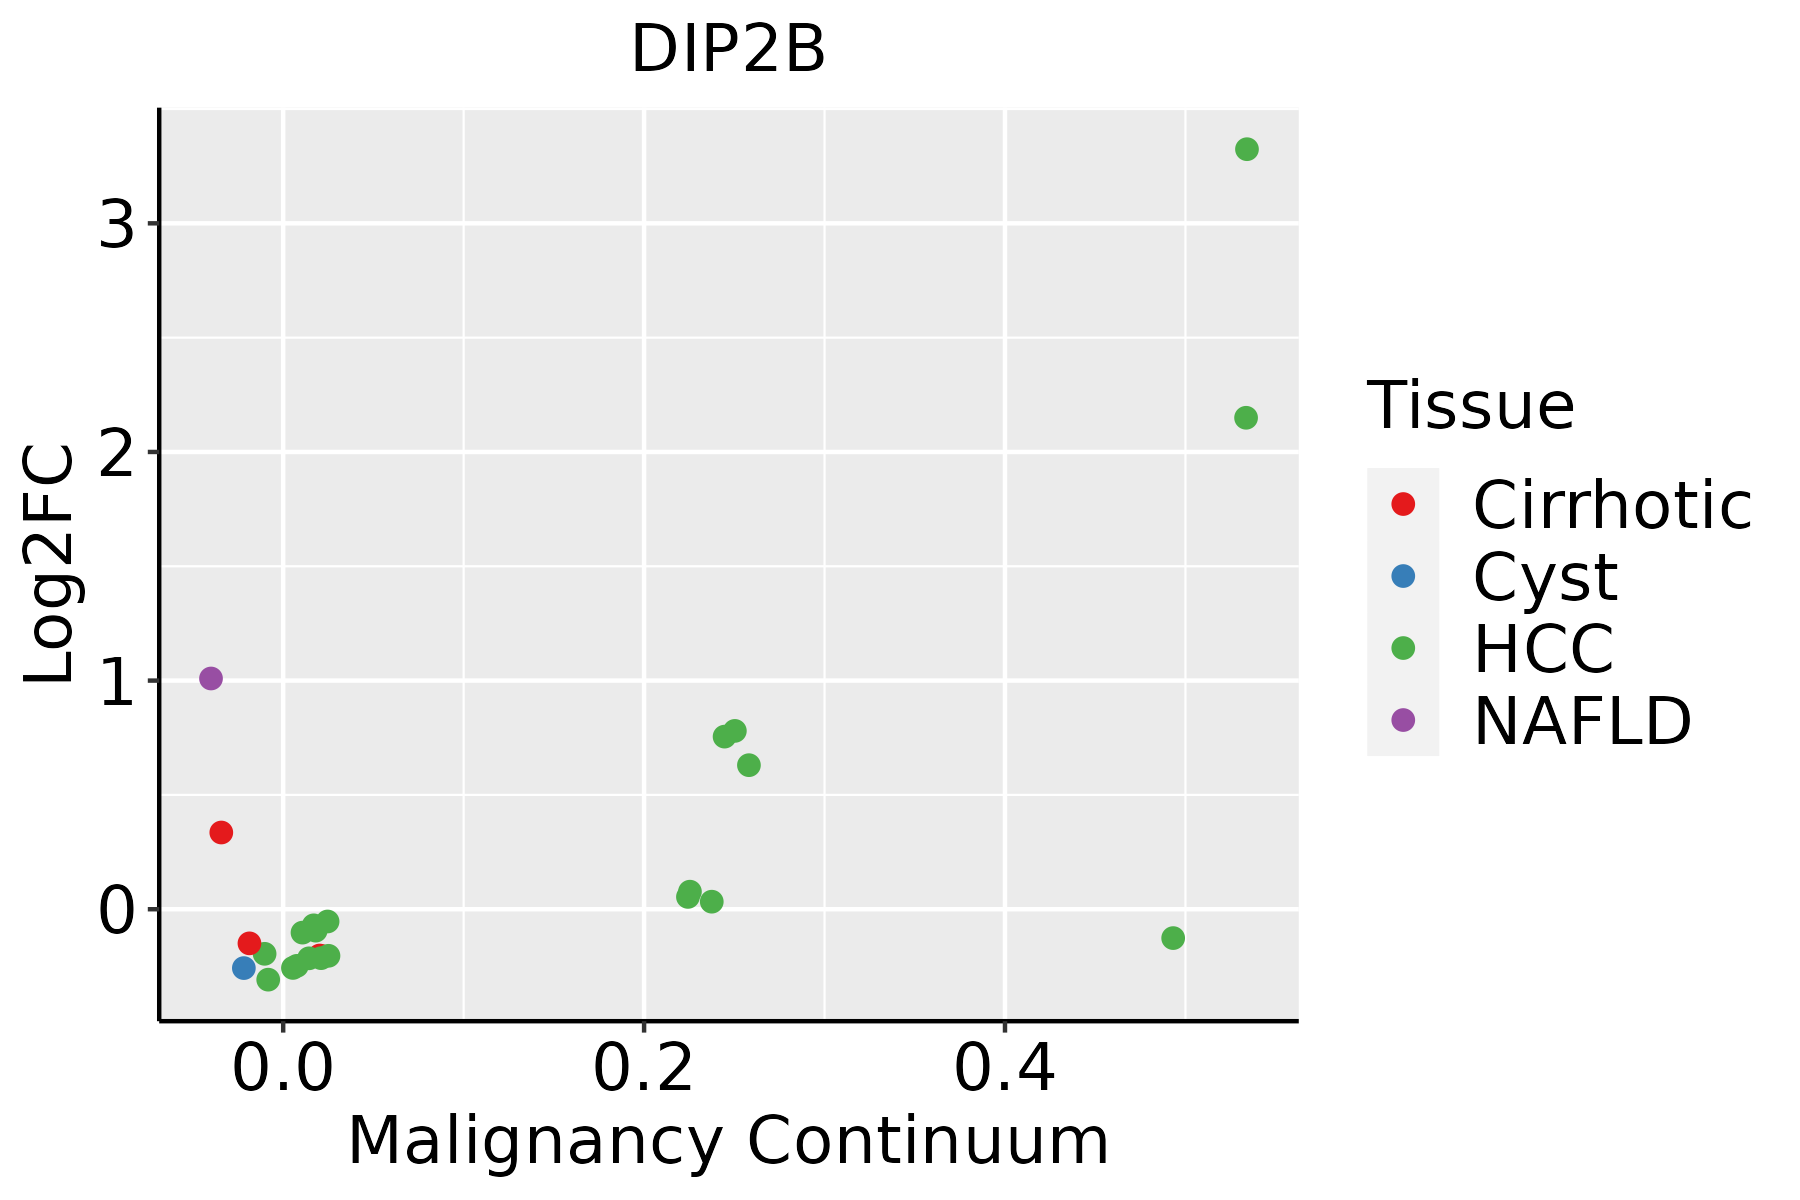
HCC: Hepatocellular carcinoma
NAFLD: Non-alcoholic fatty liver disease
LungThe image shows the transcriptomic changes along malignancy continuum.log2FC in expression of this searched gene in stem-like cells from each diseased tissue sample relative to stem-like cells in normal samples in each tissue plotted against the malignancy continuum. Samples are colored based on if they are from different disease stage.
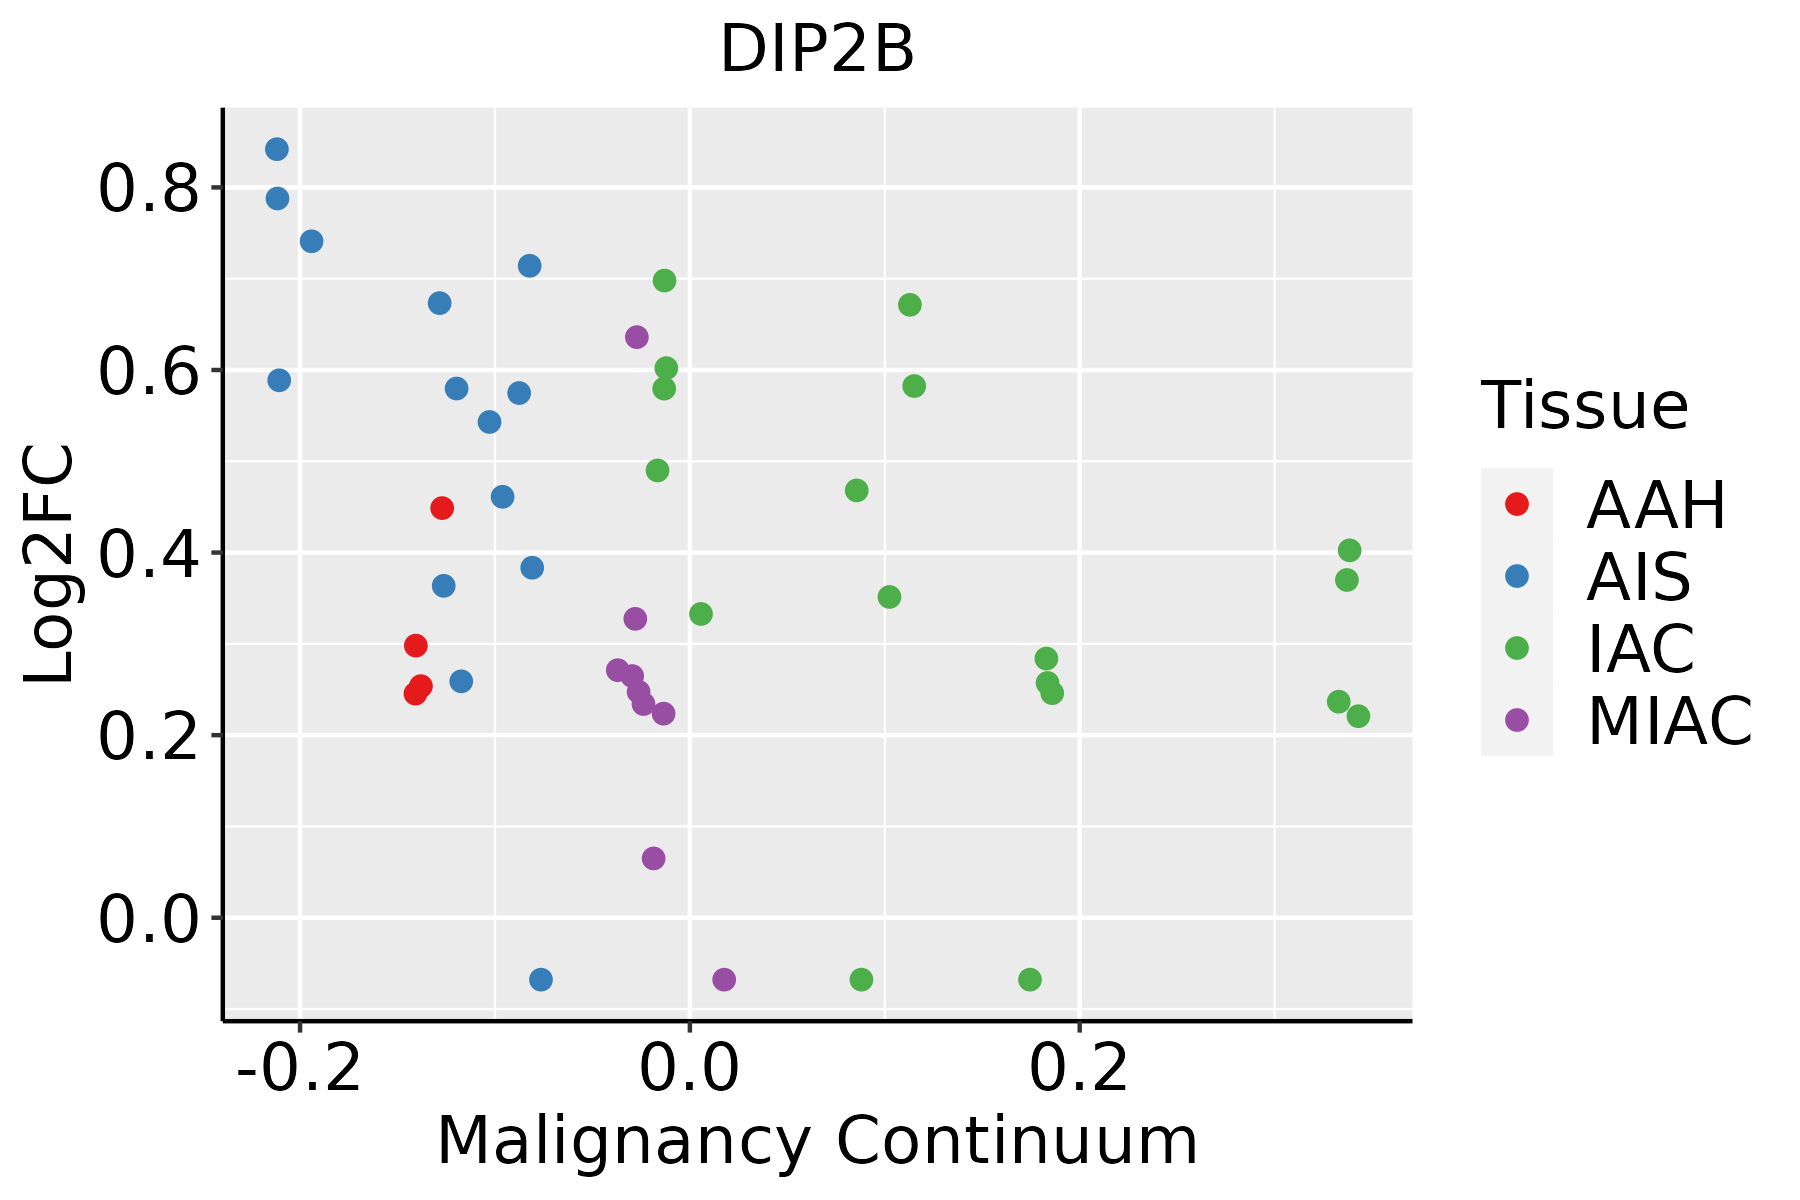
AAH: Atypical adenomatous hyperplasia
AIS: Adenocarcinoma in situ
IAC: Invasive lung adenocarcinoma
MIA: Minimally invasive adenocarcinoma
Oral CavityThe image shows the transcriptomic changes along malignancy continuum.log2FC in expression of this searched gene in stem-like cells from each diseased tissue sample relative to stem-like cells in normal samples in each tissue plotted against the malignancy continuum. Samples are colored based on if they are from different disease stage.
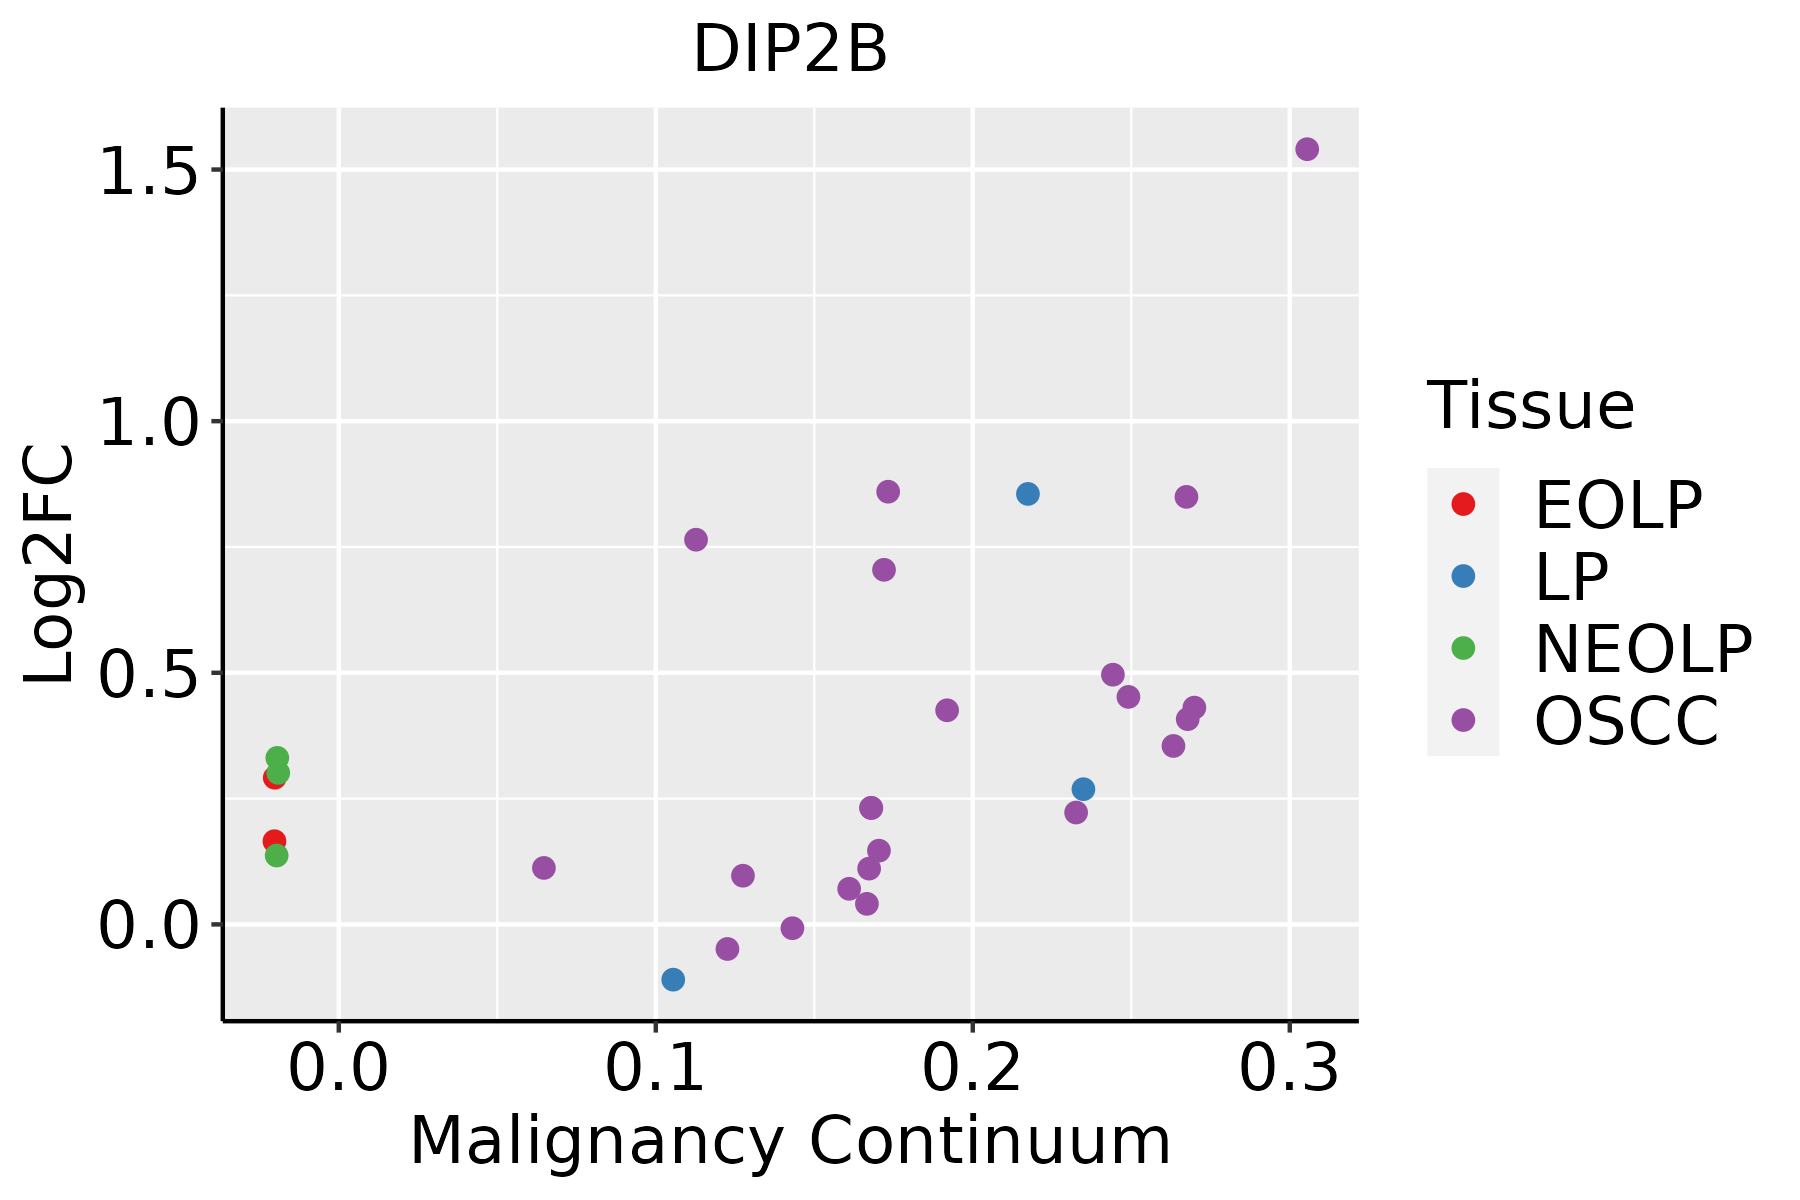
EOLP: Erosive Oral lichen planus
LP: leukoplakia
NEOLP: Non-erosive oral lichen planus
OSCC: Oral squamous cell carcinoma
ProstateThe image shows the transcriptomic changes along malignancy continuum.log2FC in expression of this searched gene in stem-like cells from each diseased tissue sample relative to stem-like cells in normal samples in each tissue plotted against the malignancy continuum. Samples are colored based on if they are from different disease stage.
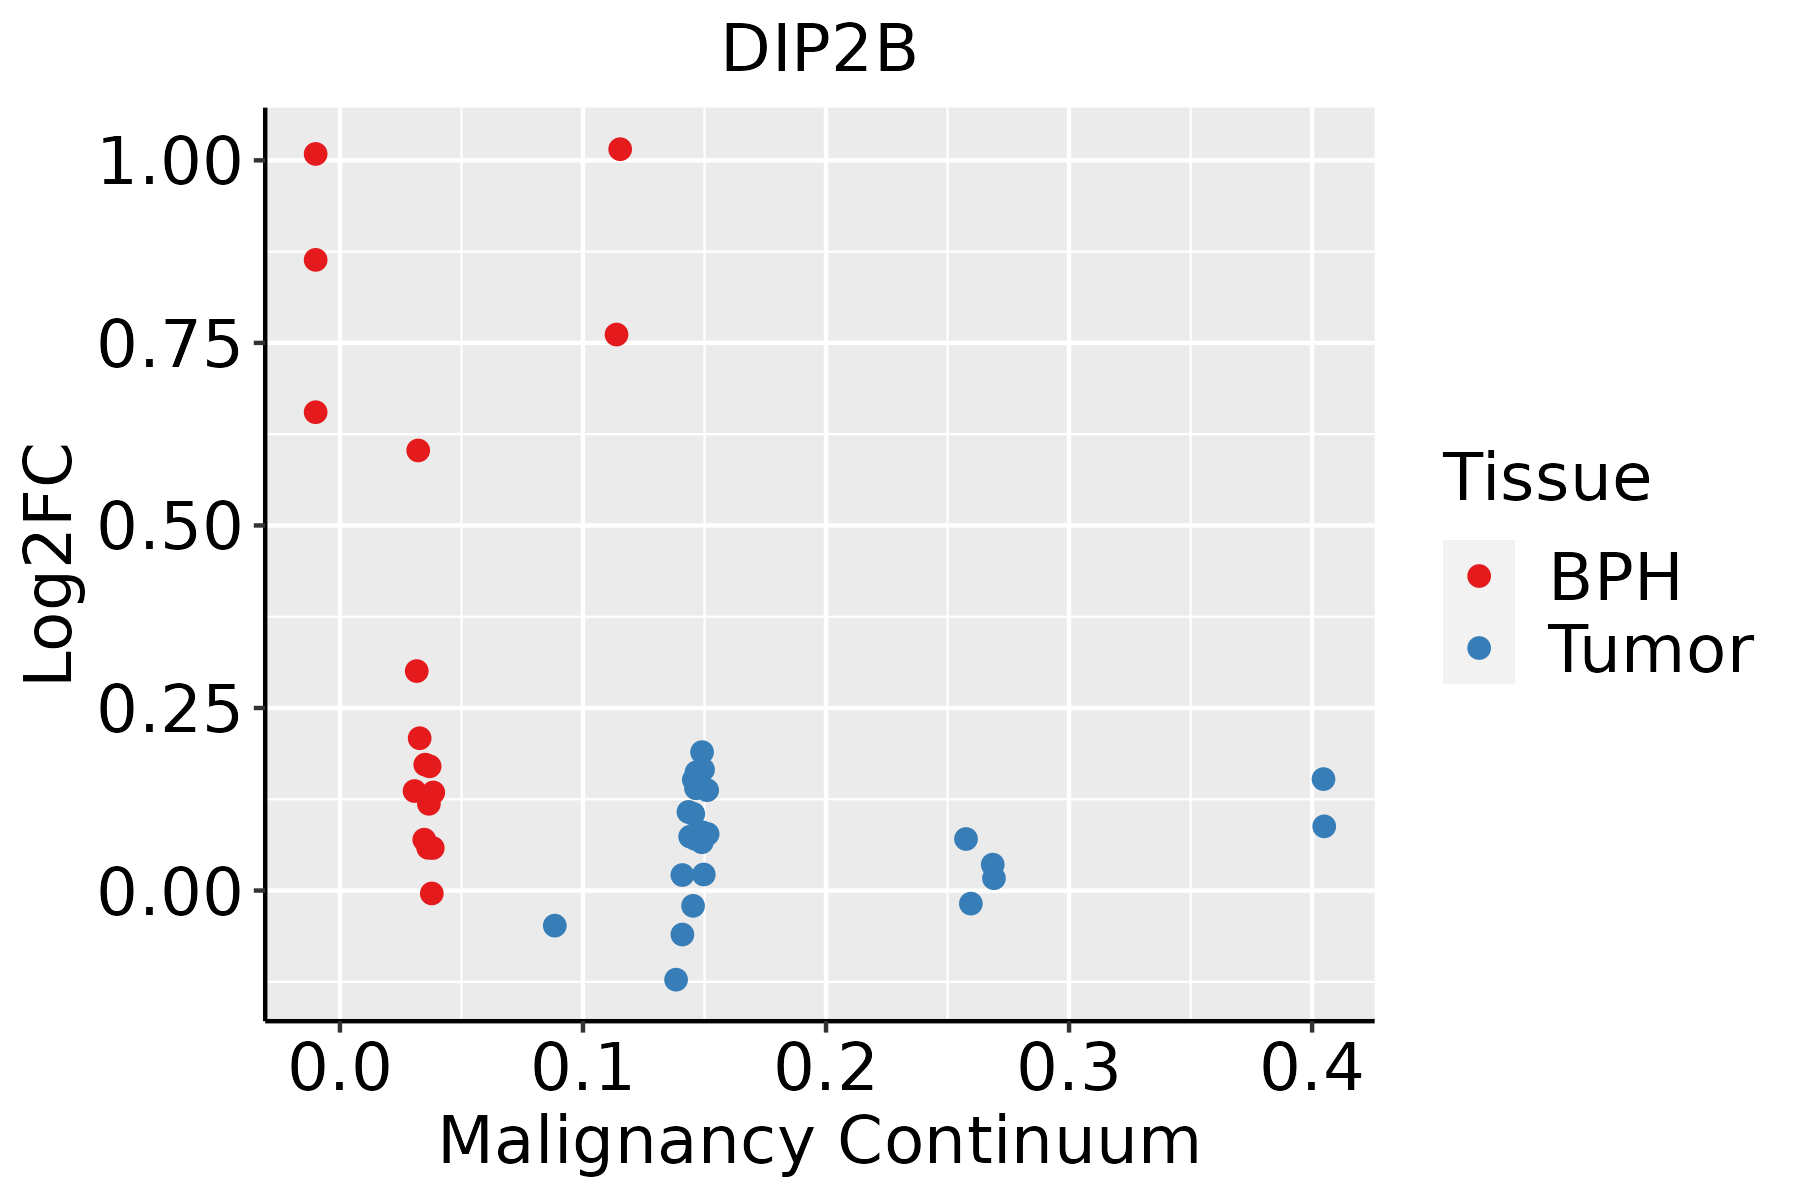
BPH: Benign Prostatic Hyperplasia
SkinThe image shows the transcriptomic changes along malignancy continuum.log2FC in expression of this searched gene in stem-like cells from each diseased tissue sample relative to stem-like cells in normal samples in each tissue plotted against the malignancy continuum. Samples are colored based on if they are from different disease stage.
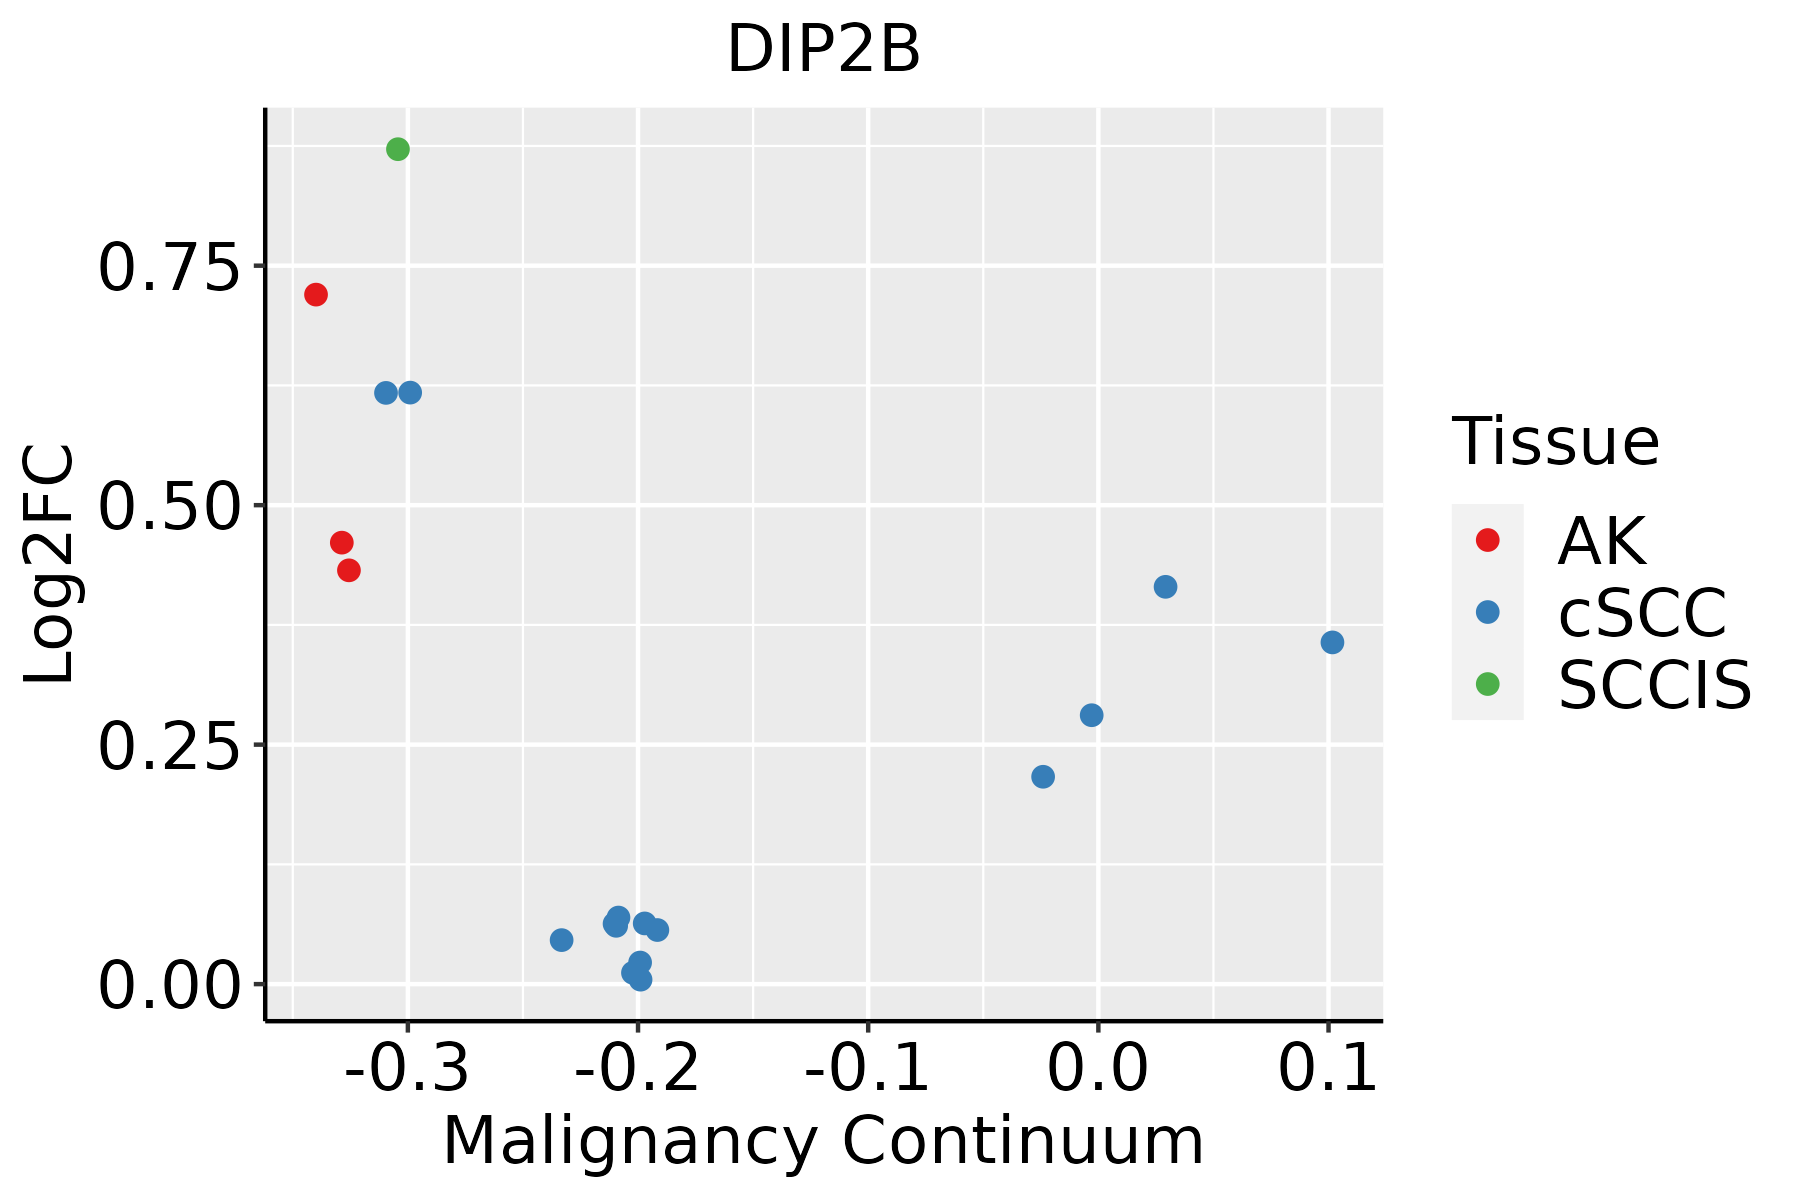
AK: Actinic keratosis
cSCC: Cutaneous squamous cell carcinoma
SCCIS:squamous cell carcinoma in situ
∗log2FC in expression of this searched gene in stem-like cells from each diseased tissue sample relative to stem-like cells in normal samples in each tissue plotted against the malignancy continuum. Samples are colored based on if they are from different disease stage.

Top

Malignant transformation related pathway analysis

check buttonFind out the enriched GO biological processes and KEGG pathways involved in transition from healthy to precancer to cancer
check button Figure of enriched GO biological processes.
TissueDisease StageEnriched GO biological Processes
ColorectumADGO analysis - Figure of enriched GO biological processes: Top 15 enriched GO BP terms are showed in the bar plot of each disease state in each tissue. Each row represents a significant GO biological process which is colored according to the -log10(p.adjust).
ColorectumSERGO analysis - Figure of enriched GO biological processes: Top 15 enriched GO BP terms are showed in the bar plot of each disease state in each tissue. Each row represents a significant GO biological process which is colored according to the -log10(p.adjust).
ColorectumMSSGO analysis - Figure of enriched GO biological processes: Top 15 enriched GO BP terms are showed in the bar plot of each disease state in each tissue. Each row represents a significant GO biological process which is colored according to the -log10(p.adjust).
ColorectumMSI-HGO analysis - Figure of enriched GO biological processes: Top 15 enriched GO BP terms are showed in the bar plot of each disease state in each tissue. Each row represents a significant GO biological process which is colored according to the -log10(p.adjust).
ColorectumFAPGO analysis - Figure of enriched GO biological processes: Top 15 enriched GO BP terms are showed in the bar plot of each disease state in each tissue. Each row represents a significant GO biological process which is colored according to the -log10(p.adjust).
∗Top 15 enriched GO BP terms are showed in the bar plot of each disease state in each tissue. Each row represents a significant GO biological process which is colored according to the -log10(p.adjust).
Page: 1 2 3 4 5 6 7 8 9 

check button Enriched GO biological processes.
GO IDTissueDisease StageDescriptionGene RatioBg Ratiopvaluep.adjustCount
GO:00109757CervixCCregulation of neuron projection development88/2311445/187234.26e-061.09e-0488
GO:00160498CervixCCcell growth92/2311482/187231.16e-052.49e-0492
GO:00325359CervixCCregulation of cellular component size76/2311383/187231.66e-053.21e-0476
GO:00615647CervixCCaxon development89/2311467/187231.71e-053.27e-0489
GO:00074097CervixCCaxonogenesis78/2311418/187231.14e-041.43e-0378
GO:00015588CervixCCregulation of cell growth77/2311414/187231.40e-041.70e-0377
GO:00507705CervixCCregulation of axonogenesis34/2311154/187234.87e-044.76e-0334
GO:00313456CervixCCnegative regulation of cell projection organization39/2311186/187235.86e-045.57e-0339
GO:00486386CervixCCregulation of developmental growth61/2311330/187237.69e-046.85e-0361
GO:00605606CervixCCdevelopmental growth involved in morphogenesis46/2311234/187238.82e-047.63e-0346
GO:00519603CervixCCregulation of nervous system development77/2311443/187231.13e-039.30e-0377
GO:00507676CervixCCregulation of neurogenesis65/2311364/187231.33e-031.05e-0265
GO:00486756CervixCCaxon extension26/2311120/187232.80e-031.87e-0226
GO:19901385CervixCCneuron projection extension34/2311172/187233.52e-032.27e-0234
GO:00109775CervixCCnegative regulation of neuron projection development28/2311137/187234.74e-032.83e-0228
GO:00485886CervixCCdevelopmental cell growth42/2311234/187237.88e-034.15e-0242
GO:00182054CervixCCpeptidyl-lysine modification62/2311376/187231.04e-024.97e-0262
GO:0032535ColorectumADregulation of cellular component size142/3918383/187231.74e-133.41e-11142
GO:0016049ColorectumADcell growth143/3918482/187232.83e-068.09e-05143
GO:0001558ColorectumADregulation of cell growth124/3918414/187237.67e-061.86e-04124
Page: 1 2 3 4 5 6 7 8 9 10 11 12 13 14 15 16 17 18 19 20 21 

check button Enriched KEGG pathways.
Pathway IDTissueDisease StageDescriptionGene RatioBg Ratiopvaluep.adjustqvalueCount
Page: 1 

Top

Cell-cell communication analysis

check buttonIdentification of potential cell-cell interactions between two cell types and their ligand-receptor pairs for different disease states
LigandReceptorLRpairPathwayTissueDisease Stage
Page: 1 

Top

Single-cell gene regulatory network inference analysis

check buttonFind out the significant the regulons (TFs) and the target genes of each regulon across cell types for different disease states
TFCell TypeTissueDisease StageTarget GeneRSSRegulon Activity
∗The dot plots of a searched regulon are shown for all cell subpopulations in each disease state of each tissue based on the regulon specific score inferred using pySCENIC and by calculating the average expression.
Page: 1 

Top

Somatic mutation of malignant transformation related genes

check buttonAnnotation of somatic variants for genes involved in malignant transformation
Hugo SymbolVariant ClassVariant ClassificationdbSNP RSHGVScHGVSpHGVSp ShortSWISSPROTBIOTYPESIFTPolyPhenTumor Sample BarcodeTissueHistologySexAgeStageTherapy TypesDrugsOutcome
DIP2BSNVMissense_Mutationc.3997N>Ap.Asp1333Asnp.D1333NQ9P265protein_codingdeleterious(0.03)probably_damaging(1)TCGA-A2-A0EY-01Breastbreast invasive carcinomaFemale<65I/IIChemotherapyadriamycinSD
DIP2BSNVMissense_Mutationc.4606G>Cp.Val1536Leup.V1536LQ9P265protein_codingdeleterious(0)probably_damaging(0.997)TCGA-A8-A09C-01Breastbreast invasive carcinomaFemale>=65I/IIUnknownUnknownSD
DIP2BSNVMissense_Mutationc.2437N>Tp.Asp813Tyrp.D813YQ9P265protein_codingdeleterious(0)probably_damaging(0.988)TCGA-AC-A23H-01Breastbreast invasive carcinomaFemale>=65I/IIUnknownUnknownPD
DIP2BSNVMissense_Mutationc.4702N>Cp.Asp1568Hisp.D1568HQ9P265protein_codingtolerated(0.07)probably_damaging(0.996)TCGA-AC-A23H-01Breastbreast invasive carcinomaFemale>=65I/IIUnknownUnknownPD
DIP2BSNVMissense_Mutationnovelc.3082A>Gp.Lys1028Glup.K1028EQ9P265protein_codingdeleterious(0.02)probably_damaging(0.947)TCGA-AN-A0AK-01Breastbreast invasive carcinomaFemale>=65I/IIUnknownUnknownSD
DIP2BSNVMissense_Mutationc.4214A>Cp.Tyr1405Serp.Y1405SQ9P265protein_codingdeleterious(0.01)possibly_damaging(0.906)TCGA-AO-A12H-01Breastbreast invasive carcinomaFemale>=65I/IIHormone TherapyarimidexSD
DIP2BSNVMissense_Mutationnovelc.1694N>Tp.Ala565Valp.A565VQ9P265protein_codingtolerated(1)benign(0.052)TCGA-BH-A5IZ-01Breastbreast invasive carcinomaFemale<65I/IIChemotherapyadriamycinCR
DIP2BSNVMissense_Mutationc.2918N>Tp.Gly973Valp.G973VQ9P265protein_codingdeleterious(0)probably_damaging(0.932)TCGA-D8-A1XY-01Breastbreast invasive carcinomaFemale>=65I/IIChemotherapytamoxiphenSD
DIP2BSNVMissense_Mutationc.4058A>Gp.Glu1353Glyp.E1353GQ9P265protein_codingtolerated(0.07)probably_damaging(1)TCGA-E2-A10A-01Breastbreast invasive carcinomaFemale<65I/IIHormone TherapyzoladexSD
DIP2BSNVMissense_Mutationc.2799N>Cp.Met933Ilep.M933IQ9P265protein_codingdeleterious(0.01)benign(0.08)TCGA-E9-A295-01Breastbreast invasive carcinomaFemale>=65I/IIHormone TherapytamoxiphenSD
Page: 1 2 3 4 5 6 7 8 9 10 11 12 13 14 15 16 17 

Top

Related drugs of malignant transformation related genes

check buttonIdentification of chemicals and drugs interact with genes involved in malignant transfromation
(DGIdb 4.0)
Entrez IDSymbolCategoryInteraction TypesDrug Claim NameDrug NamePMIDs
Page: 1