Schematic overview of the cellular and molecular mechanisms involved in the cancer progression, including the proposed cellular and molecular mechanisms in cancer cells trajectory. AT1: alveolar type 1 cells; AT2: alveolar type 2 cells; AAH: atypical adenomatous hyperplasia; AIS: adenocarcinoma in situ; MIA: minimally invasive adenocarcinoma; IA: invasive adenocarcinoma; EMT: epithelial-mesenchymal transition

Home

Download

Statistics

Help

Contact

Center for Computational Systems Medicine
leaf

Gene summary

leaf

Malignant transformation analysis

leaf

Malignant transformation related pathway analysis

leaf

Cell-cell communication analysis

leaf

Single-cell gene regulatory network inference analysis

leaf

Somatic mutation of malignant transformation related genes

leaf

Related drugs of malignant transformation related genes

Gene: DIP2A

Gene summary for DIP2A

check button Gene summary.

Gene informationSpeciesHuman
Gene symbol

DIP2A

Gene ID

23181

Gene namedisco interacting protein 2 homolog A
Gene AliasC21orf106
Cytomap21q22.3
Gene Typeprotein-coding
GO ID

GO:0000902

UniProtAcc

Q14689


Top

Malignant transformation analysis

check button Identification of the aberrant gene expression in precancerous and cancerous lesions by comparing the gene expression of stem-like cells in diseased tissues with normal stem cells
check button Malignant transformation involving gene list.
Entrez IDSymbolReplicatesSpeciesOrganTissueAdj P-valueLog2FCMalignancy
23181DIP2ALZE7THumanEsophagusESCC2.11e-052.01e-010.0667
23181DIP2ALZE8THumanEsophagusESCC2.03e-024.98e-020.067
23181DIP2ALZE22THumanEsophagusESCC4.25e-031.97e-010.068
23181DIP2ALZE24THumanEsophagusESCC7.43e-185.46e-010.0596
23181DIP2ALZE21THumanEsophagusESCC1.41e-021.47e-010.0655
23181DIP2AP1T-EHumanEsophagusESCC4.97e-042.12e-010.0875
23181DIP2AP2T-EHumanEsophagusESCC1.89e-202.21e-010.1177
23181DIP2AP4T-EHumanEsophagusESCC2.11e-152.74e-010.1323
23181DIP2AP5T-EHumanEsophagusESCC7.92e-131.66e-010.1327
23181DIP2AP8T-EHumanEsophagusESCC1.50e-161.55e-010.0889
23181DIP2AP9T-EHumanEsophagusESCC1.35e-101.45e-010.1131
23181DIP2AP10T-EHumanEsophagusESCC8.89e-163.48e-010.116
23181DIP2AP11T-EHumanEsophagusESCC8.17e-061.68e-010.1426
23181DIP2AP12T-EHumanEsophagusESCC3.42e-202.62e-010.1122
23181DIP2AP15T-EHumanEsophagusESCC1.16e-131.31e-010.1149
23181DIP2AP16T-EHumanEsophagusESCC1.35e-112.39e-010.1153
23181DIP2AP20T-EHumanEsophagusESCC2.05e-141.31e-010.1124
23181DIP2AP21T-EHumanEsophagusESCC2.51e-201.91e-010.1617
23181DIP2AP22T-EHumanEsophagusESCC3.17e-111.15e-010.1236
23181DIP2AP23T-EHumanEsophagusESCC2.86e-152.67e-010.108
Page: 1 2 3 4 5 6 

check button Transcriptomic changes along malignancy continuum.
TissueExpression DynamicsAbbreviation
EsophagusThe image shows the transcriptomic changes along malignancy continuum.log2FC in expression of this searched gene in stem-like cells from each diseased tissue sample relative to stem-like cells in normal samples in each tissue plotted against the malignancy continuum. Samples are colored based on if they are from different disease stage.ESCC: Esophageal squamous cell carcinoma
HGIN: High-grade intraepithelial neoplasias
LGIN: Low-grade intraepithelial neoplasias
LiverThe image shows the transcriptomic changes along malignancy continuum.log2FC in expression of this searched gene in stem-like cells from each diseased tissue sample relative to stem-like cells in normal samples in each tissue plotted against the malignancy continuum. Samples are colored based on if they are from different disease stage.
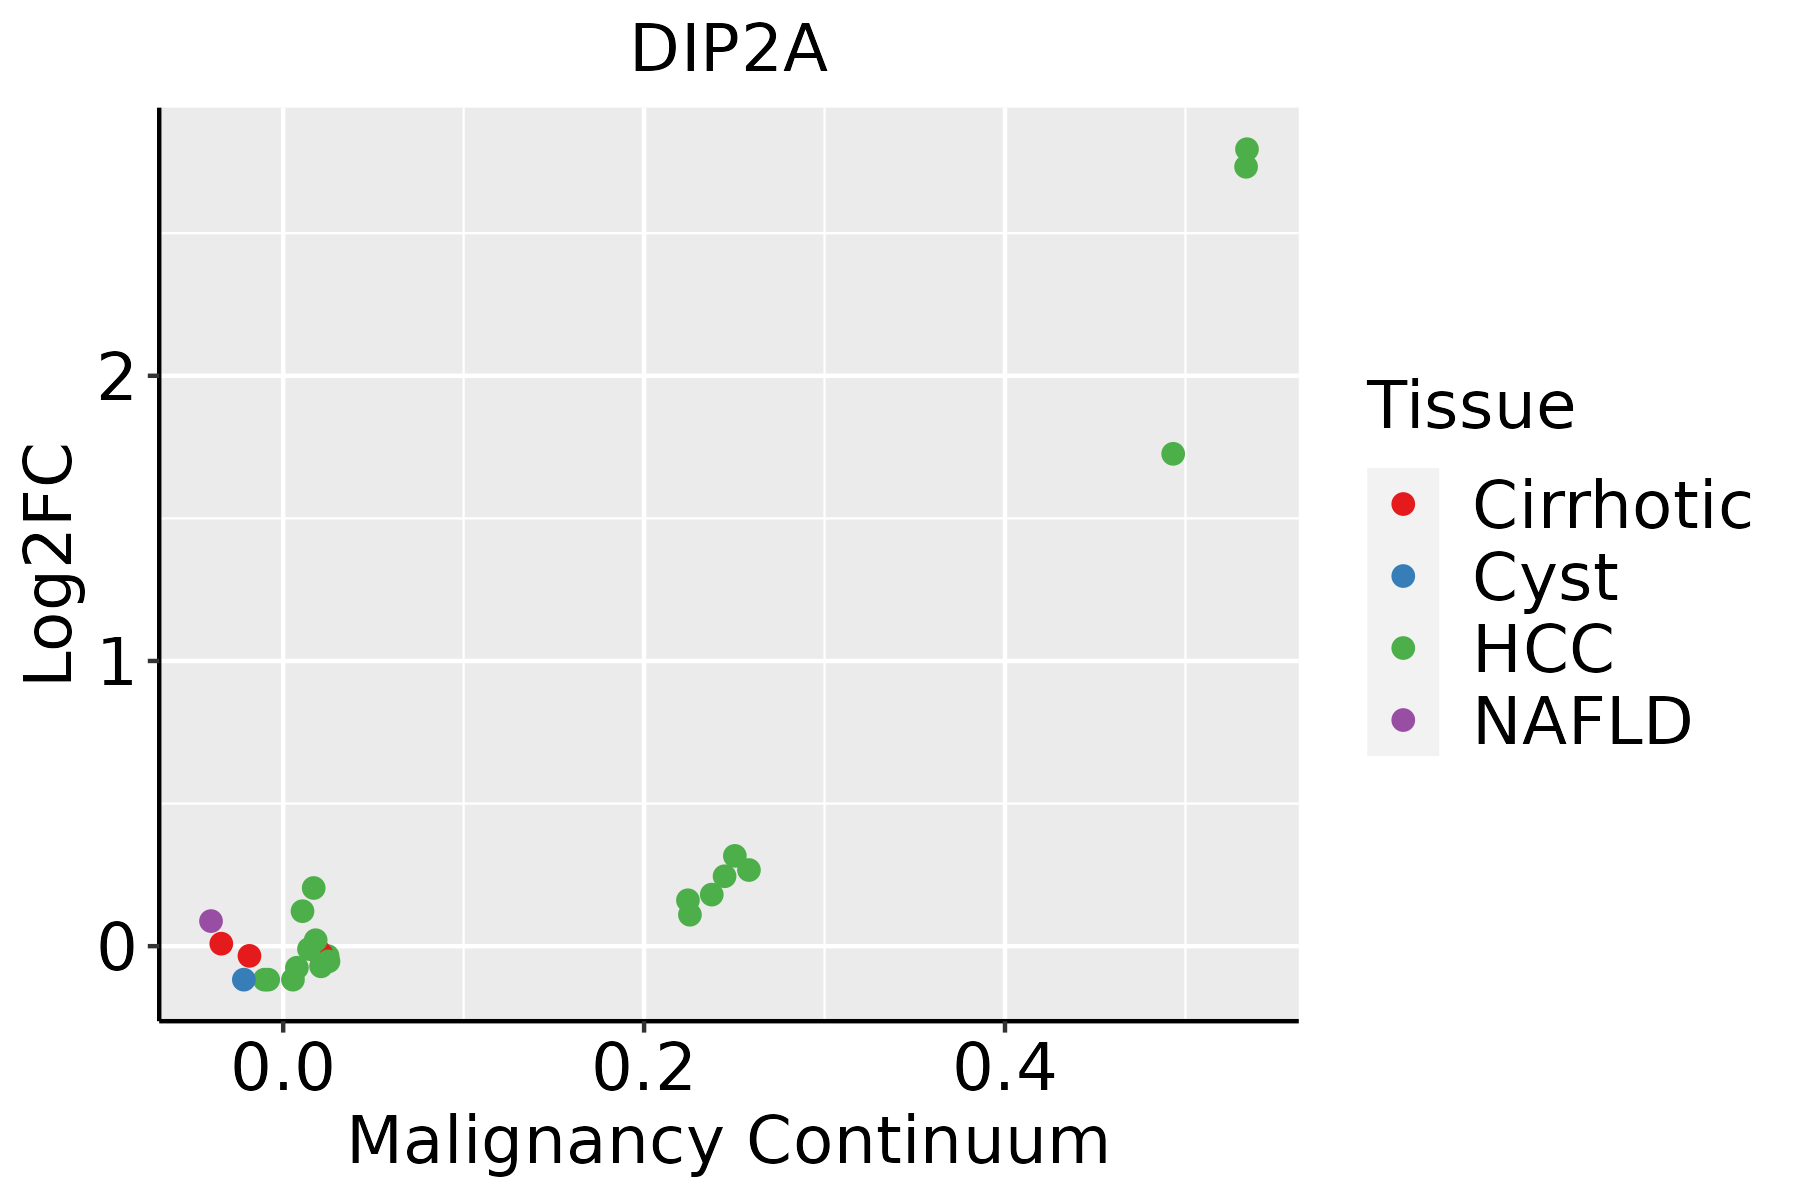
HCC: Hepatocellular carcinoma
NAFLD: Non-alcoholic fatty liver disease
Oral CavityThe image shows the transcriptomic changes along malignancy continuum.log2FC in expression of this searched gene in stem-like cells from each diseased tissue sample relative to stem-like cells in normal samples in each tissue plotted against the malignancy continuum. Samples are colored based on if they are from different disease stage.EOLP: Erosive Oral lichen planus
LP: leukoplakia
NEOLP: Non-erosive oral lichen planus
OSCC: Oral squamous cell carcinoma
ProstateThe image shows the transcriptomic changes along malignancy continuum.log2FC in expression of this searched gene in stem-like cells from each diseased tissue sample relative to stem-like cells in normal samples in each tissue plotted against the malignancy continuum. Samples are colored based on if they are from different disease stage.
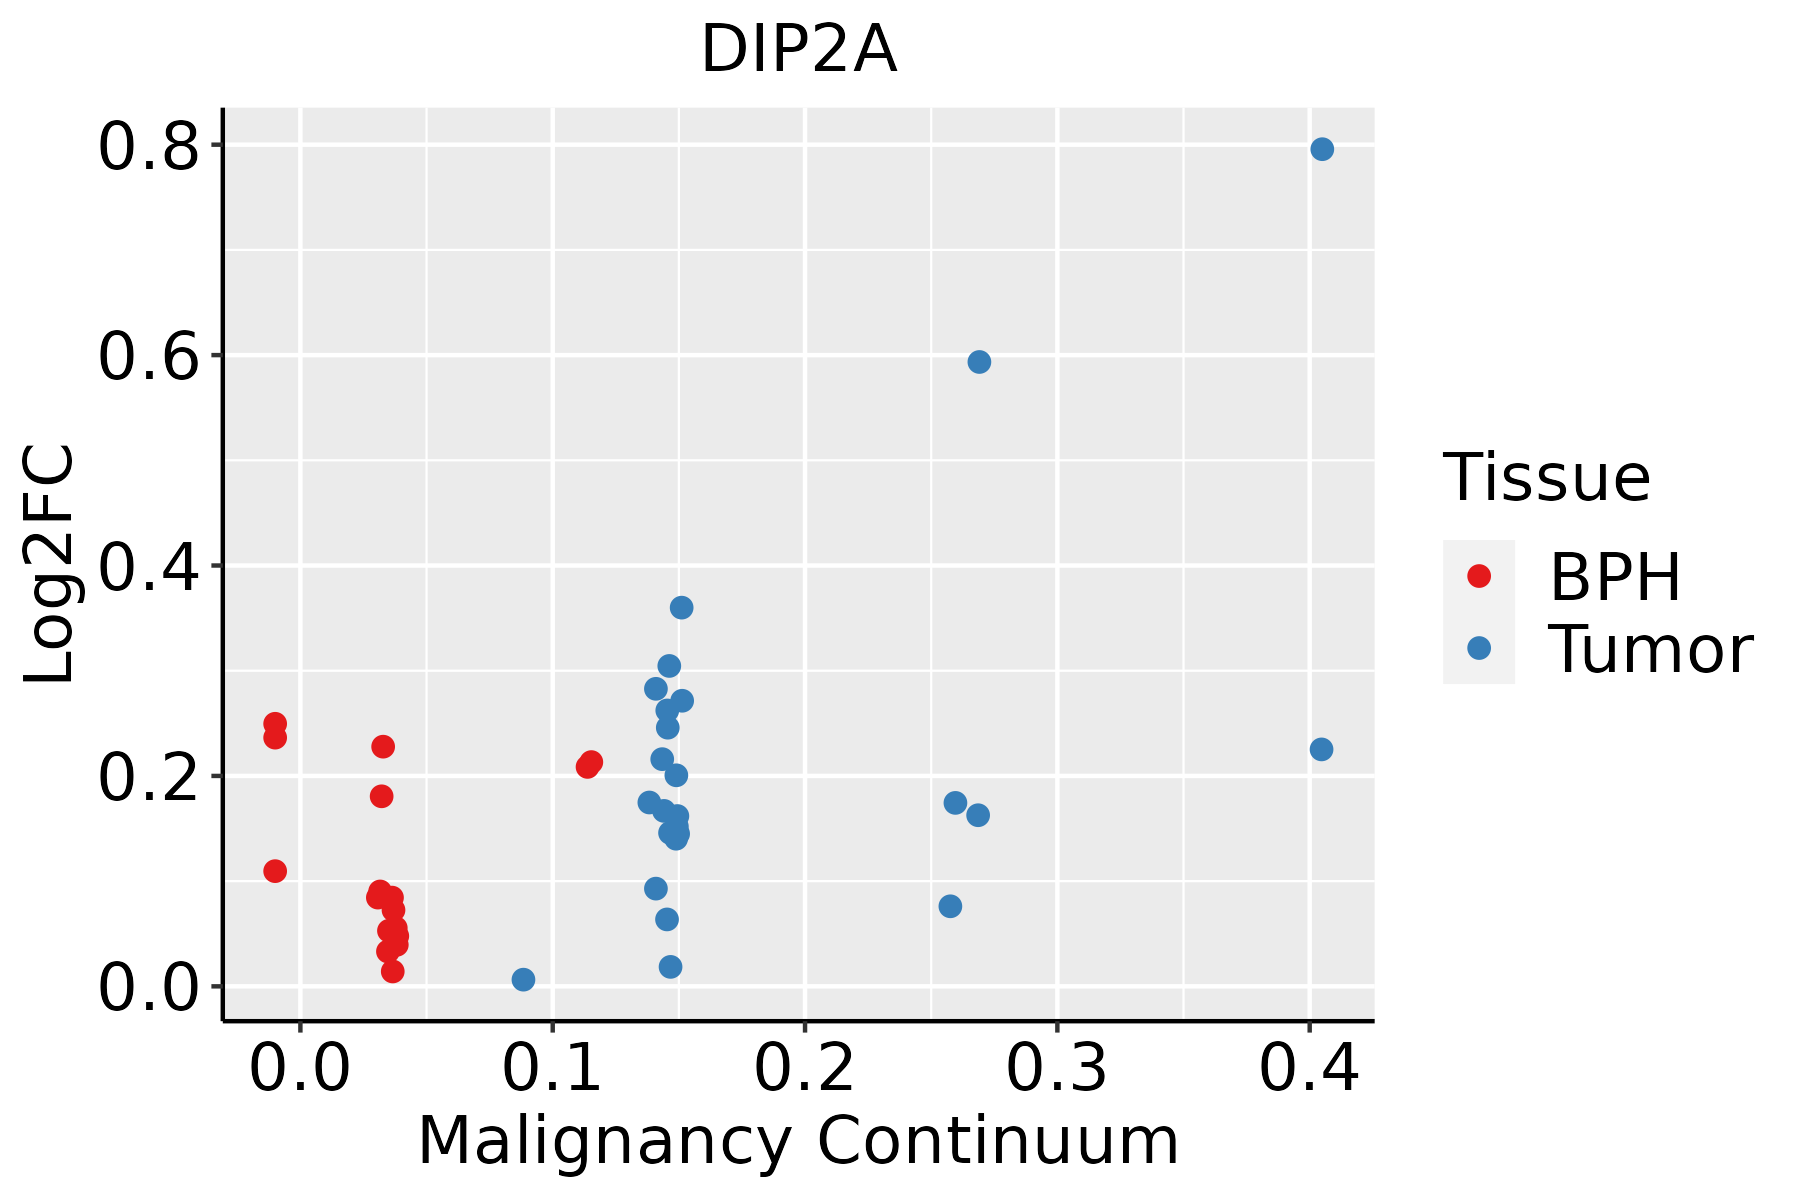
BPH: Benign Prostatic Hyperplasia
ThyroidThe image shows the transcriptomic changes along malignancy continuum.log2FC in expression of this searched gene in stem-like cells from each diseased tissue sample relative to stem-like cells in normal samples in each tissue plotted against the malignancy continuum. Samples are colored based on if they are from different disease stage.ATC: Anaplastic thyroid cancer
HT: Hashimoto's thyroiditis
PTC: Papillary thyroid cancer
∗log2FC in expression of this searched gene in stem-like cells from each diseased tissue sample relative to stem-like cells in normal samples in each tissue plotted against the malignancy continuum. Samples are colored based on if they are from different disease stage.

Top

Malignant transformation related pathway analysis

check buttonFind out the enriched GO biological processes and KEGG pathways involved in transition from healthy to precancer to cancer
check button Figure of enriched GO biological processes.
TissueDisease StageEnriched GO biological Processes
ColorectumADGO analysis - Figure of enriched GO biological processes: Top 15 enriched GO BP terms are showed in the bar plot of each disease state in each tissue. Each row represents a significant GO biological process which is colored according to the -log10(p.adjust).
ColorectumSERGO analysis - Figure of enriched GO biological processes: Top 15 enriched GO BP terms are showed in the bar plot of each disease state in each tissue. Each row represents a significant GO biological process which is colored according to the -log10(p.adjust).
ColorectumMSSGO analysis - Figure of enriched GO biological processes: Top 15 enriched GO BP terms are showed in the bar plot of each disease state in each tissue. Each row represents a significant GO biological process which is colored according to the -log10(p.adjust).
ColorectumMSI-HGO analysis - Figure of enriched GO biological processes: Top 15 enriched GO BP terms are showed in the bar plot of each disease state in each tissue. Each row represents a significant GO biological process which is colored according to the -log10(p.adjust).
ColorectumFAPGO analysis - Figure of enriched GO biological processes: Top 15 enriched GO BP terms are showed in the bar plot of each disease state in each tissue. Each row represents a significant GO biological process which is colored according to the -log10(p.adjust).
∗Top 15 enriched GO BP terms are showed in the bar plot of each disease state in each tissue. Each row represents a significant GO biological process which is colored according to the -log10(p.adjust).
Page: 1 2 3 4 5 6 7 8 9 

check button Enriched GO biological processes.
GO IDTissueDisease StageDescriptionGene RatioBg Ratiopvaluep.adjustCount
GO:001820514EsophagusESCCpeptidyl-lysine modification259/8552376/187233.90e-205.26e-18259
GO:001839413EsophagusESCCpeptidyl-lysine acetylation123/8552169/187236.58e-132.94e-11123
GO:004354313EsophagusESCCprotein acylation165/8552243/187231.69e-127.14e-11165
GO:000647313EsophagusESCCprotein acetylation140/8552201/187234.37e-121.69e-10140
GO:0006753110EsophagusESCCnucleoside phosphate metabolic process288/8552497/187231.80e-083.50e-07288
GO:0019693111EsophagusESCCribose phosphate metabolic process234/8552396/187234.24e-087.76e-07234
GO:0009117111EsophagusESCCnucleotide metabolic process282/8552489/187234.70e-088.50e-07282
GO:00067906EsophagusESCCsulfur compound metabolic process201/8552339/187232.64e-073.94e-06201
GO:0009259111EsophagusESCCribonucleotide metabolic process224/8552385/187234.41e-076.00e-06224
GO:0072521111EsophagusESCCpurine-containing compound metabolic process238/8552416/187231.20e-061.49e-05238
GO:0009150111EsophagusESCCpurine ribonucleotide metabolic process213/8552368/187231.40e-061.69e-05213
GO:0046390110EsophagusESCCribose phosphate biosynthetic process119/8552190/187231.73e-062.06e-05119
GO:00442725EsophagusESCCsulfur compound biosynthetic process96/8552148/187231.86e-062.16e-0596
GO:0006163111EsophagusESCCpurine nucleotide metabolic process226/8552396/187232.81e-063.21e-05226
GO:000916516EsophagusESCCnucleotide biosynthetic process150/8552254/187231.12e-051.06e-04150
GO:0009260110EsophagusESCCribonucleotide biosynthetic process112/8552182/187231.12e-051.06e-04112
GO:190129316EsophagusESCCnucleoside phosphate biosynthetic process151/8552256/187231.15e-051.08e-04151
GO:00338664EsophagusESCCnucleoside bisphosphate biosynthetic process44/855260/187231.25e-051.15e-0444
GO:00340304EsophagusESCCribonucleoside bisphosphate biosynthetic process44/855260/187231.25e-051.15e-0444
GO:00340334EsophagusESCCpurine nucleoside bisphosphate biosynthetic process44/855260/187231.25e-051.15e-0444
Page: 1 2 3 4 5 6 7 8 9 10 11 12 13 

check button Enriched KEGG pathways.
Pathway IDTissueDisease StageDescriptionGene RatioBg Ratiopvaluep.adjustqvalueCount
Page: 1 

Top

Cell-cell communication analysis

check buttonIdentification of potential cell-cell interactions between two cell types and their ligand-receptor pairs for different disease states
LigandReceptorLRpairPathwayTissueDisease Stage
Page: 1 

Top

Single-cell gene regulatory network inference analysis

check buttonFind out the significant the regulons (TFs) and the target genes of each regulon across cell types for different disease states
TFCell TypeTissueDisease StageTarget GeneRSSRegulon Activity
∗The dot plots of a searched regulon are shown for all cell subpopulations in each disease state of each tissue based on the regulon specific score inferred using pySCENIC and by calculating the average expression.
Page: 1 

Top

Somatic mutation of malignant transformation related genes

check buttonAnnotation of somatic variants for genes involved in malignant transformation
Hugo SymbolVariant ClassVariant ClassificationdbSNP RSHGVScHGVSpHGVSp ShortSWISSPROTBIOTYPESIFTPolyPhenTumor Sample BarcodeTissueHistologySexAgeStageTherapy TypesDrugsOutcome
DIP2ASNVMissense_Mutationrs763963275c.1729G>Ap.Val577Metp.V577MQ14689protein_codingdeleterious(0.01)probably_damaging(0.955)TCGA-A2-A0EY-01Breastbreast invasive carcinomaFemale<65I/IIChemotherapyadriamycinSD
DIP2ASNVMissense_Mutationc.3067N>Tp.His1023Tyrp.H1023YQ14689protein_codingtolerated(0.12)possibly_damaging(0.798)TCGA-AN-A0AK-01Breastbreast invasive carcinomaFemale>=65I/IIUnknownUnknownSD
DIP2ASNVMissense_Mutationc.160C>Gp.Gln54Glup.Q54EQ14689protein_codingtolerated(0.22)benign(0.003)TCGA-AN-A0FJ-01Breastbreast invasive carcinomaFemale<65III/IVUnknownUnknownSD
DIP2ASNVMissense_Mutationc.3214G>Ap.Val1072Metp.V1072MQ14689protein_codingtolerated(0.1)probably_damaging(0.964)TCGA-AR-A251-01Breastbreast invasive carcinomaFemale<65III/IVChemotherapydoxorubicinSD
DIP2ASNVMissense_Mutationnovelc.2981N>Tp.Arg994Leup.R994LQ14689protein_codingdeleterious(0.02)probably_damaging(0.945)TCGA-B6-A0RQ-01Breastbreast invasive carcinomaFemale>=65I/IIUnknownUnknownSD
DIP2ASNVMissense_Mutationc.4448G>Ap.Arg1483Lysp.R1483KQ14689protein_codingtolerated(1)benign(0.006)TCGA-BH-A0HF-01Breastbreast invasive carcinomaFemale>=65I/IIHormone TherapyarimidexSD
DIP2ASNVMissense_Mutationnovelc.4198T>Cp.Tyr1400Hisp.Y1400HQ14689protein_codingdeleterious(0)benign(0.443)TCGA-D8-A1XK-01Breastbreast invasive carcinomaFemale<65I/IIChemotherapydoxorubicine+cyclophosphamideSD
DIP2ASNVMissense_Mutationc.2386A>Tp.Ile796Phep.I796FQ14689protein_codingdeleterious(0.01)possibly_damaging(0.493)TCGA-D8-A1XR-01Breastbreast invasive carcinomaFemale<65I/IIChemotherapyadriamycin+cyclophosphamideSD
DIP2ASNVMissense_Mutationrs377394571c.434C>Gp.Ser145Cysp.S145CQ14689protein_codingdeleterious(0)probably_damaging(0.91)TCGA-D8-A1XY-01Breastbreast invasive carcinomaFemale>=65I/IIChemotherapytamoxiphenSD
DIP2ASNVMissense_Mutationc.968N>Gp.Glu323Glyp.E323GQ14689protein_codingdeleterious(0.03)possibly_damaging(0.858)TCGA-E9-A1R4-01Breastbreast invasive carcinomaFemale>=65I/IIChemotherapy5-fluorouracilSD
Page: 1 2 3 4 5 6 7 8 9 10 11 12 13 14 15 16 17 

Top

Related drugs of malignant transformation related genes

check buttonIdentification of chemicals and drugs interact with genes involved in malignant transfromation
(DGIdb 4.0)
Entrez IDSymbolCategoryInteraction TypesDrug Claim NameDrug NamePMIDs
Page: 1