
|
|||||
|
 | |
| |
| |
| |
| |
| |
|
Gene: DIO2 |
Gene summary for DIO2 |
| Gene information | Species | Human | Gene symbol | DIO2 | Gene ID | 1734 |
| Gene name | iodothyronine deiodinase 2 | |
| Gene Alias | 5DII | |
| Cytomap | 14q31.1 | |
| Gene Type | protein-coding | GO ID | GO:0001514 | UniProtAcc | A8K845 |
Top |
Malignant transformation analysis |
| Identification of the aberrant gene expression in precancerous and cancerous lesions by comparing the gene expression of stem-like cells in diseased tissues with normal stem cells |
| Entrez ID | Symbol | Replicates | Species | Organ | Tissue | Adj P-value | Log2FC | Malignancy |
| 1734 | DIO2 | AEH-subject1 | Human | Endometrium | AEH | 1.41e-03 | -4.14e-01 | -0.3059 |
| 1734 | DIO2 | AEH-subject2 | Human | Endometrium | AEH | 2.73e-19 | -5.06e-01 | -0.2525 |
| 1734 | DIO2 | AEH-subject3 | Human | Endometrium | AEH | 2.07e-07 | -4.59e-01 | -0.2576 |
| 1734 | DIO2 | AEH-subject5 | Human | Endometrium | AEH | 5.83e-13 | -5.17e-01 | -0.2953 |
| 1734 | DIO2 | EEC-subject1 | Human | Endometrium | EEC | 5.32e-11 | -4.68e-01 | -0.2682 |
| 1734 | DIO2 | EEC-subject2 | Human | Endometrium | EEC | 4.72e-24 | -5.51e-01 | -0.2607 |
| 1734 | DIO2 | EEC-subject3 | Human | Endometrium | EEC | 1.14e-12 | -4.68e-01 | -0.2525 |
| 1734 | DIO2 | EEC-subject4 | Human | Endometrium | EEC | 3.30e-18 | -5.37e-01 | -0.2571 |
| 1734 | DIO2 | EEC-subject5 | Human | Endometrium | EEC | 1.44e-17 | -5.53e-01 | -0.249 |
| 1734 | DIO2 | GSM5276935 | Human | Endometrium | EEC | 5.36e-14 | -5.37e-01 | -0.123 |
| 1734 | DIO2 | GSM5276937 | Human | Endometrium | EEC | 3.43e-03 | -3.00e-01 | -0.0897 |
| 1734 | DIO2 | GSM6177620_NYU_UCEC1_lib1_lib1 | Human | Endometrium | EEC | 1.93e-23 | -5.67e-01 | -0.1869 |
| 1734 | DIO2 | GSM6177620_NYU_UCEC1_lib2_lib2 | Human | Endometrium | EEC | 3.43e-18 | -5.46e-01 | -0.1875 |
| 1734 | DIO2 | GSM6177620_NYU_UCEC1_lib3_lib3 | Human | Endometrium | EEC | 3.04e-21 | -5.54e-01 | -0.1883 |
| 1734 | DIO2 | GSM6177621_NYU_UCEC2_lib1_lib1 | Human | Endometrium | EEC | 4.06e-19 | -5.37e-01 | -0.1934 |
| 1734 | DIO2 | GSM6177622_NYU_UCEC3_lib1_lib1 | Human | Endometrium | EEC | 4.72e-24 | -5.67e-01 | -0.1917 |
| 1734 | DIO2 | GSM6177622_NYU_UCEC3_lib2_lib2 | Human | Endometrium | EEC | 2.23e-31 | -5.67e-01 | -0.1916 |
| 1734 | DIO2 | GSM6177623_NYU_UCEC3_Vis | Human | Endometrium | EEC | 2.27e-18 | -5.35e-01 | -0.1269 |
| 1734 | DIO2 | Adj_PTCwithHT_6 | Human | Thyroid | HT | 4.76e-12 | -5.71e-01 | 0.02 |
| 1734 | DIO2 | PTCwithHT_1 | Human | Thyroid | HT | 4.80e-03 | -6.02e-01 | 0.0238 |
| Page: 1 2 |
| Tissue | Expression Dynamics | Abbreviation |
| Endometrium | 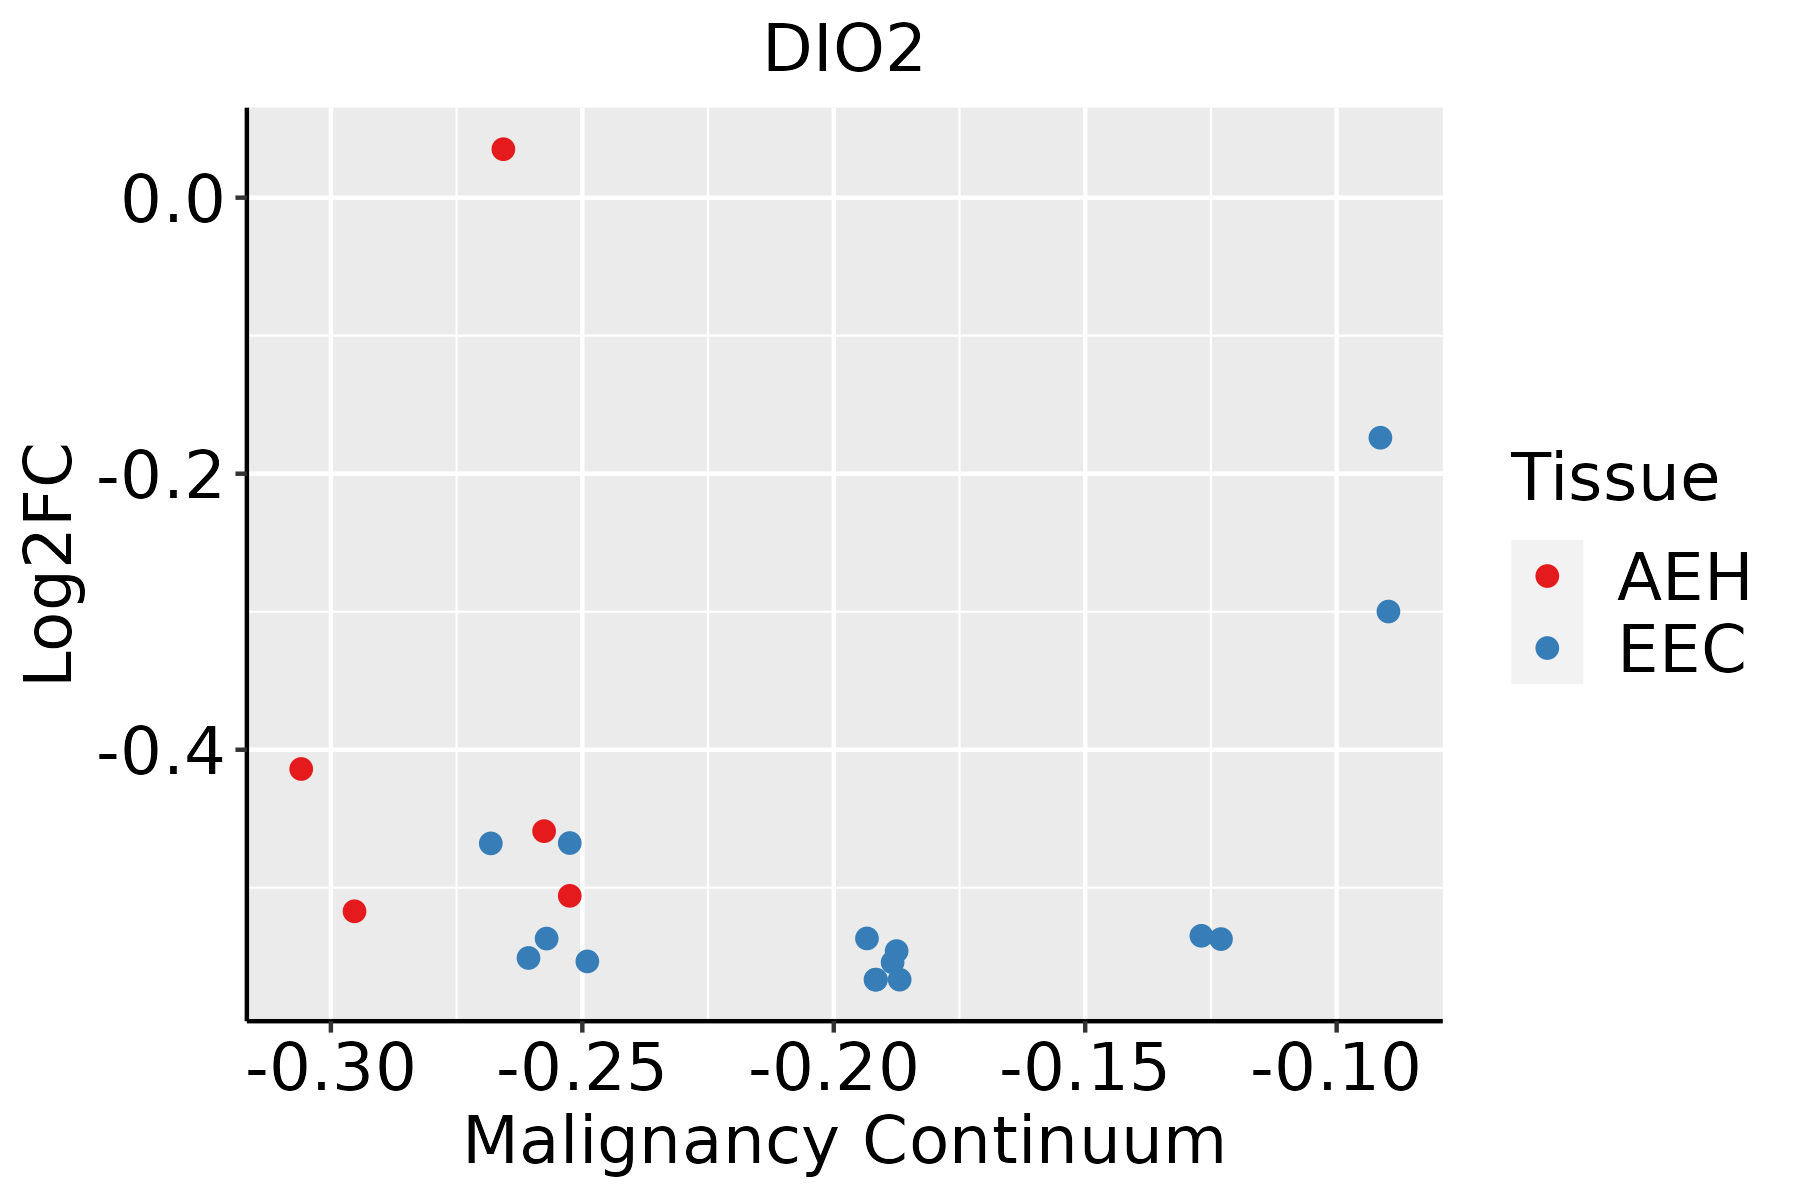 | AEH: Atypical endometrial hyperplasia |
| EEC: Endometrioid Cancer | ||
| Skin |  | AK: Actinic keratosis |
| cSCC: Cutaneous squamous cell carcinoma | ||
| SCCIS:squamous cell carcinoma in situ | ||
| Thyroid | 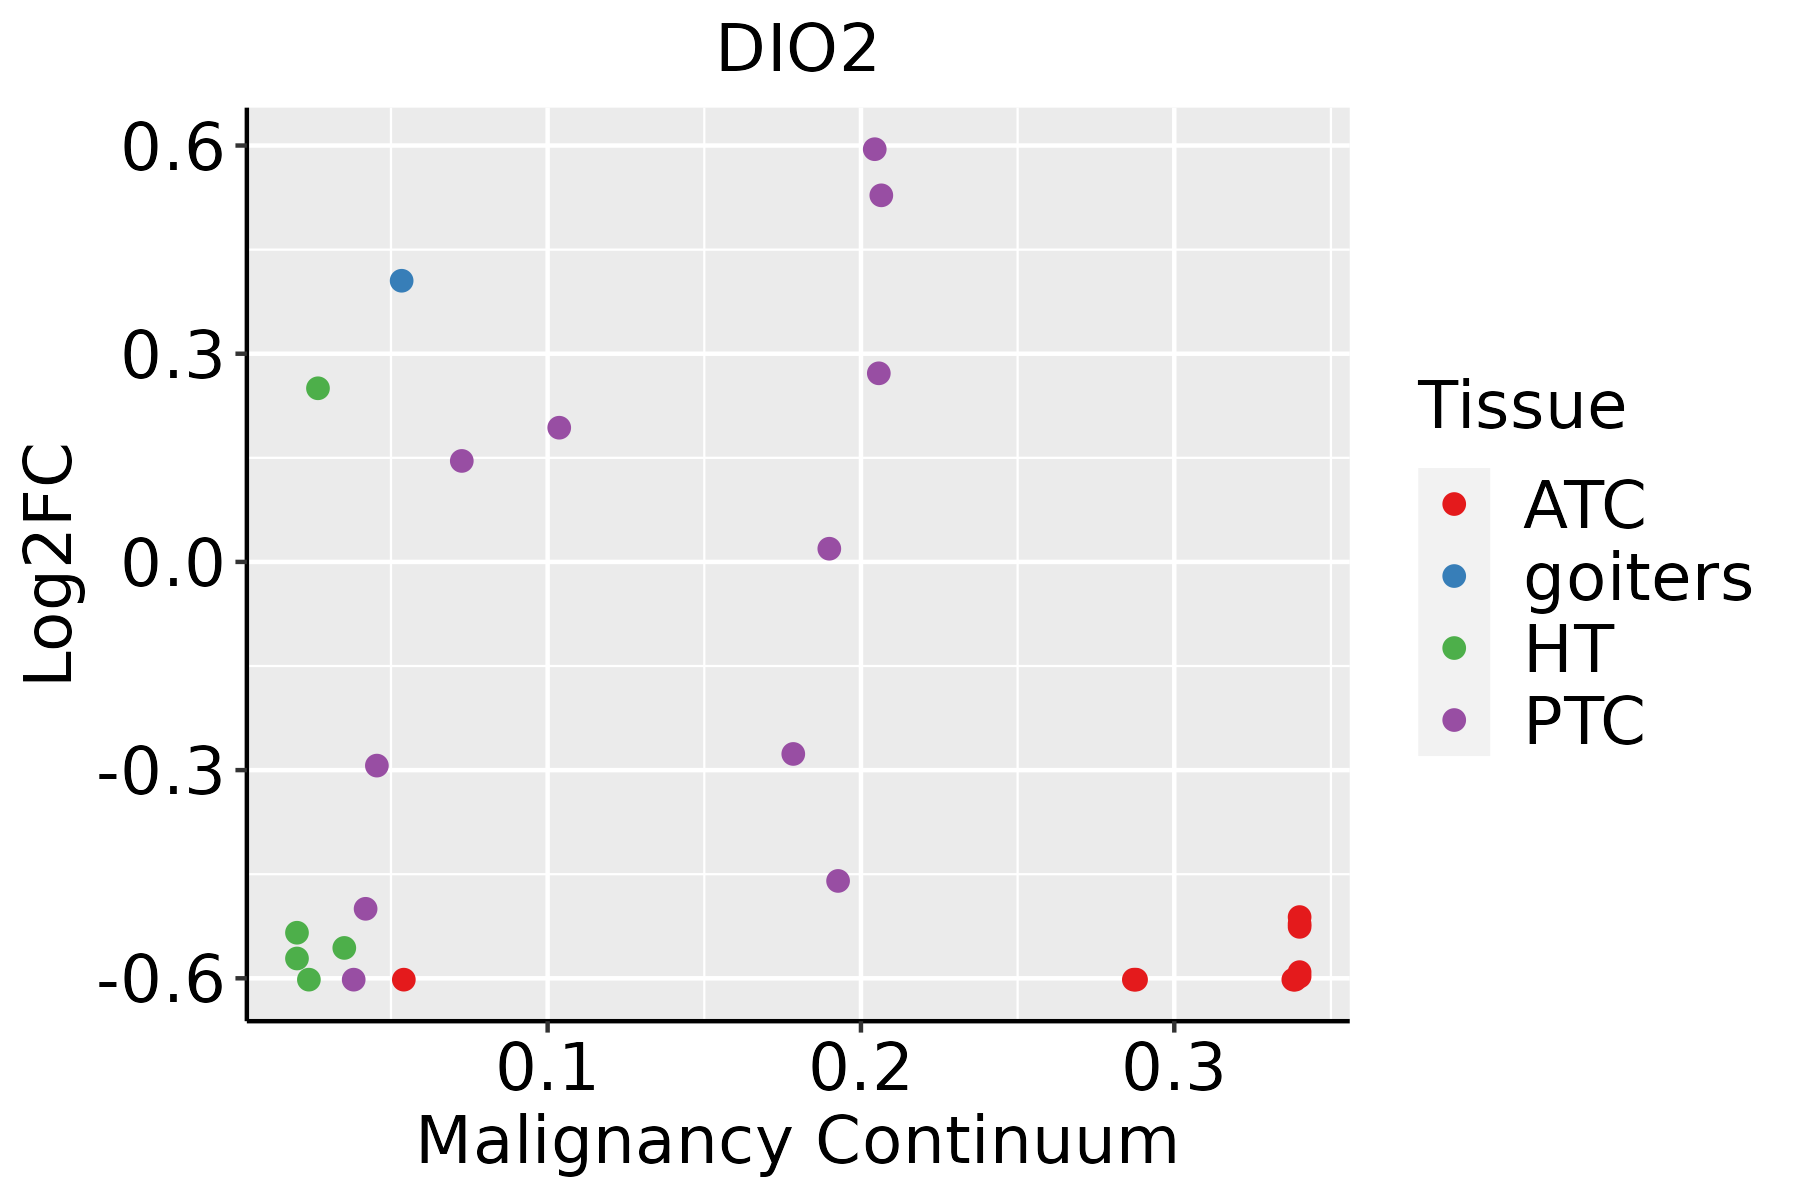 | ATC: Anaplastic thyroid cancer |
| HT: Hashimoto's thyroiditis | ||
| PTC: Papillary thyroid cancer |
| ∗log2FC in expression of this searched gene in stem-like cells from each diseased tissue sample relative to stem-like cells in normal samples in each tissue plotted against the malignancy continuum. Samples are colored based on if they are from different disease stage. |
Top |
Malignant transformation related pathway analysis |
| Find out the enriched GO biological processes and KEGG pathways involved in transition from healthy to precancer to cancer |
| Tissue | Disease Stage | Enriched GO biological Processes |
| Colorectum | AD |  |
| Colorectum | SER |  |
| Colorectum | MSS |  |
| Colorectum | MSI-H |  |
| Colorectum | FAP |  |
| ∗Top 15 enriched GO BP terms are showed in the bar plot of each disease state in each tissue. Each row represents a significant GO biological process which is colored according to the -log10(p.adjust). |
| Page: 1 2 3 4 5 6 7 8 9 |
| GO ID | Tissue | Disease Stage | Description | Gene Ratio | Bg Ratio | pvalue | p.adjust | Count |
| GO:000641716 | Endometrium | AEH | regulation of translation | 94/2100 | 468/18723 | 1.14e-08 | 7.62e-07 | 94 |
| GO:00194399 | Endometrium | AEH | aromatic compound catabolic process | 80/2100 | 467/18723 | 7.21e-05 | 1.10e-03 | 80 |
| GO:19013619 | Endometrium | AEH | organic cyclic compound catabolic process | 83/2100 | 495/18723 | 1.13e-04 | 1.60e-03 | 83 |
| GO:00064149 | Endometrium | AEH | translational elongation | 13/2100 | 55/18723 | 6.76e-03 | 3.94e-02 | 13 |
| GO:000641717 | Endometrium | EEC | regulation of translation | 94/2168 | 468/18723 | 5.37e-08 | 2.88e-06 | 94 |
| GO:001943913 | Endometrium | EEC | aromatic compound catabolic process | 83/2168 | 467/18723 | 4.32e-05 | 7.10e-04 | 83 |
| GO:190136113 | Endometrium | EEC | organic cyclic compound catabolic process | 86/2168 | 495/18723 | 7.31e-05 | 1.07e-03 | 86 |
| GO:00454446 | Endometrium | EEC | fat cell differentiation | 39/2168 | 229/18723 | 8.69e-03 | 4.71e-02 | 39 |
| GO:000641414 | Endometrium | EEC | translational elongation | 13/2168 | 55/18723 | 8.79e-03 | 4.74e-02 | 13 |
| GO:000641730 | Thyroid | HT | regulation of translation | 78/1272 | 468/18723 | 1.12e-13 | 2.83e-11 | 78 |
| GO:00065759 | Thyroid | HT | cellular modified amino acid metabolic process | 28/1272 | 188/18723 | 7.21e-05 | 1.31e-03 | 28 |
| GO:0006590 | Thyroid | HT | thyroid hormone generation | 7/1272 | 20/18723 | 2.32e-04 | 3.29e-03 | 7 |
| GO:0042403 | Thyroid | HT | thyroid hormone metabolic process | 8/1272 | 27/18723 | 3.07e-04 | 4.08e-03 | 8 |
| GO:004544417 | Thyroid | HT | fat cell differentiation | 29/1272 | 229/18723 | 8.88e-04 | 9.30e-03 | 29 |
| GO:19908455 | Thyroid | HT | adaptive thermogenesis | 22/1272 | 157/18723 | 9.54e-04 | 9.83e-03 | 22 |
| GO:000641424 | Thyroid | HT | translational elongation | 11/1272 | 55/18723 | 1.02e-03 | 1.04e-02 | 11 |
| GO:00016595 | Thyroid | HT | temperature homeostasis | 23/1272 | 174/18723 | 1.64e-03 | 1.50e-02 | 23 |
| GO:01061067 | Thyroid | HT | cold-induced thermogenesis | 20/1272 | 144/18723 | 1.77e-03 | 1.59e-02 | 20 |
| GO:01201617 | Thyroid | HT | regulation of cold-induced thermogenesis | 20/1272 | 144/18723 | 1.77e-03 | 1.59e-02 | 20 |
| GO:001943920 | Thyroid | HT | aromatic compound catabolic process | 48/1272 | 467/18723 | 2.74e-03 | 2.25e-02 | 48 |
| Page: 1 2 3 |
| Pathway ID | Tissue | Disease Stage | Description | Gene Ratio | Bg Ratio | pvalue | p.adjust | qvalue | Count |
| hsa0491920 | Endometrium | AEH | Thyroid hormone signaling pathway | 30/1197 | 121/8465 | 1.20e-03 | 7.52e-03 | 5.50e-03 | 30 |
| hsa04919110 | Endometrium | AEH | Thyroid hormone signaling pathway | 30/1197 | 121/8465 | 1.20e-03 | 7.52e-03 | 5.50e-03 | 30 |
| hsa0491923 | Endometrium | EEC | Thyroid hormone signaling pathway | 29/1237 | 121/8465 | 4.08e-03 | 2.24e-02 | 1.67e-02 | 29 |
| hsa0491933 | Endometrium | EEC | Thyroid hormone signaling pathway | 29/1237 | 121/8465 | 4.08e-03 | 2.24e-02 | 1.67e-02 | 29 |
| Page: 1 |
Top |
Cell-cell communication analysis |
| Identification of potential cell-cell interactions between two cell types and their ligand-receptor pairs for different disease states |
| Ligand | Receptor | LRpair | Pathway | Tissue | Disease Stage |
| Page: 1 |
Top |
Single-cell gene regulatory network inference analysis |
| Find out the significant the regulons (TFs) and the target genes of each regulon across cell types for different disease states |
| TF | Cell Type | Tissue | Disease Stage | Target Gene | RSS | Regulon Activity |
| ∗The dot plots of a searched regulon are shown for all cell subpopulations in each disease state of each tissue based on the regulon specific score inferred using pySCENIC and by calculating the average expression. |
| Page: 1 |
Top |
Somatic mutation of malignant transformation related genes |
| Annotation of somatic variants for genes involved in malignant transformation |
| Hugo Symbol | Variant Class | Variant Classification | dbSNP RS | HGVSc | HGVSp | HGVSp Short | SWISSPROT | BIOTYPE | SIFT | PolyPhen | Tumor Sample Barcode | Tissue | Histology | Sex | Age | Stage | Therapy Types | Drugs | Outcome |
| DIO2 | SNV | Missense_Mutation | c.550N>A | p.Glu184Lys | p.E184K | protein_coding | tolerated(0.15) | benign(0.097) | TCGA-E2-A15R-01 | Breast | breast invasive carcinoma | Female | <65 | I/II | Chemotherapy | cyclophosphamide | SD | ||
| DIO2 | deletion | Frame_Shift_Del | c.285_289delNNNNN | p.Tyr96LysfsTer? | p.Y96Kfs*? | protein_coding | TCGA-A2-A0T7-01 | Breast | breast invasive carcinoma | Female | <65 | I/II | Chemotherapy | adriamycin | SD | ||||
| DIO2 | SNV | Missense_Mutation | c.722N>T | p.Pro241Leu | p.P241L | protein_coding | tolerated(0.07) | benign(0.028) | TCGA-AA-A02R-01 | Colorectum | colon adenocarcinoma | Female | >=65 | I/II | Unknown | Unknown | PD | ||
| DIO2 | SNV | Missense_Mutation | c.626N>T | p.Pro209Leu | p.P209L | protein_coding | deleterious(0.01) | benign(0.441) | TCGA-AD-6889-01 | Colorectum | colon adenocarcinoma | Male | >=65 | I/II | Chemotherapy | xeloda | PD | ||
| DIO2 | SNV | Missense_Mutation | c.878N>T | p.Trp293Leu | p.W293L | protein_coding | tolerated(0.07) | probably_damaging(0.966) | TCGA-AF-A56K-01 | Colorectum | rectum adenocarcinoma | Male | <65 | I/II | Unknown | Unknown | PD | ||
| DIO2 | SNV | Missense_Mutation | rs773948064 | c.748C>T | p.Arg250Cys | p.R250C | protein_coding | tolerated(0.42) | benign(0) | TCGA-AG-3909-01 | Colorectum | rectum adenocarcinoma | Female | >=65 | III/IV | Chemotherapy | folinic | CR | |
| DIO2 | SNV | Missense_Mutation | rs540962070 | c.181N>T | p.Arg61Cys | p.R61C | protein_coding | deleterious(0) | probably_damaging(0.954) | TCGA-F5-6814-01 | Colorectum | rectum adenocarcinoma | Male | <65 | I/II | Unknown | Unknown | SD | |
| DIO2 | SNV | Missense_Mutation | rs553834317 | c.538C>T | p.Arg180Cys | p.R180C | protein_coding | tolerated(0.09) | benign(0.003) | TCGA-A5-A0G1-01 | Endometrium | uterine corpus endometrioid carcinoma | Female | >=65 | I/II | Unknown | Unknown | SD | |
| DIO2 | SNV | Missense_Mutation | novel | c.373G>C | p.Val125Leu | p.V125L | protein_coding | tolerated(0.7) | benign(0.006) | TCGA-A5-A0G1-01 | Endometrium | uterine corpus endometrioid carcinoma | Female | >=65 | I/II | Unknown | Unknown | SD | |
| DIO2 | SNV | Missense_Mutation | novel | c.840G>T | p.Lys280Asn | p.K280N | protein_coding | tolerated(0.17) | benign(0.019) | TCGA-A5-A1OF-01 | Endometrium | uterine corpus endometrioid carcinoma | Female | <65 | I/II | Unknown | Unknown | SD |
| Page: 1 2 3 4 5 6 7 |
Top |
Related drugs of malignant transformation related genes |
| Identification of chemicals and drugs interact with genes involved in malignant transfromation |
| (DGIdb 4.0) |
| Entrez ID | Symbol | Category | Interaction Types | Drug Claim Name | Drug Name | PMIDs |
| Page: 1 |

Copyright 2023-Present -The University of Texas Health Science Center at Houston |