
|
|||||
|
 | |
| |
| |
| |
| |
| |
|
Gene: DIO1 |
Gene summary for DIO1 |
| Gene information | Species | Human | Gene symbol | DIO1 | Gene ID | 1733 |
| Gene name | iodothyronine deiodinase 1 | |
| Gene Alias | 5DI | |
| Cytomap | 1p32.3 | |
| Gene Type | protein-coding | GO ID | GO:0006082 | UniProtAcc | A8K415 |
Top |
Malignant transformation analysis |
| Identification of the aberrant gene expression in precancerous and cancerous lesions by comparing the gene expression of stem-like cells in diseased tissues with normal stem cells |
| Entrez ID | Symbol | Replicates | Species | Organ | Tissue | Adj P-value | Log2FC | Malignancy |
| 1733 | DIO1 | HCC1_Meng | Human | Liver | HCC | 2.79e-33 | 1.28e-01 | 0.0246 |
| 1733 | DIO1 | HCC1 | Human | Liver | HCC | 2.66e-10 | 3.45e+00 | 0.5336 |
| 1733 | DIO1 | HCC2 | Human | Liver | HCC | 6.30e-30 | 4.16e+00 | 0.5341 |
| 1733 | DIO1 | Pt13.b | Human | Liver | HCC | 2.79e-04 | 9.14e-02 | 0.0251 |
| 1733 | DIO1 | S027 | Human | Liver | HCC | 6.80e-10 | 1.01e+00 | 0.2446 |
| 1733 | DIO1 | S028 | Human | Liver | HCC | 6.26e-38 | 1.28e+00 | 0.2503 |
| 1733 | DIO1 | S029 | Human | Liver | HCC | 1.32e-45 | 1.89e+00 | 0.2581 |
| 1733 | DIO1 | PTC01 | Human | Thyroid | PTC | 1.09e-02 | -2.16e-01 | 0.1899 |
| 1733 | DIO1 | ATC5 | Human | Thyroid | ATC | 4.82e-02 | -2.20e-01 | 0.34 |
| Page: 1 |
| Tissue | Expression Dynamics | Abbreviation |
| Liver | 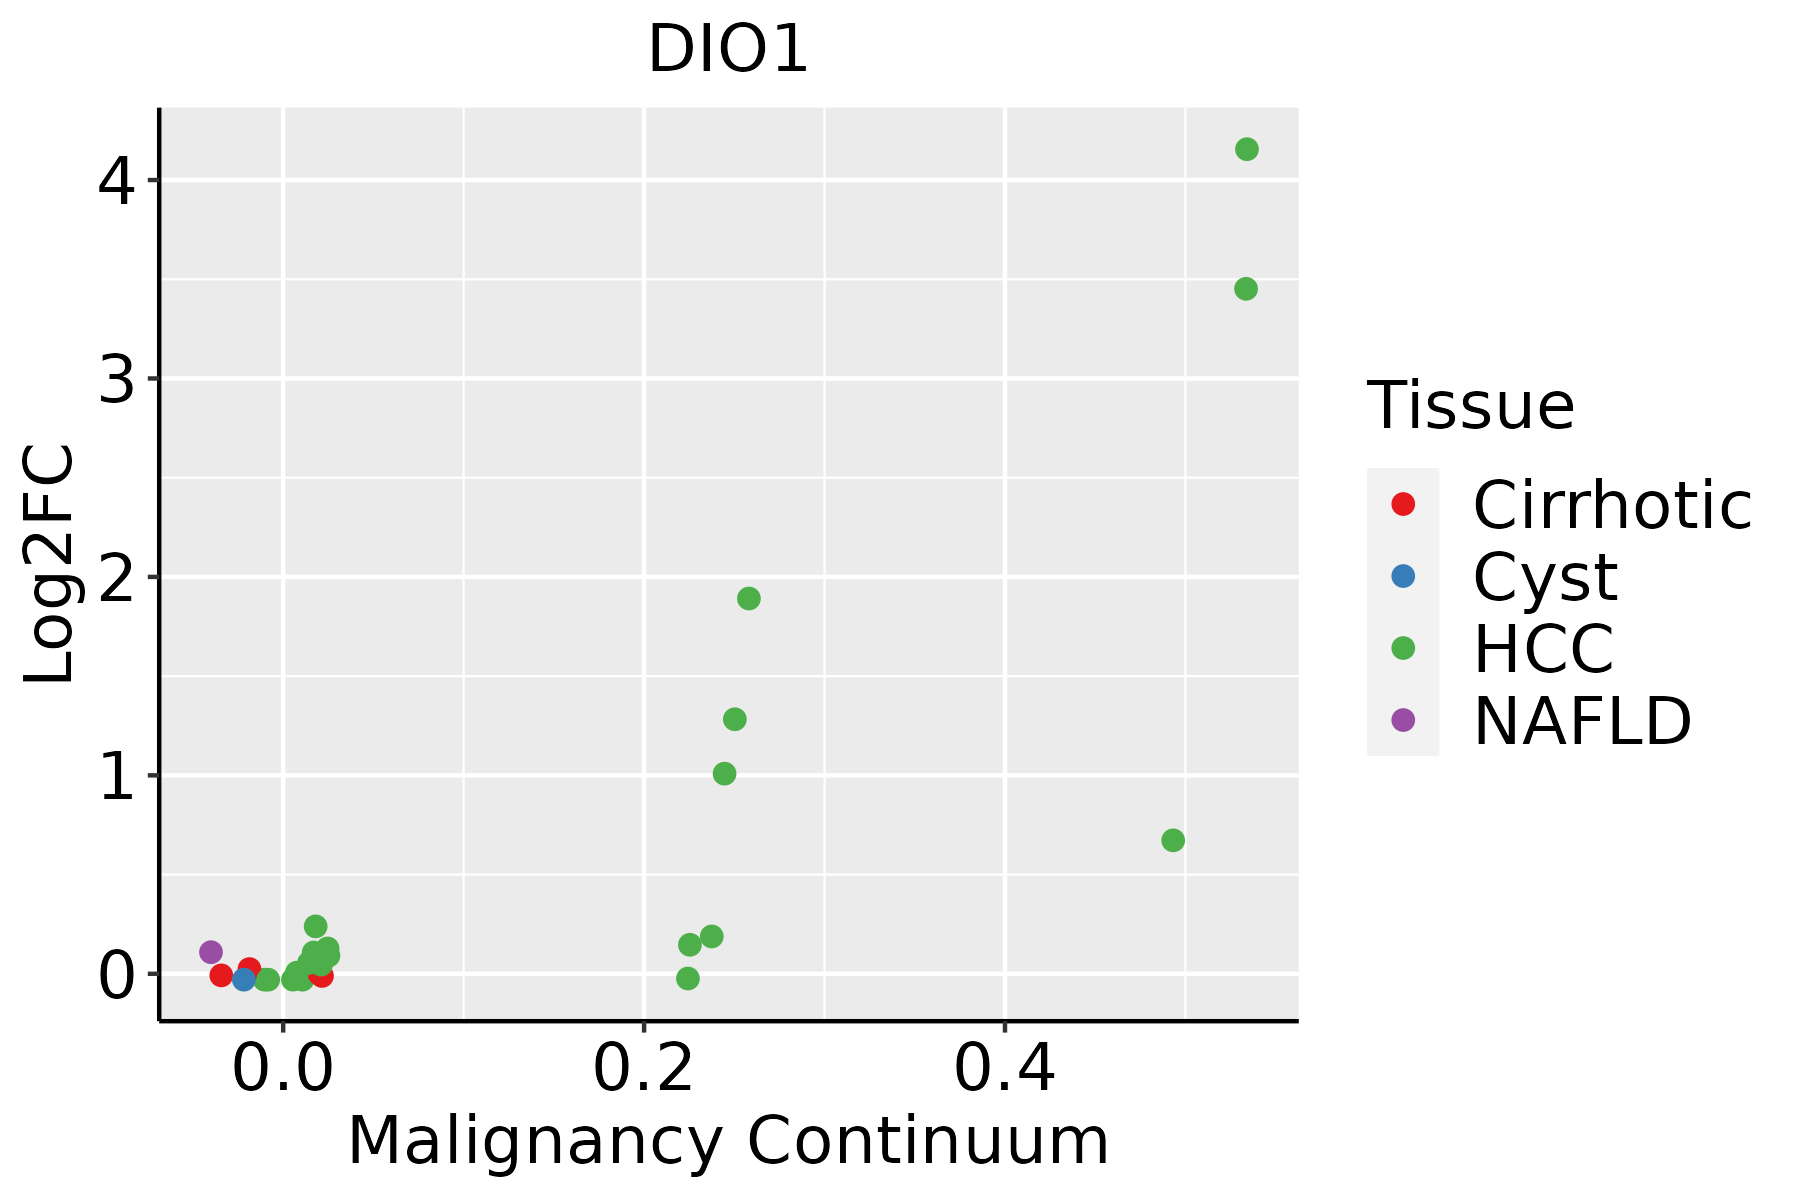 | HCC: Hepatocellular carcinoma |
| NAFLD: Non-alcoholic fatty liver disease | ||
| Thyroid |  | ATC: Anaplastic thyroid cancer |
| HT: Hashimoto's thyroiditis | ||
| PTC: Papillary thyroid cancer |
| ∗log2FC in expression of this searched gene in stem-like cells from each diseased tissue sample relative to stem-like cells in normal samples in each tissue plotted against the malignancy continuum. Samples are colored based on if they are from different disease stage. |
Top |
Malignant transformation related pathway analysis |
| Find out the enriched GO biological processes and KEGG pathways involved in transition from healthy to precancer to cancer |
| Tissue | Disease Stage | Enriched GO biological Processes |
| Colorectum | AD |  |
| Colorectum | SER |  |
| Colorectum | MSS |  |
| Colorectum | MSI-H |  |
| Colorectum | FAP |  |
| ∗Top 15 enriched GO BP terms are showed in the bar plot of each disease state in each tissue. Each row represents a significant GO biological process which is colored according to the -log10(p.adjust). |
| Page: 1 2 3 4 5 6 7 8 9 |
| GO ID | Tissue | Disease Stage | Description | Gene Ratio | Bg Ratio | pvalue | p.adjust | Count |
| GO:000657521 | Liver | HCC | cellular modified amino acid metabolic process | 119/7958 | 188/18723 | 6.47e-09 | 1.67e-07 | 119 |
| GO:00065202 | Liver | HCC | cellular amino acid metabolic process | 167/7958 | 284/18723 | 1.91e-08 | 4.56e-07 | 167 |
| GO:000657513 | Thyroid | PTC | cellular modified amino acid metabolic process | 85/5968 | 188/18723 | 8.29e-05 | 7.01e-04 | 85 |
| GO:00065901 | Thyroid | PTC | thyroid hormone generation | 14/5968 | 20/18723 | 5.24e-04 | 3.37e-03 | 14 |
| GO:00424031 | Thyroid | PTC | thyroid hormone metabolic process | 15/5968 | 27/18723 | 9.19e-03 | 3.79e-02 | 15 |
| GO:000657522 | Thyroid | ATC | cellular modified amino acid metabolic process | 82/6293 | 188/18723 | 2.60e-03 | 1.20e-02 | 82 |
| GO:00065903 | Thyroid | ATC | thyroid hormone generation | 12/6293 | 20/18723 | 1.39e-02 | 4.81e-02 | 12 |
| Page: 1 |
| Pathway ID | Tissue | Disease Stage | Description | Gene Ratio | Bg Ratio | pvalue | p.adjust | qvalue | Count |
| hsa0491912 | Liver | HCC | Thyroid hormone signaling pathway | 75/4020 | 121/8465 | 8.76e-04 | 3.38e-03 | 1.88e-03 | 75 |
| hsa0491913 | Liver | HCC | Thyroid hormone signaling pathway | 75/4020 | 121/8465 | 8.76e-04 | 3.38e-03 | 1.88e-03 | 75 |
| Page: 1 |
Top |
Cell-cell communication analysis |
| Identification of potential cell-cell interactions between two cell types and their ligand-receptor pairs for different disease states |
| Ligand | Receptor | LRpair | Pathway | Tissue | Disease Stage |
| Page: 1 |
Top |
Single-cell gene regulatory network inference analysis |
| Find out the significant the regulons (TFs) and the target genes of each regulon across cell types for different disease states |
| TF | Cell Type | Tissue | Disease Stage | Target Gene | RSS | Regulon Activity |
| ∗The dot plots of a searched regulon are shown for all cell subpopulations in each disease state of each tissue based on the regulon specific score inferred using pySCENIC and by calculating the average expression. |
| Page: 1 |
Top |
Somatic mutation of malignant transformation related genes |
| Annotation of somatic variants for genes involved in malignant transformation |
| Hugo Symbol | Variant Class | Variant Classification | dbSNP RS | HGVSc | HGVSp | HGVSp Short | SWISSPROT | BIOTYPE | SIFT | PolyPhen | Tumor Sample Barcode | Tissue | Histology | Sex | Age | Stage | Therapy Types | Drugs | Outcome |
| DIO1 | SNV | Missense_Mutation | rs377060126 | c.220N>A | p.Val74Ile | p.V74I | P49895 | protein_coding | tolerated(0.94) | benign(0.018) | TCGA-A7-A426-01 | Breast | breast invasive carcinoma | Female | <65 | III/IV | Chemotherapy | adriamycin | SD |
| DIO1 | insertion | In_Frame_Ins | novel | c.578_579insAGCCAGAGTGAACTTCAAGTGTAAATCTGGTTATTACAT | p.Gln193_Cys194insAlaArgValAsnPheLysCysLysSerGlyTyrTyrMet | p.Q193_C194insARVNFKCKSGYYM | P49895 | protein_coding | TCGA-A7-A0CG-01 | Breast | breast invasive carcinoma | Female | >=65 | I/II | Unknown | Unknown | SD | ||
| DIO1 | SNV | Missense_Mutation | novel | c.406N>C | p.Phe136Leu | p.F136L | P49895 | protein_coding | deleterious(0) | probably_damaging(0.996) | TCGA-AA-3947-01 | Colorectum | colon adenocarcinoma | Female | <65 | I/II | Unknown | Unknown | SD |
| DIO1 | SNV | Missense_Mutation | novel | c.416N>G | p.Leu139Arg | p.L139R | P49895 | protein_coding | deleterious(0) | probably_damaging(0.99) | TCGA-CA-6717-01 | Colorectum | colon adenocarcinoma | Male | <65 | I/II | Chemotherapy | oxaliplatin | CR |
| DIO1 | SNV | Missense_Mutation | novel | c.213C>A | p.Phe71Leu | p.F71L | P49895 | protein_coding | tolerated(0.69) | benign(0.031) | TCGA-AG-A002-01 | Colorectum | rectum adenocarcinoma | Male | <65 | I/II | Unknown | Unknown | SD |
| DIO1 | SNV | Missense_Mutation | novel | c.380N>T | p.Pro127Leu | p.P127L | P49895 | protein_coding | deleterious(0) | probably_damaging(0.999) | TCGA-AG-A023-01 | Colorectum | rectum adenocarcinoma | Female | <65 | III/IV | Unknown | Unknown | PD |
| DIO1 | SNV | Missense_Mutation | rs762243504 | c.538C>T | p.Arg180Cys | p.R180C | P49895 | protein_coding | deleterious(0) | probably_damaging(0.999) | TCGA-F5-6814-01 | Colorectum | rectum adenocarcinoma | Male | <65 | I/II | Unknown | Unknown | SD |
| DIO1 | SNV | Missense_Mutation | novel | c.640G>C | p.Glu214Gln | p.E214Q | P49895 | protein_coding | deleterious(0) | possibly_damaging(0.875) | TCGA-AJ-A3EK-01 | Endometrium | uterine corpus endometrioid carcinoma | Female | <65 | I/II | Chemotherapy | carboplatin | CR |
| DIO1 | SNV | Missense_Mutation | rs766339963 | c.721N>T | p.Arg241Cys | p.R241C | P49895 | protein_coding | deleterious(0.03) | probably_damaging(0.968) | TCGA-AJ-A5DW-01 | Endometrium | uterine corpus endometrioid carcinoma | Female | <65 | I/II | Unknown | Unknown | SD |
| DIO1 | SNV | Missense_Mutation | rs766339963 | c.721N>T | p.Arg241Cys | p.R241C | P49895 | protein_coding | deleterious(0.03) | probably_damaging(0.968) | TCGA-AP-A0LM-01 | Endometrium | uterine corpus endometrioid carcinoma | Female | <65 | III/IV | Chemotherapy | cisplatin | SD |
| Page: 1 2 3 |
Top |
Related drugs of malignant transformation related genes |
| Identification of chemicals and drugs interact with genes involved in malignant transfromation |
| (DGIdb 4.0) |
| Entrez ID | Symbol | Category | Interaction Types | Drug Claim Name | Drug Name | PMIDs |
| 1733 | DIO1 | DRUGGABLE GENOME, ENZYME | inhibitor | CHEMBL1518 | PROPYLTHIOURACIL | |
| 1733 | DIO1 | DRUGGABLE GENOME, ENZYME | Propylthiouracil | PROPYLTHIOURACIL |
| Page: 1 |

Copyright 2023-Present -The University of Texas Health Science Center at Houston |