
|
|||||
|
 | |
| |
| |
| |
| |
| |
|
Gene: DIMT1 |
Gene summary for DIMT1 |
| Gene information | Species | Human | Gene symbol | DIMT1 | Gene ID | 27292 |
| Gene name | DIM1 rRNA methyltransferase and ribosome maturation factor | |
| Gene Alias | DIM1 | |
| Cytomap | 5q12.1 | |
| Gene Type | protein-coding | GO ID | GO:0000154 | UniProtAcc | A0A0C4DGB1 |
Top |
Malignant transformation analysis |
| Identification of the aberrant gene expression in precancerous and cancerous lesions by comparing the gene expression of stem-like cells in diseased tissues with normal stem cells |
| Entrez ID | Symbol | Replicates | Species | Organ | Tissue | Adj P-value | Log2FC | Malignancy |
| 27292 | DIMT1 | LZE4T | Human | Esophagus | ESCC | 3.72e-05 | 7.83e-02 | 0.0811 |
| 27292 | DIMT1 | LZE7T | Human | Esophagus | ESCC | 8.72e-06 | 1.56e-01 | 0.0667 |
| 27292 | DIMT1 | LZE8T | Human | Esophagus | ESCC | 1.55e-08 | 3.57e-01 | 0.067 |
| 27292 | DIMT1 | LZE24T | Human | Esophagus | ESCC | 2.28e-13 | 4.68e-01 | 0.0596 |
| 27292 | DIMT1 | P1T-E | Human | Esophagus | ESCC | 1.32e-04 | 3.14e-01 | 0.0875 |
| 27292 | DIMT1 | P2T-E | Human | Esophagus | ESCC | 1.69e-45 | 8.05e-01 | 0.1177 |
| 27292 | DIMT1 | P4T-E | Human | Esophagus | ESCC | 1.31e-15 | 4.85e-01 | 0.1323 |
| 27292 | DIMT1 | P5T-E | Human | Esophagus | ESCC | 7.54e-09 | 6.19e-02 | 0.1327 |
| 27292 | DIMT1 | P8T-E | Human | Esophagus | ESCC | 1.46e-15 | 2.95e-01 | 0.0889 |
| 27292 | DIMT1 | P9T-E | Human | Esophagus | ESCC | 3.01e-15 | 3.51e-01 | 0.1131 |
| 27292 | DIMT1 | P10T-E | Human | Esophagus | ESCC | 6.75e-20 | 8.60e-02 | 0.116 |
| 27292 | DIMT1 | P11T-E | Human | Esophagus | ESCC | 3.21e-11 | 4.30e-01 | 0.1426 |
| 27292 | DIMT1 | P12T-E | Human | Esophagus | ESCC | 5.68e-24 | 5.23e-01 | 0.1122 |
| 27292 | DIMT1 | P15T-E | Human | Esophagus | ESCC | 6.90e-21 | 3.76e-01 | 0.1149 |
| 27292 | DIMT1 | P16T-E | Human | Esophagus | ESCC | 2.20e-23 | 4.77e-01 | 0.1153 |
| 27292 | DIMT1 | P17T-E | Human | Esophagus | ESCC | 2.44e-02 | 1.90e-01 | 0.1278 |
| 27292 | DIMT1 | P19T-E | Human | Esophagus | ESCC | 1.04e-05 | 6.02e-01 | 0.1662 |
| 27292 | DIMT1 | P20T-E | Human | Esophagus | ESCC | 3.06e-19 | 5.12e-01 | 0.1124 |
| 27292 | DIMT1 | P21T-E | Human | Esophagus | ESCC | 1.56e-26 | 5.58e-01 | 0.1617 |
| 27292 | DIMT1 | P22T-E | Human | Esophagus | ESCC | 2.21e-20 | 3.81e-01 | 0.1236 |
| Page: 1 2 3 4 |
| Tissue | Expression Dynamics | Abbreviation |
| Esophagus | 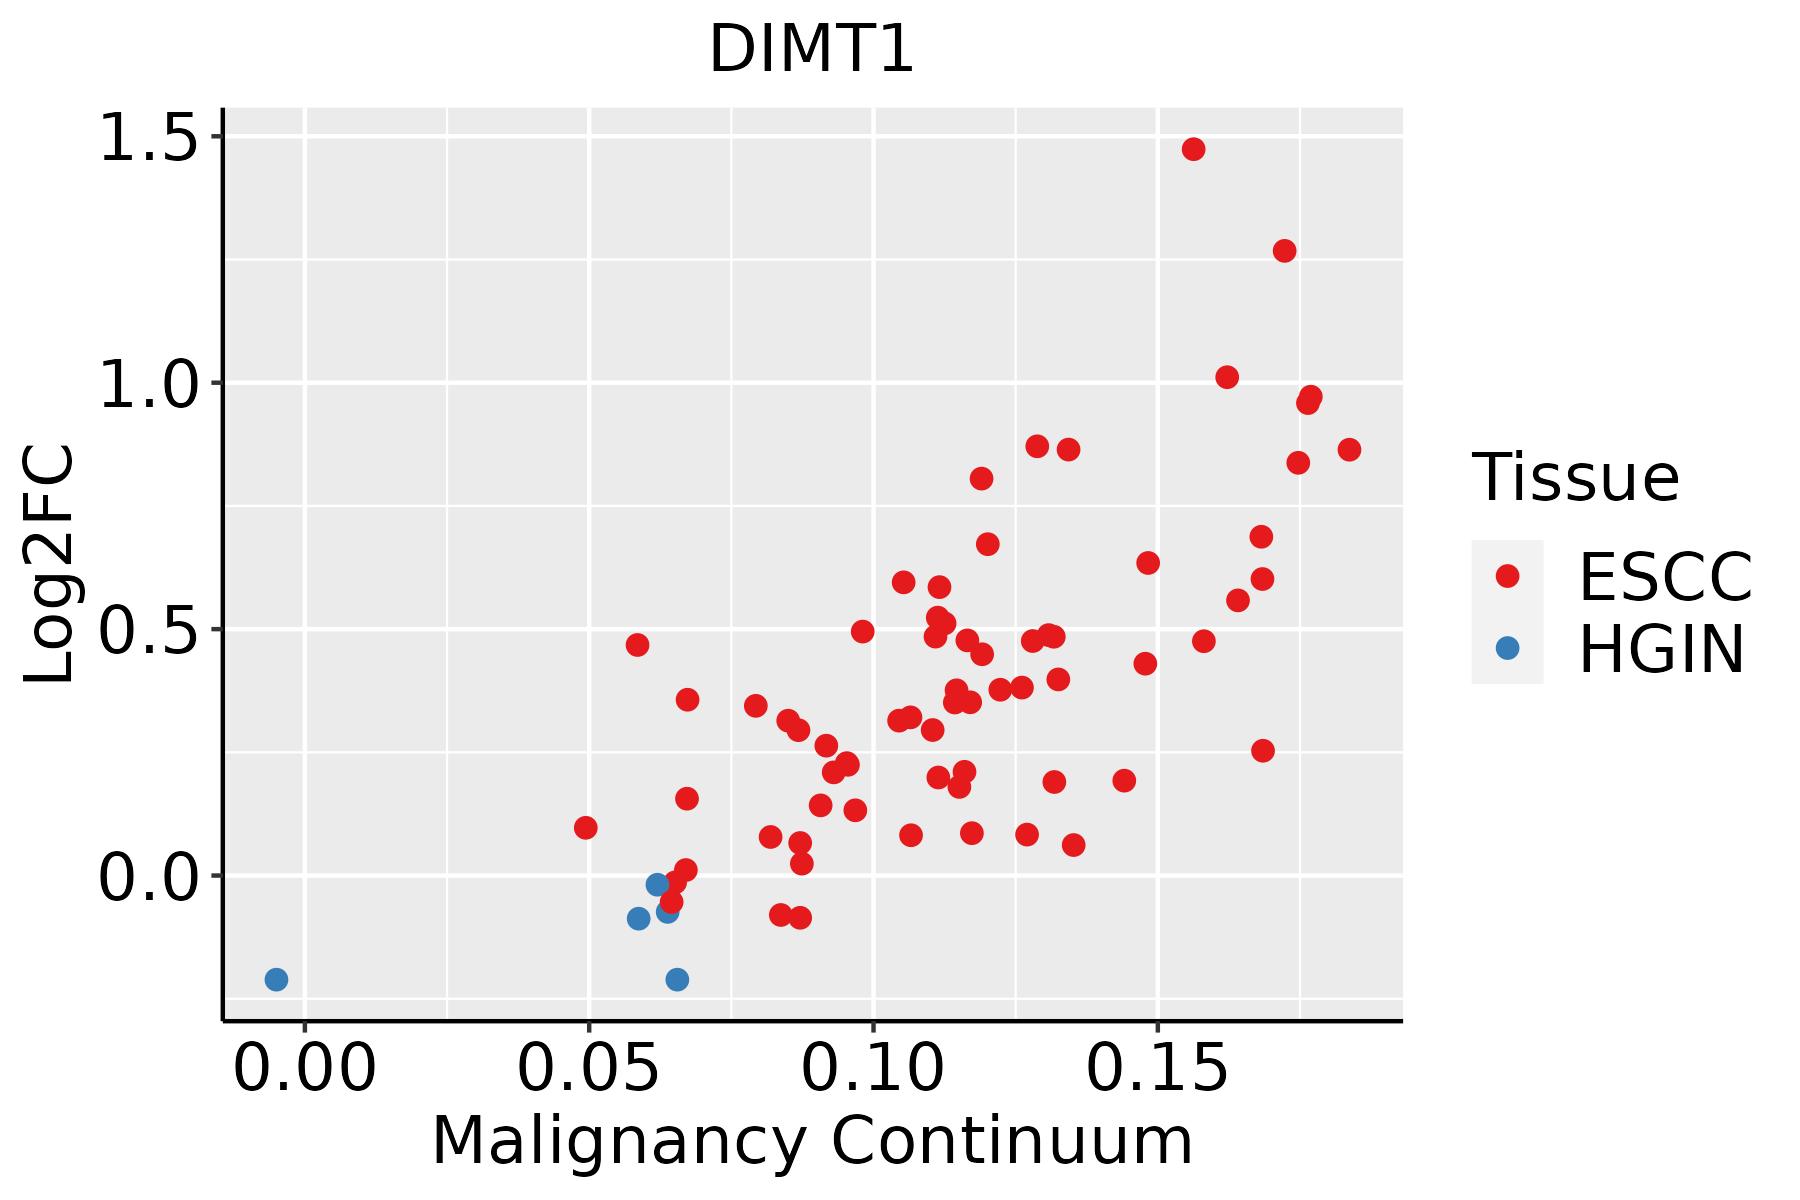 | ESCC: Esophageal squamous cell carcinoma |
| HGIN: High-grade intraepithelial neoplasias | ||
| LGIN: Low-grade intraepithelial neoplasias | ||
| Oral Cavity | 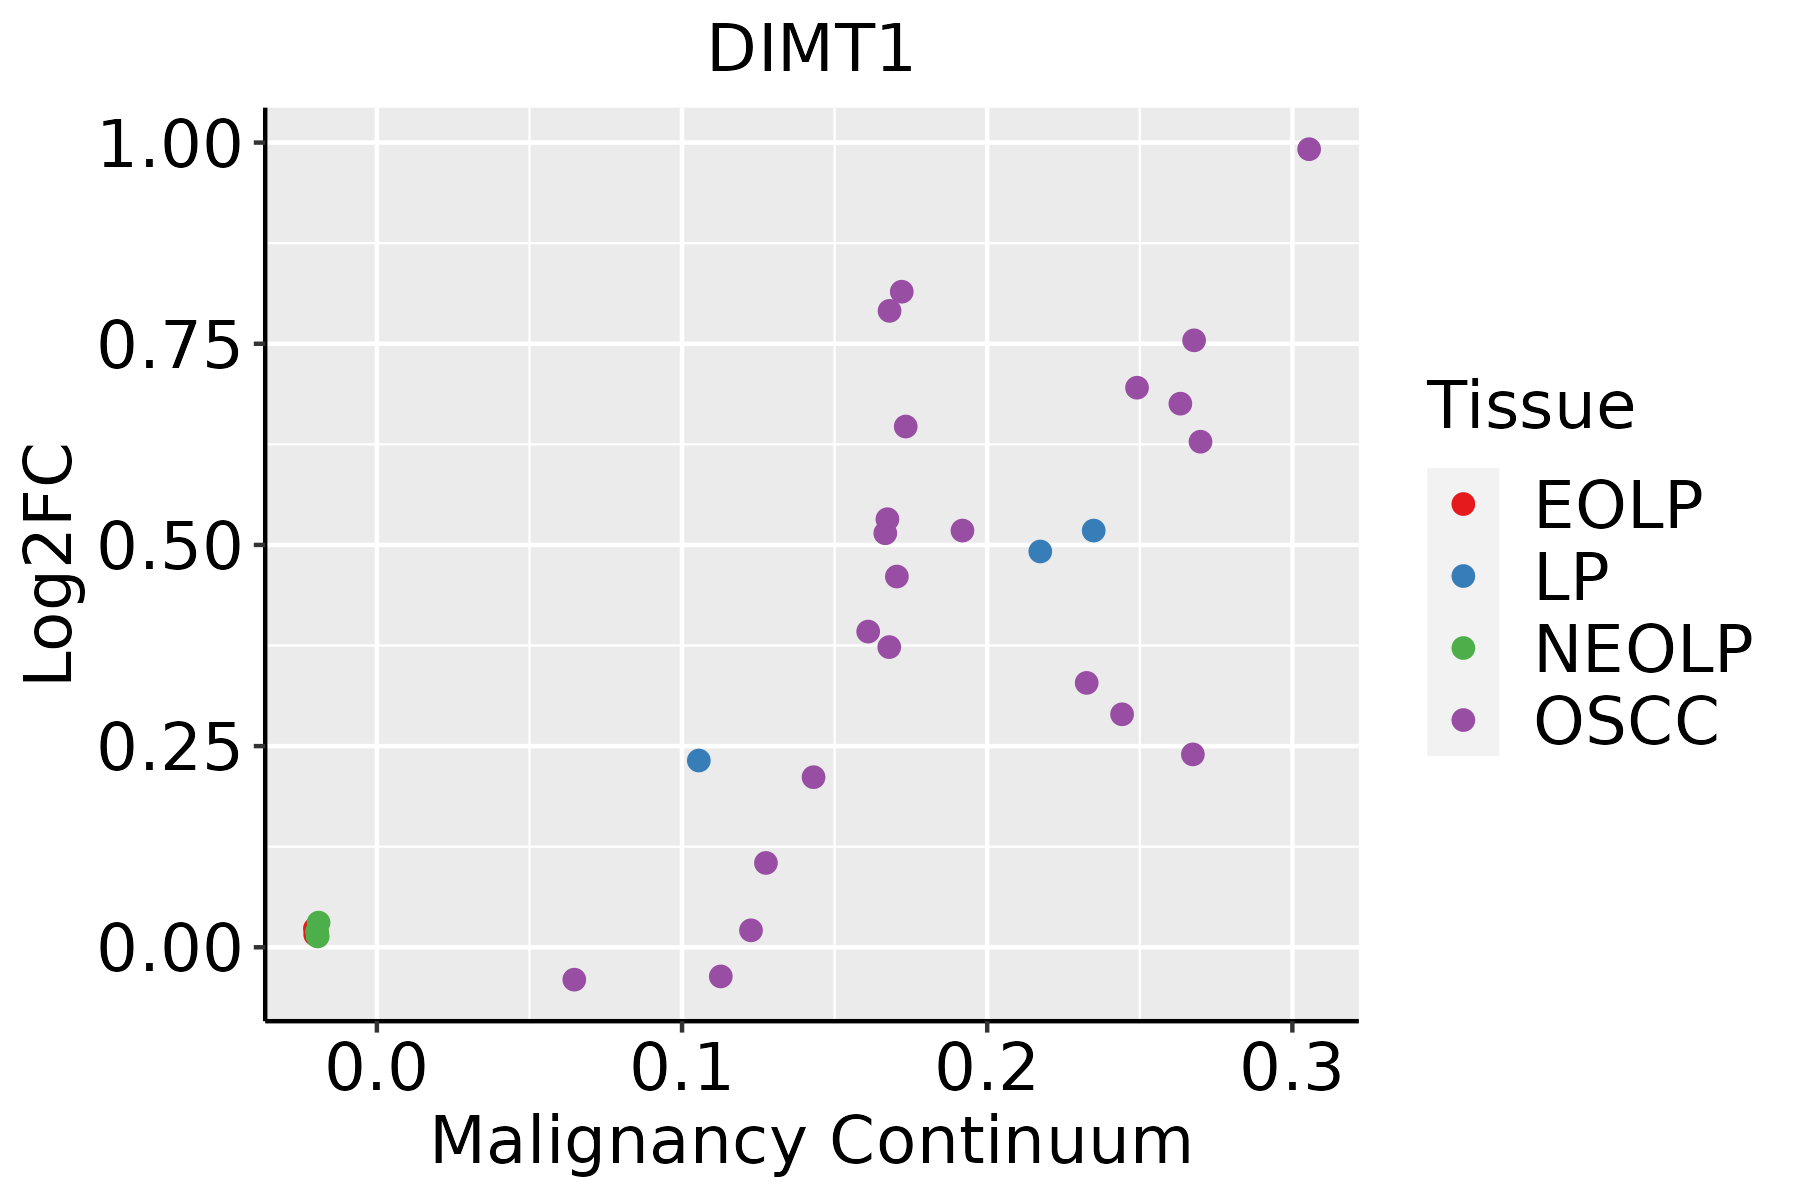 | EOLP: Erosive Oral lichen planus |
| LP: leukoplakia | ||
| NEOLP: Non-erosive oral lichen planus | ||
| OSCC: Oral squamous cell carcinoma | ||
| Skin |  | AK: Actinic keratosis |
| cSCC: Cutaneous squamous cell carcinoma | ||
| SCCIS:squamous cell carcinoma in situ |
| ∗log2FC in expression of this searched gene in stem-like cells from each diseased tissue sample relative to stem-like cells in normal samples in each tissue plotted against the malignancy continuum. Samples are colored based on if they are from different disease stage. |
Top |
Malignant transformation related pathway analysis |
| Find out the enriched GO biological processes and KEGG pathways involved in transition from healthy to precancer to cancer |
| Tissue | Disease Stage | Enriched GO biological Processes |
| Colorectum | AD |  |
| Colorectum | SER |  |
| Colorectum | MSS |  |
| Colorectum | MSI-H |  |
| Colorectum | FAP |  |
| ∗Top 15 enriched GO BP terms are showed in the bar plot of each disease state in each tissue. Each row represents a significant GO biological process which is colored according to the -log10(p.adjust). |
| Page: 1 2 3 4 5 6 7 8 9 |
| GO ID | Tissue | Disease Stage | Description | Gene Ratio | Bg Ratio | pvalue | p.adjust | Count |
| GO:0022613111 | Esophagus | ESCC | ribonucleoprotein complex biogenesis | 365/8552 | 463/18723 | 1.74e-49 | 1.11e-45 | 365 |
| GO:0042254111 | Esophagus | ESCC | ribosome biogenesis | 252/8552 | 299/18723 | 3.27e-44 | 1.04e-40 | 252 |
| GO:003447015 | Esophagus | ESCC | ncRNA processing | 300/8552 | 395/18723 | 3.09e-35 | 3.26e-32 | 300 |
| GO:0016072110 | Esophagus | ESCC | rRNA metabolic process | 197/8552 | 236/18723 | 1.31e-33 | 1.18e-30 | 197 |
| GO:0006364110 | Esophagus | ESCC | rRNA processing | 189/8552 | 225/18723 | 4.88e-33 | 3.87e-30 | 189 |
| GO:003466012 | Esophagus | ESCC | ncRNA metabolic process | 346/8552 | 485/18723 | 4.35e-31 | 2.51e-28 | 346 |
| GO:00434143 | Esophagus | ESCC | macromolecule methylation | 199/8552 | 316/18723 | 3.44e-10 | 9.57e-09 | 199 |
| GO:00322592 | Esophagus | ESCC | methylation | 222/8552 | 364/18723 | 2.26e-09 | 5.09e-08 | 222 |
| GO:00094512 | Esophagus | ESCC | RNA modification | 114/8552 | 167/18723 | 2.76e-09 | 6.04e-08 | 114 |
| GO:00015101 | Esophagus | ESCC | RNA methylation | 58/8552 | 83/18723 | 6.87e-06 | 6.94e-05 | 58 |
| GO:0000154 | Esophagus | ESCC | rRNA modification | 26/8552 | 37/18723 | 2.16e-03 | 9.62e-03 | 26 |
| GO:2000234 | Esophagus | ESCC | positive regulation of rRNA processing | 9/8552 | 10/18723 | 5.09e-03 | 1.92e-02 | 9 |
| GO:002261320 | Oral cavity | OSCC | ribonucleoprotein complex biogenesis | 333/7305 | 463/18723 | 8.28e-48 | 5.24e-44 | 333 |
| GO:004225420 | Oral cavity | OSCC | ribosome biogenesis | 230/7305 | 299/18723 | 3.22e-41 | 6.80e-38 | 230 |
| GO:000636410 | Oral cavity | OSCC | rRNA processing | 172/7305 | 225/18723 | 1.57e-30 | 1.24e-27 | 172 |
| GO:00344709 | Oral cavity | OSCC | ncRNA processing | 263/7305 | 395/18723 | 4.38e-29 | 2.78e-26 | 263 |
| GO:001607210 | Oral cavity | OSCC | rRNA metabolic process | 176/7305 | 236/18723 | 6.51e-29 | 3.24e-26 | 176 |
| GO:00346605 | Oral cavity | OSCC | ncRNA metabolic process | 296/7305 | 485/18723 | 2.94e-23 | 6.65e-21 | 296 |
| GO:00094511 | Oral cavity | OSCC | RNA modification | 95/7305 | 167/18723 | 2.05e-06 | 2.62e-05 | 95 |
| GO:00434142 | Oral cavity | OSCC | macromolecule methylation | 149/7305 | 316/18723 | 1.82e-03 | 8.60e-03 | 149 |
| Page: 1 2 |
| Pathway ID | Tissue | Disease Stage | Description | Gene Ratio | Bg Ratio | pvalue | p.adjust | qvalue | Count |
| Page: 1 |
Top |
Cell-cell communication analysis |
| Identification of potential cell-cell interactions between two cell types and their ligand-receptor pairs for different disease states |
| Ligand | Receptor | LRpair | Pathway | Tissue | Disease Stage |
| Page: 1 |
Top |
Single-cell gene regulatory network inference analysis |
| Find out the significant the regulons (TFs) and the target genes of each regulon across cell types for different disease states |
| TF | Cell Type | Tissue | Disease Stage | Target Gene | RSS | Regulon Activity |
| ∗The dot plots of a searched regulon are shown for all cell subpopulations in each disease state of each tissue based on the regulon specific score inferred using pySCENIC and by calculating the average expression. |
| Page: 1 |
Top |
Somatic mutation of malignant transformation related genes |
| Annotation of somatic variants for genes involved in malignant transformation |
| Hugo Symbol | Variant Class | Variant Classification | dbSNP RS | HGVSc | HGVSp | HGVSp Short | SWISSPROT | BIOTYPE | SIFT | PolyPhen | Tumor Sample Barcode | Tissue | Histology | Sex | Age | Stage | Therapy Types | Drugs | Outcome |
| DIMT1 | insertion | In_Frame_Ins | novel | c.428_429insCTCTACTAAAAATAA | p.Leu143_His144insSerThrLysAsnLys | p.L143_H144insSTKNK | Q9UNQ2 | protein_coding | TCGA-AN-A0FN-01 | Breast | breast invasive carcinoma | Female | <65 | I/II | Unknown | Unknown | SD | ||
| DIMT1 | SNV | Missense_Mutation | c.688A>C | p.Thr230Pro | p.T230P | Q9UNQ2 | protein_coding | deleterious(0) | possibly_damaging(0.463) | TCGA-C5-A7CM-01 | Cervix | cervical & endocervical cancer | Female | <65 | I/II | Chemotherapy | cisplatin | SD | |
| DIMT1 | SNV | Missense_Mutation | novel | c.92N>C | p.Asn31Thr | p.N31T | Q9UNQ2 | protein_coding | deleterious(0.02) | possibly_damaging(0.735) | TCGA-CA-6717-01 | Colorectum | colon adenocarcinoma | Male | <65 | I/II | Chemotherapy | oxaliplatin | CR |
| DIMT1 | SNV | Missense_Mutation | c.190G>A | p.Gly64Arg | p.G64R | Q9UNQ2 | protein_coding | deleterious(0) | probably_damaging(1) | TCGA-G4-6586-01 | Colorectum | colon adenocarcinoma | Female | >=65 | I/II | Unknown | Unknown | SD | |
| DIMT1 | SNV | Missense_Mutation | novel | c.722N>T | p.Ala241Val | p.A241V | Q9UNQ2 | protein_coding | tolerated(0.53) | benign(0.019) | TCGA-AX-A06F-01 | Endometrium | uterine corpus endometrioid carcinoma | Female | <65 | III/IV | Chemotherapy | carboplatin | SD |
| DIMT1 | SNV | Missense_Mutation | rs760325592 | c.302N>T | p.Thr101Met | p.T101M | Q9UNQ2 | protein_coding | deleterious(0.03) | probably_damaging(0.971) | TCGA-AX-A0J1-01 | Endometrium | uterine corpus endometrioid carcinoma | Female | >=65 | I/II | Unknown | Unknown | SD |
| DIMT1 | SNV | Missense_Mutation | novel | c.656A>C | p.Asn219Thr | p.N219T | Q9UNQ2 | protein_coding | deleterious(0.03) | possibly_damaging(0.791) | TCGA-AX-A2HC-01 | Endometrium | uterine corpus endometrioid carcinoma | Female | <65 | III/IV | Chemotherapy | paclitaxel | PD |
| DIMT1 | SNV | Missense_Mutation | novel | c.716N>A | p.Ser239Tyr | p.S239Y | Q9UNQ2 | protein_coding | tolerated(0.23) | possibly_damaging(0.843) | TCGA-B5-A3FC-01 | Endometrium | uterine corpus endometrioid carcinoma | Female | <65 | I/II | Unknown | Unknown | SD |
| DIMT1 | SNV | Missense_Mutation | c.518N>A | p.Cys173Tyr | p.C173Y | Q9UNQ2 | protein_coding | deleterious(0) | possibly_damaging(0.73) | TCGA-D1-A0ZO-01 | Endometrium | uterine corpus endometrioid carcinoma | Female | >=65 | I/II | Unknown | Unknown | SD | |
| DIMT1 | SNV | Missense_Mutation | novel | c.485G>A | p.Arg162Gln | p.R162Q | Q9UNQ2 | protein_coding | deleterious(0) | probably_damaging(0.961) | TCGA-DF-A2KU-01 | Endometrium | uterine corpus endometrioid carcinoma | Female | Unknown | I/II | Unknown | Unknown | SD |
| Page: 1 2 |
Top |
Related drugs of malignant transformation related genes |
| Identification of chemicals and drugs interact with genes involved in malignant transfromation |
| (DGIdb 4.0) |
| Entrez ID | Symbol | Category | Interaction Types | Drug Claim Name | Drug Name | PMIDs |
| Page: 1 |

Copyright 2023-Present -The University of Texas Health Science Center at Houston |