
|
|||||
|
 | |
| |
| |
| |
| |
| |
|
Gene: DIEXF |
Gene summary for DIEXF |
| Gene information | Species | Human | Gene symbol | DIEXF | Gene ID | 27042 |
| Gene name | UTP25 small subunit processor component | |
| Gene Alias | C1orf107 | |
| Cytomap | 1q32.2 | |
| Gene Type | protein-coding | GO ID | GO:0000462 | UniProtAcc | Q68CQ4 |
Top |
Malignant transformation analysis |
| Identification of the aberrant gene expression in precancerous and cancerous lesions by comparing the gene expression of stem-like cells in diseased tissues with normal stem cells |
| Entrez ID | Symbol | Replicates | Species | Organ | Tissue | Adj P-value | Log2FC | Malignancy |
| 27042 | DIEXF | P1T-E | Human | Esophagus | ESCC | 1.58e-06 | 1.90e-01 | 0.0875 |
| 27042 | DIEXF | P2T-E | Human | Esophagus | ESCC | 1.20e-17 | 3.29e-01 | 0.1177 |
| 27042 | DIEXF | P4T-E | Human | Esophagus | ESCC | 6.65e-10 | 1.48e-01 | 0.1323 |
| 27042 | DIEXF | P5T-E | Human | Esophagus | ESCC | 3.77e-13 | 2.66e-01 | 0.1327 |
| 27042 | DIEXF | P8T-E | Human | Esophagus | ESCC | 1.76e-05 | 1.15e-01 | 0.0889 |
| 27042 | DIEXF | P9T-E | Human | Esophagus | ESCC | 7.88e-12 | 1.21e-01 | 0.1131 |
| 27042 | DIEXF | P10T-E | Human | Esophagus | ESCC | 6.68e-16 | 2.21e-01 | 0.116 |
| 27042 | DIEXF | P11T-E | Human | Esophagus | ESCC | 3.48e-08 | 2.75e-01 | 0.1426 |
| 27042 | DIEXF | P12T-E | Human | Esophagus | ESCC | 2.21e-12 | 1.29e-01 | 0.1122 |
| 27042 | DIEXF | P15T-E | Human | Esophagus | ESCC | 6.78e-13 | 2.43e-01 | 0.1149 |
| 27042 | DIEXF | P16T-E | Human | Esophagus | ESCC | 2.89e-22 | 3.99e-01 | 0.1153 |
| 27042 | DIEXF | P17T-E | Human | Esophagus | ESCC | 3.51e-06 | 2.12e-01 | 0.1278 |
| 27042 | DIEXF | P20T-E | Human | Esophagus | ESCC | 1.93e-10 | 1.57e-01 | 0.1124 |
| 27042 | DIEXF | P21T-E | Human | Esophagus | ESCC | 1.91e-13 | 2.88e-01 | 0.1617 |
| 27042 | DIEXF | P22T-E | Human | Esophagus | ESCC | 3.60e-13 | 1.66e-01 | 0.1236 |
| 27042 | DIEXF | P23T-E | Human | Esophagus | ESCC | 8.17e-20 | 4.10e-01 | 0.108 |
| 27042 | DIEXF | P24T-E | Human | Esophagus | ESCC | 3.71e-05 | 1.36e-01 | 0.1287 |
| 27042 | DIEXF | P26T-E | Human | Esophagus | ESCC | 1.26e-12 | 3.85e-01 | 0.1276 |
| 27042 | DIEXF | P27T-E | Human | Esophagus | ESCC | 8.40e-08 | 9.83e-02 | 0.1055 |
| 27042 | DIEXF | P28T-E | Human | Esophagus | ESCC | 1.89e-16 | 2.26e-01 | 0.1149 |
| Page: 1 2 3 4 |
| Tissue | Expression Dynamics | Abbreviation |
| Esophagus | 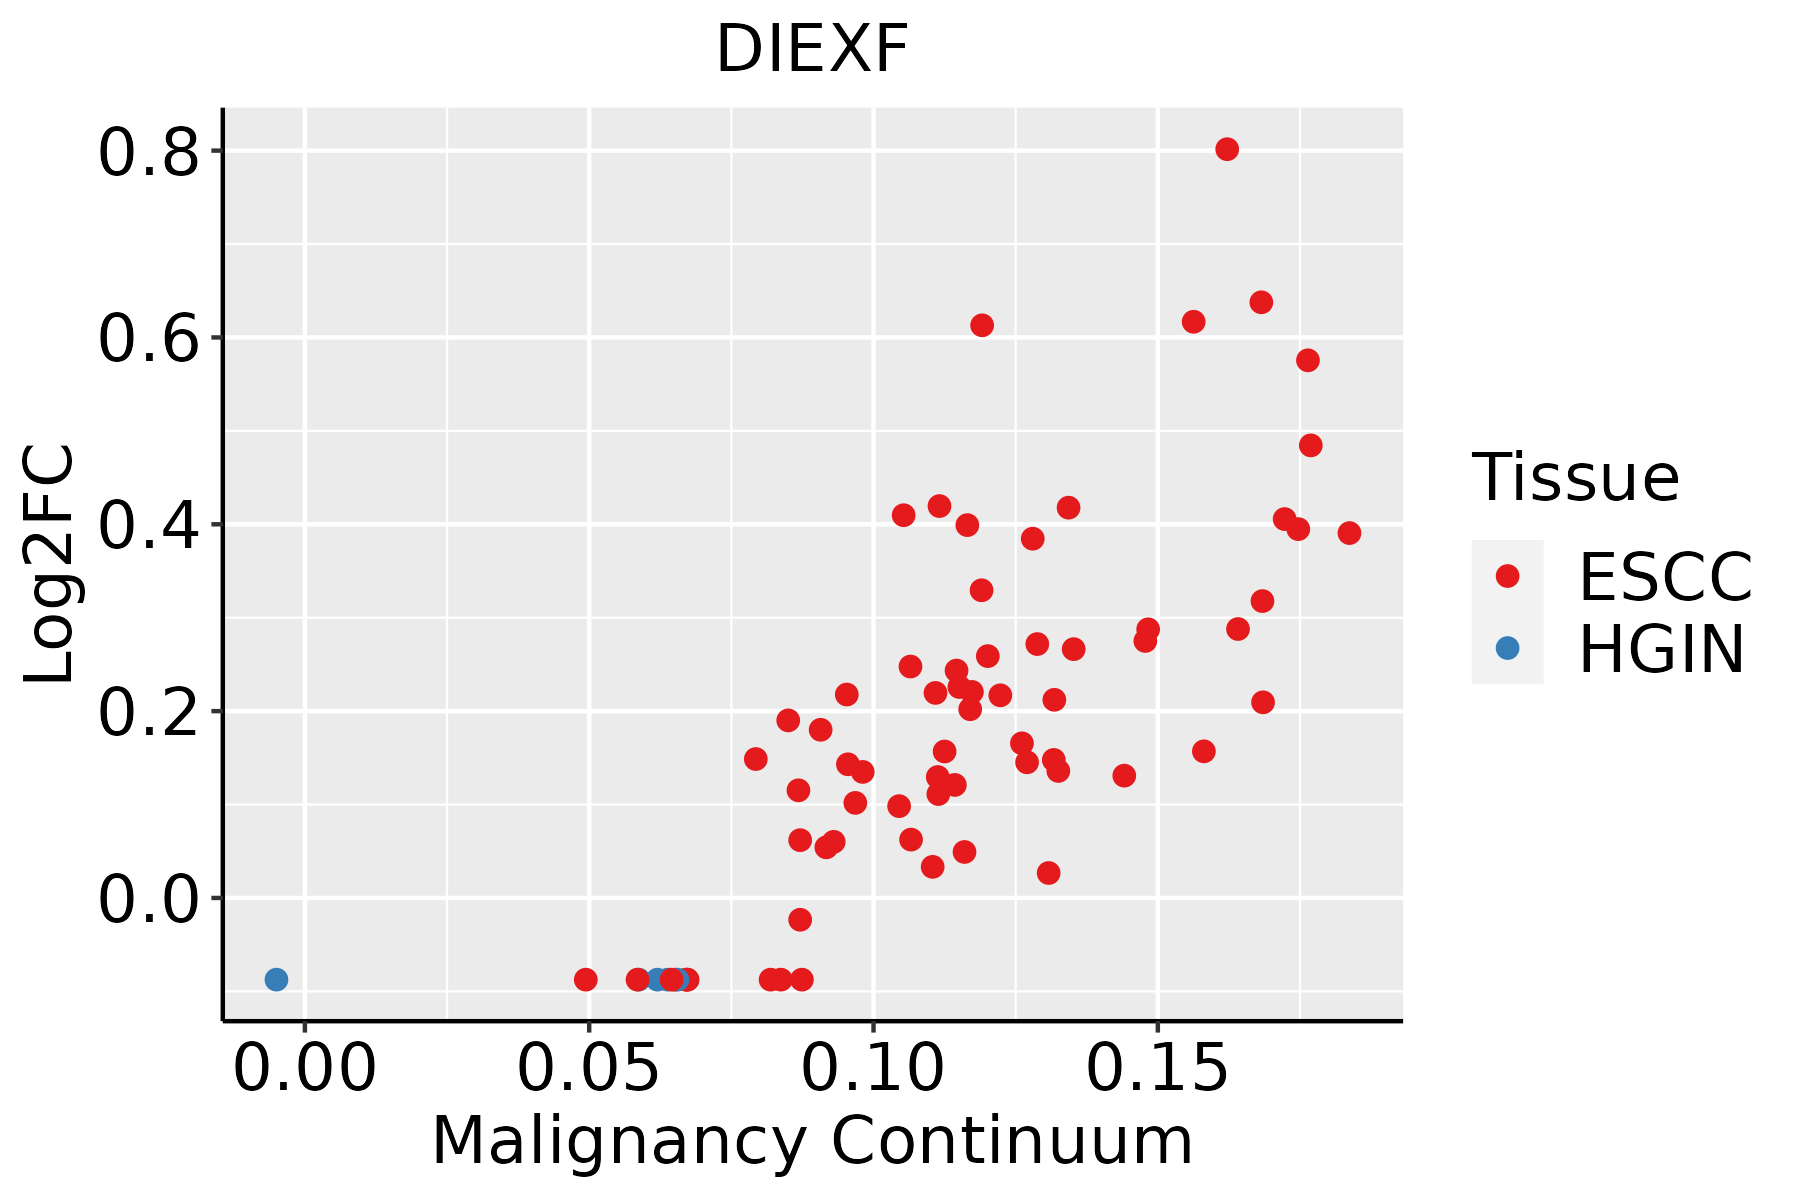 | ESCC: Esophageal squamous cell carcinoma |
| HGIN: High-grade intraepithelial neoplasias | ||
| LGIN: Low-grade intraepithelial neoplasias | ||
| Liver | 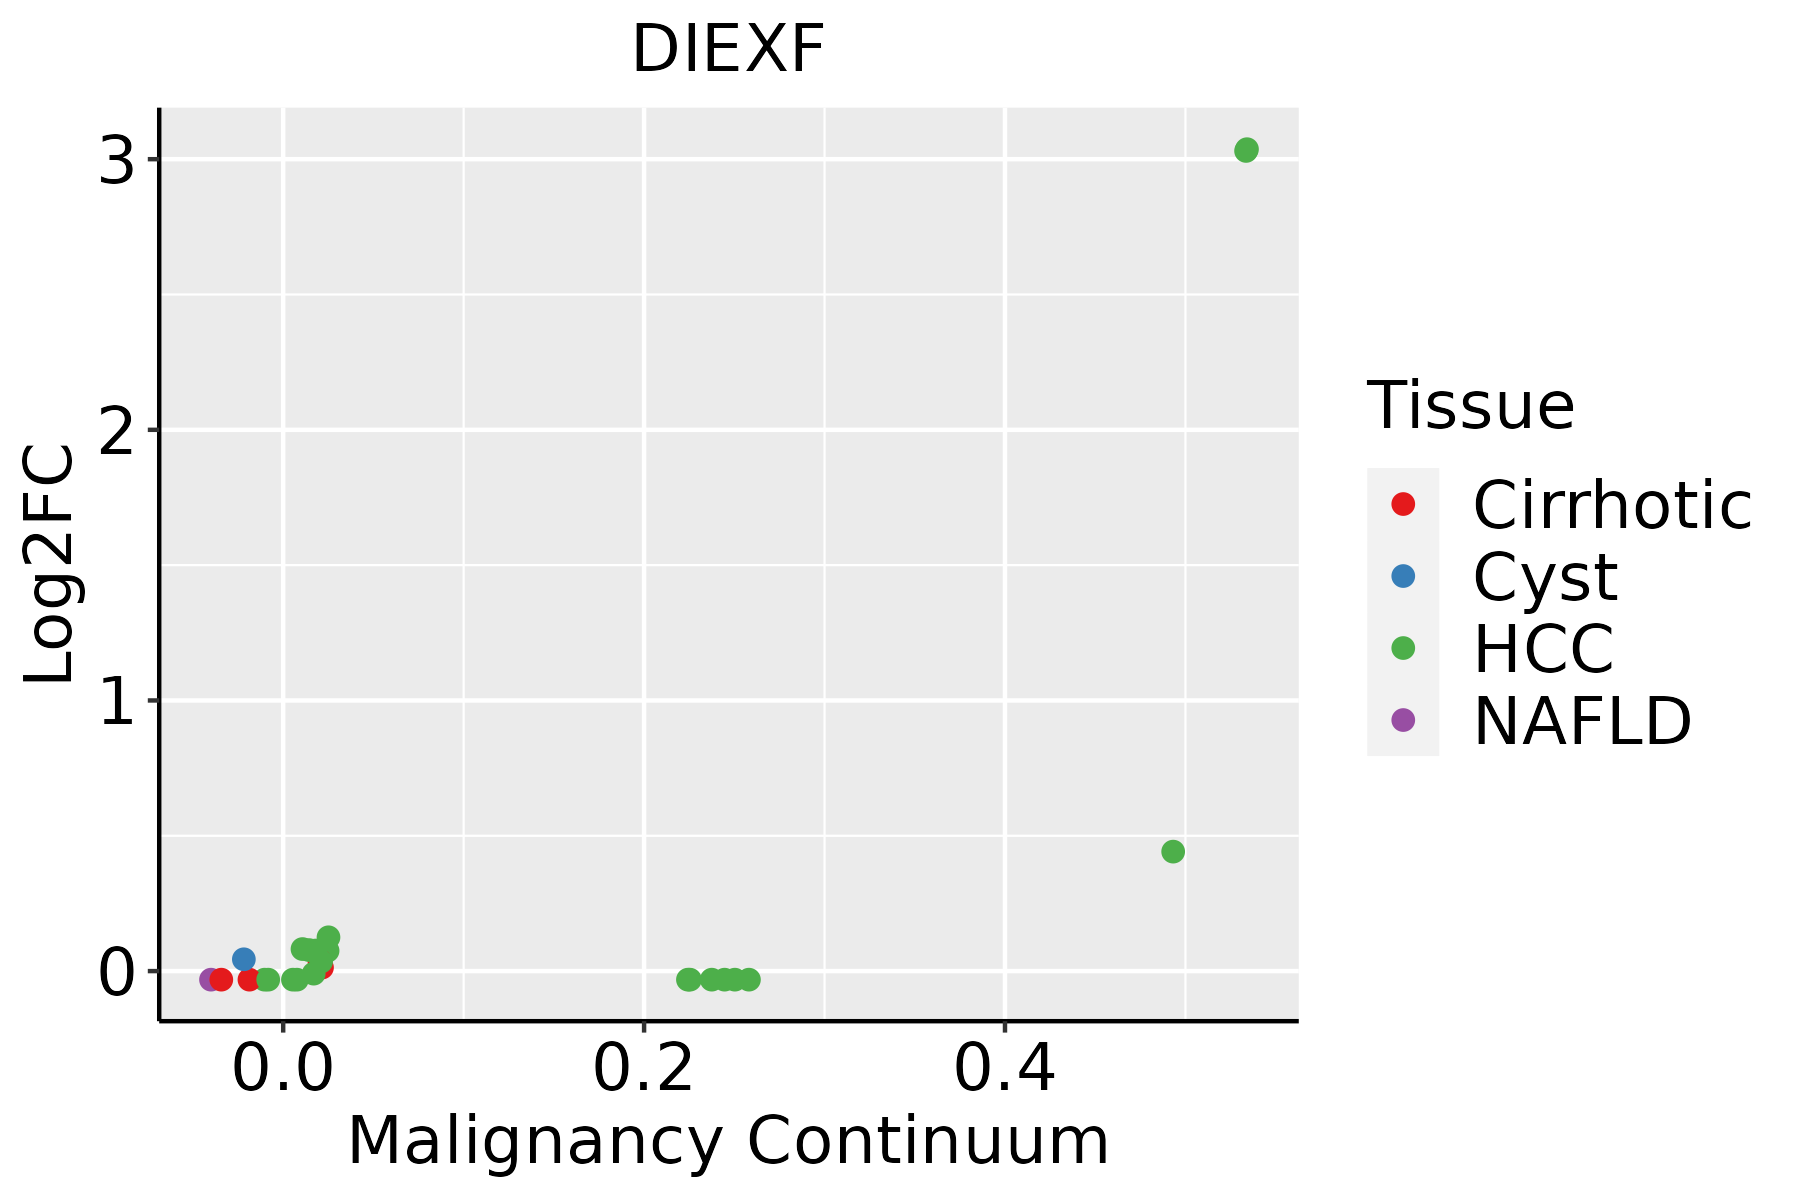 | HCC: Hepatocellular carcinoma |
| NAFLD: Non-alcoholic fatty liver disease | ||
| Oral Cavity | 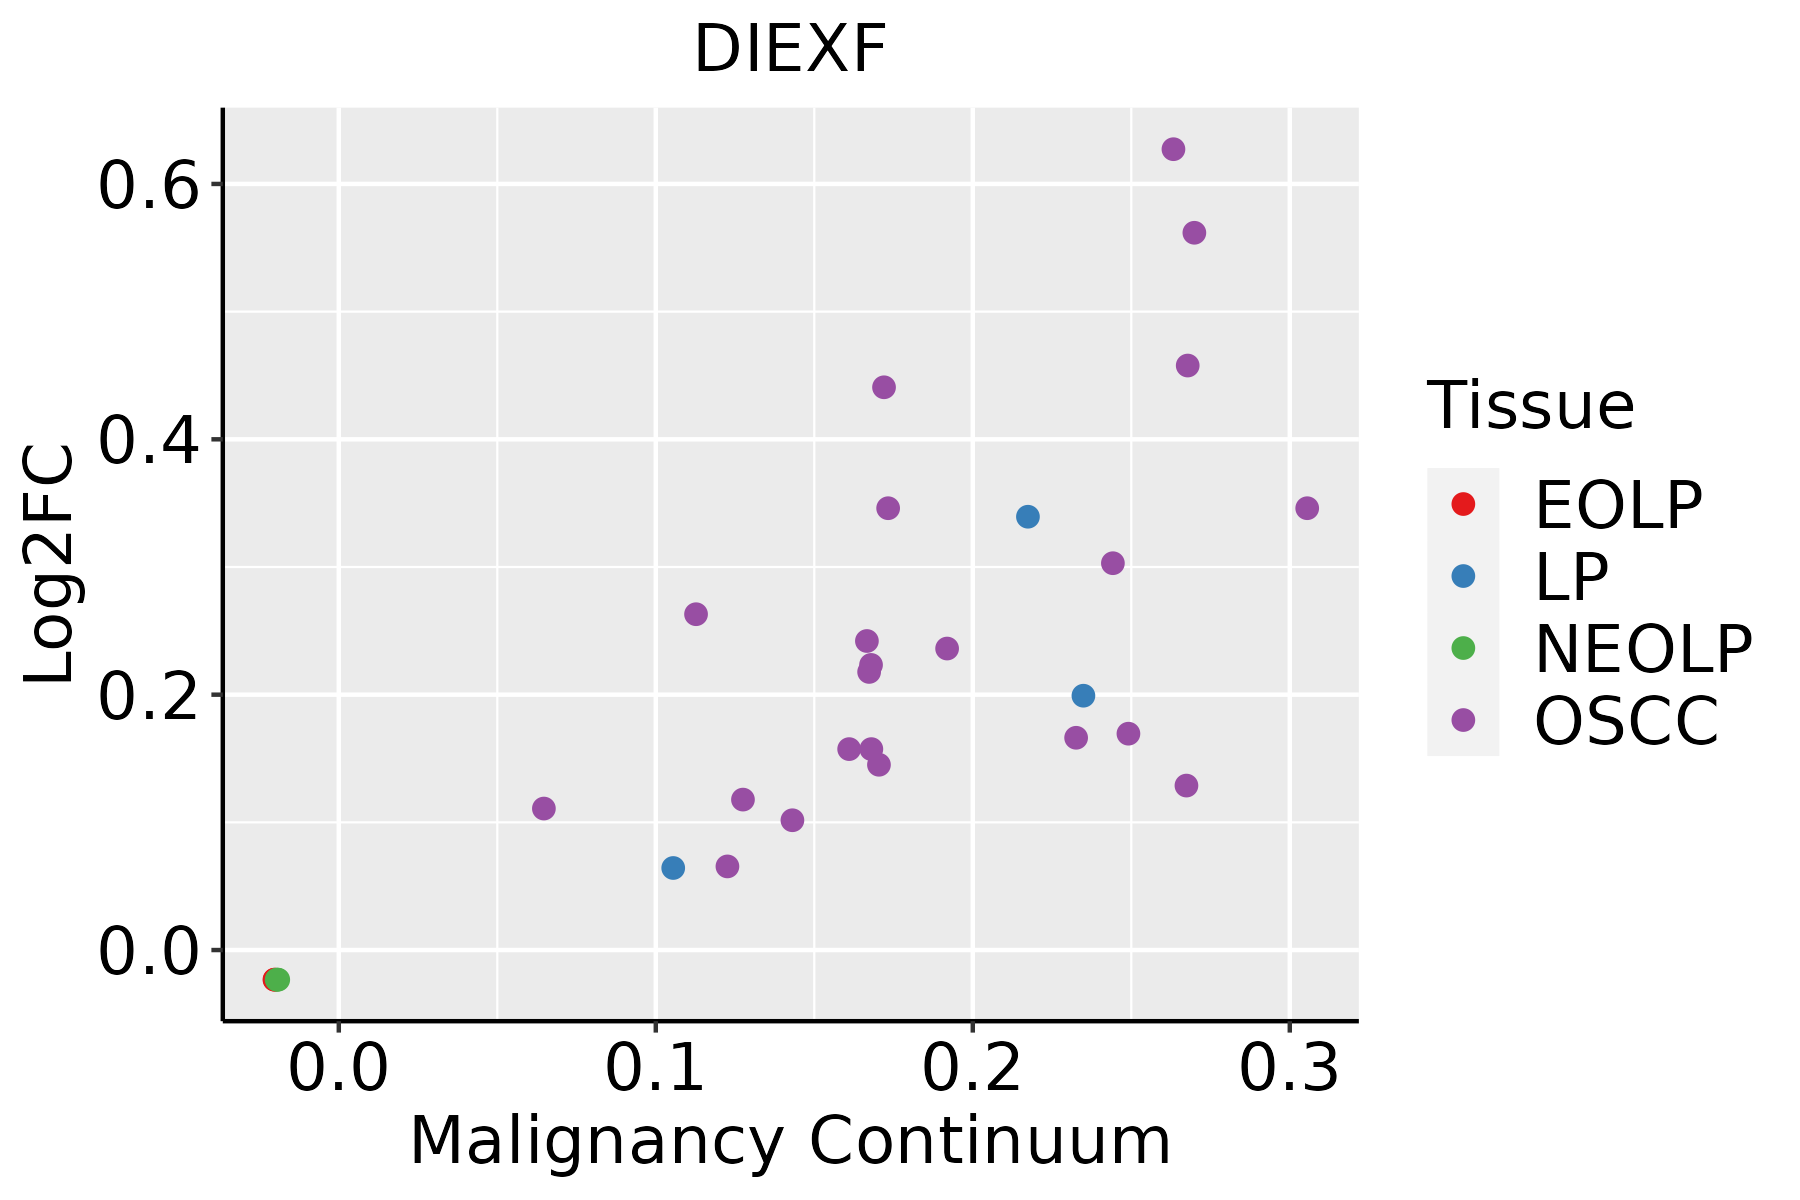 | EOLP: Erosive Oral lichen planus |
| LP: leukoplakia | ||
| NEOLP: Non-erosive oral lichen planus | ||
| OSCC: Oral squamous cell carcinoma |
| ∗log2FC in expression of this searched gene in stem-like cells from each diseased tissue sample relative to stem-like cells in normal samples in each tissue plotted against the malignancy continuum. Samples are colored based on if they are from different disease stage. |
Top |
Malignant transformation related pathway analysis |
| Find out the enriched GO biological processes and KEGG pathways involved in transition from healthy to precancer to cancer |
| Tissue | Disease Stage | Enriched GO biological Processes |
| Colorectum | AD |  |
| Colorectum | SER |  |
| Colorectum | MSS |  |
| Colorectum | MSI-H |  |
| Colorectum | FAP |  |
| ∗Top 15 enriched GO BP terms are showed in the bar plot of each disease state in each tissue. Each row represents a significant GO biological process which is colored according to the -log10(p.adjust). |
| Page: 1 2 3 4 5 6 7 8 9 |
| GO ID | Tissue | Disease Stage | Description | Gene Ratio | Bg Ratio | pvalue | p.adjust | Count |
| Page: 1 |
| Pathway ID | Tissue | Disease Stage | Description | Gene Ratio | Bg Ratio | pvalue | p.adjust | qvalue | Count |
| Page: 1 |
Top |
Cell-cell communication analysis |
| Identification of potential cell-cell interactions between two cell types and their ligand-receptor pairs for different disease states |
| Ligand | Receptor | LRpair | Pathway | Tissue | Disease Stage |
| Page: 1 |
Top |
Single-cell gene regulatory network inference analysis |
| Find out the significant the regulons (TFs) and the target genes of each regulon across cell types for different disease states |
| TF | Cell Type | Tissue | Disease Stage | Target Gene | RSS | Regulon Activity |
| ∗The dot plots of a searched regulon are shown for all cell subpopulations in each disease state of each tissue based on the regulon specific score inferred using pySCENIC and by calculating the average expression. |
| Page: 1 |
Top |
Somatic mutation of malignant transformation related genes |
| Annotation of somatic variants for genes involved in malignant transformation |
| Hugo Symbol | Variant Class | Variant Classification | dbSNP RS | HGVSc | HGVSp | HGVSp Short | SWISSPROT | BIOTYPE | SIFT | PolyPhen | Tumor Sample Barcode | Tissue | Histology | Sex | Age | Stage | Therapy Types | Drugs | Outcome |
| DIEXF | SNV | Missense_Mutation | novel | c.1299N>C | p.Gln433His | p.Q433H | Q68CQ4 | protein_coding | deleterious(0.01) | possibly_damaging(0.902) | TCGA-5L-AAT1-01 | Breast | breast invasive carcinoma | Female | <65 | III/IV | Hormone Therapy | letrozol | SD |
| DIEXF | SNV | Missense_Mutation | novel | c.1136A>G | p.Asp379Gly | p.D379G | Q68CQ4 | protein_coding | tolerated(0.3) | benign(0.003) | TCGA-A7-A0CJ-01 | Breast | breast invasive carcinoma | Female | <65 | I/II | Chemotherapy | cytoxan | SD |
| DIEXF | SNV | Missense_Mutation | c.1085G>T | p.Arg362Leu | p.R362L | Q68CQ4 | protein_coding | deleterious(0) | probably_damaging(1) | TCGA-A7-A0DB-01 | Breast | breast invasive carcinoma | Female | <65 | I/II | Hormone Therapy | arimidex | SD | |
| DIEXF | SNV | Missense_Mutation | c.1268A>T | p.Asp423Val | p.D423V | Q68CQ4 | protein_coding | deleterious(0) | probably_damaging(1) | TCGA-BH-A18G-01 | Breast | breast invasive carcinoma | Female | >=65 | I/II | Unknown | Unknown | SD | |
| DIEXF | SNV | Missense_Mutation | novel | c.2042N>A | p.Gly681Asp | p.G681D | Q68CQ4 | protein_coding | deleterious(0) | probably_damaging(1) | TCGA-C8-A8HP-01 | Breast | breast invasive carcinoma | Female | <65 | III/IV | Chemotherapy | 5-fluorouracil | CR |
| DIEXF | SNV | Missense_Mutation | novel | c.879C>G | p.Phe293Leu | p.F293L | Q68CQ4 | protein_coding | tolerated(0.12) | benign(0.003) | TCGA-D8-A27V-01 | Breast | breast invasive carcinoma | Female | <65 | I/II | Hormone Therapy | tamoxiphen | SD |
| DIEXF | SNV | Missense_Mutation | novel | c.837N>C | p.Gln279His | p.Q279H | Q68CQ4 | protein_coding | deleterious(0) | probably_damaging(0.999) | TCGA-D8-A73U-01 | Breast | breast invasive carcinoma | Female | >=65 | I/II | Hormone Therapy | tamoxiphen | SD |
| DIEXF | SNV | Missense_Mutation | rs759517520 | c.532N>A | p.Gly178Arg | p.G178R | Q68CQ4 | protein_coding | tolerated(0.18) | benign(0.001) | TCGA-E2-A14S-01 | Breast | breast invasive carcinoma | Female | >=65 | I/II | Chemotherapy | cytoxan | SD |
| DIEXF | SNV | Missense_Mutation | novel | c.2201G>T | p.Gly734Val | p.G734V | Q68CQ4 | protein_coding | deleterious(0) | probably_damaging(1) | TCGA-E2-A56Z-01 | Breast | breast invasive carcinoma | Female | >=65 | I/II | Hormone Therapy | arimidex | SD |
| DIEXF | insertion | Nonsense_Mutation | novel | c.1138_1139insTTGGCTTATTGTAAAAGGTATTTCCAAATTCT | p.Ser380IlefsTer5 | p.S380Ifs*5 | Q68CQ4 | protein_coding | TCGA-A7-A0CJ-01 | Breast | breast invasive carcinoma | Female | <65 | I/II | Chemotherapy | cytoxan | SD |
| Page: 1 2 3 4 5 6 7 8 9 10 |
Top |
Related drugs of malignant transformation related genes |
| Identification of chemicals and drugs interact with genes involved in malignant transfromation |
| (DGIdb 4.0) |
| Entrez ID | Symbol | Category | Interaction Types | Drug Claim Name | Drug Name | PMIDs |
| Page: 1 |

Copyright 2023-Present -The University of Texas Health Science Center at Houston |