
|
|||||
|
 | |
| |
| |
| |
| |
| |
|
Gene: DIDO1 |
Gene summary for DIDO1 |
| Gene information | Species | Human | Gene symbol | DIDO1 | Gene ID | 11083 |
| Gene name | death inducer-obliterator 1 | |
| Gene Alias | BYE1 | |
| Cytomap | 20q13.33 | |
| Gene Type | protein-coding | GO ID | GO:0006139 | UniProtAcc | Q9BTC0 |
Top |
Malignant transformation analysis |
| Identification of the aberrant gene expression in precancerous and cancerous lesions by comparing the gene expression of stem-like cells in diseased tissues with normal stem cells |
| Entrez ID | Symbol | Replicates | Species | Organ | Tissue | Adj P-value | Log2FC | Malignancy |
| 11083 | DIDO1 | CCI_1 | Human | Cervix | CC | 4.34e-06 | 6.81e-01 | 0.528 |
| 11083 | DIDO1 | CCI_2 | Human | Cervix | CC | 2.99e-04 | 6.30e-01 | 0.5249 |
| 11083 | DIDO1 | CCI_3 | Human | Cervix | CC | 6.47e-08 | 6.82e-01 | 0.516 |
| 11083 | DIDO1 | LZE4T | Human | Esophagus | ESCC | 4.84e-08 | 2.57e-01 | 0.0811 |
| 11083 | DIDO1 | LZE7T | Human | Esophagus | ESCC | 3.12e-03 | 3.50e-01 | 0.0667 |
| 11083 | DIDO1 | LZE20T | Human | Esophagus | ESCC | 9.15e-05 | 2.55e-01 | 0.0662 |
| 11083 | DIDO1 | LZE22T | Human | Esophagus | ESCC | 6.80e-03 | 1.55e-01 | 0.068 |
| 11083 | DIDO1 | LZE24T | Human | Esophagus | ESCC | 1.06e-06 | 2.58e-01 | 0.0596 |
| 11083 | DIDO1 | P1T-E | Human | Esophagus | ESCC | 1.67e-08 | 4.59e-01 | 0.0875 |
| 11083 | DIDO1 | P2T-E | Human | Esophagus | ESCC | 1.96e-20 | 3.47e-01 | 0.1177 |
| 11083 | DIDO1 | P4T-E | Human | Esophagus | ESCC | 1.01e-06 | 9.99e-02 | 0.1323 |
| 11083 | DIDO1 | P5T-E | Human | Esophagus | ESCC | 9.11e-06 | 1.35e-01 | 0.1327 |
| 11083 | DIDO1 | P8T-E | Human | Esophagus | ESCC | 6.12e-08 | 1.15e-01 | 0.0889 |
| 11083 | DIDO1 | P9T-E | Human | Esophagus | ESCC | 6.47e-05 | 1.25e-01 | 0.1131 |
| 11083 | DIDO1 | P10T-E | Human | Esophagus | ESCC | 7.79e-26 | 5.13e-01 | 0.116 |
| 11083 | DIDO1 | P11T-E | Human | Esophagus | ESCC | 1.35e-14 | 5.34e-01 | 0.1426 |
| 11083 | DIDO1 | P12T-E | Human | Esophagus | ESCC | 5.90e-14 | 3.90e-01 | 0.1122 |
| 11083 | DIDO1 | P15T-E | Human | Esophagus | ESCC | 6.46e-15 | 3.57e-01 | 0.1149 |
| 11083 | DIDO1 | P16T-E | Human | Esophagus | ESCC | 1.76e-28 | 6.87e-01 | 0.1153 |
| 11083 | DIDO1 | P17T-E | Human | Esophagus | ESCC | 3.40e-10 | 3.32e-01 | 0.1278 |
| Page: 1 2 3 4 5 6 |
| Tissue | Expression Dynamics | Abbreviation |
| Cervix |  | CC: Cervix cancer |
| HSIL_HPV: HPV-infected high-grade squamous intraepithelial lesions | ||
| N_HPV: HPV-infected normal cervix | ||
| Esophagus | 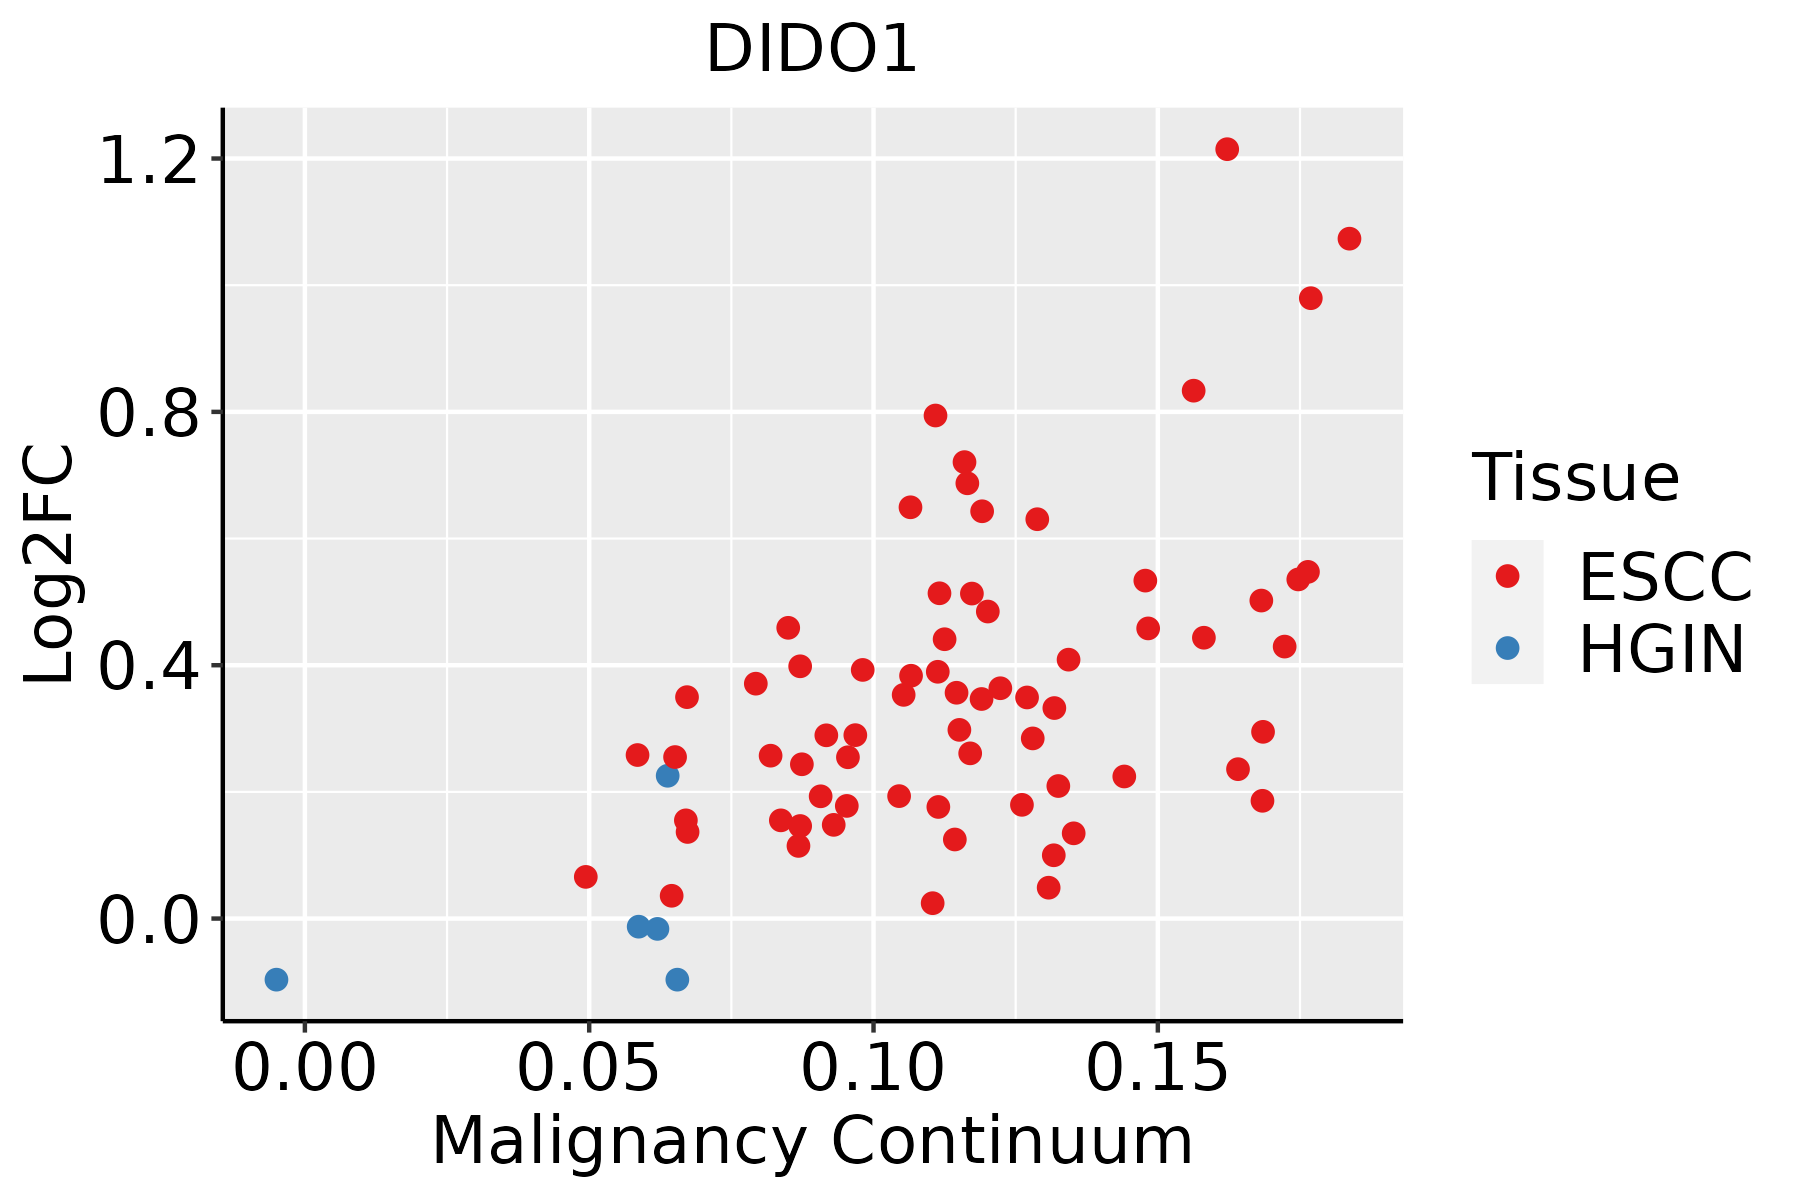 | ESCC: Esophageal squamous cell carcinoma |
| HGIN: High-grade intraepithelial neoplasias | ||
| LGIN: Low-grade intraepithelial neoplasias | ||
| Liver | 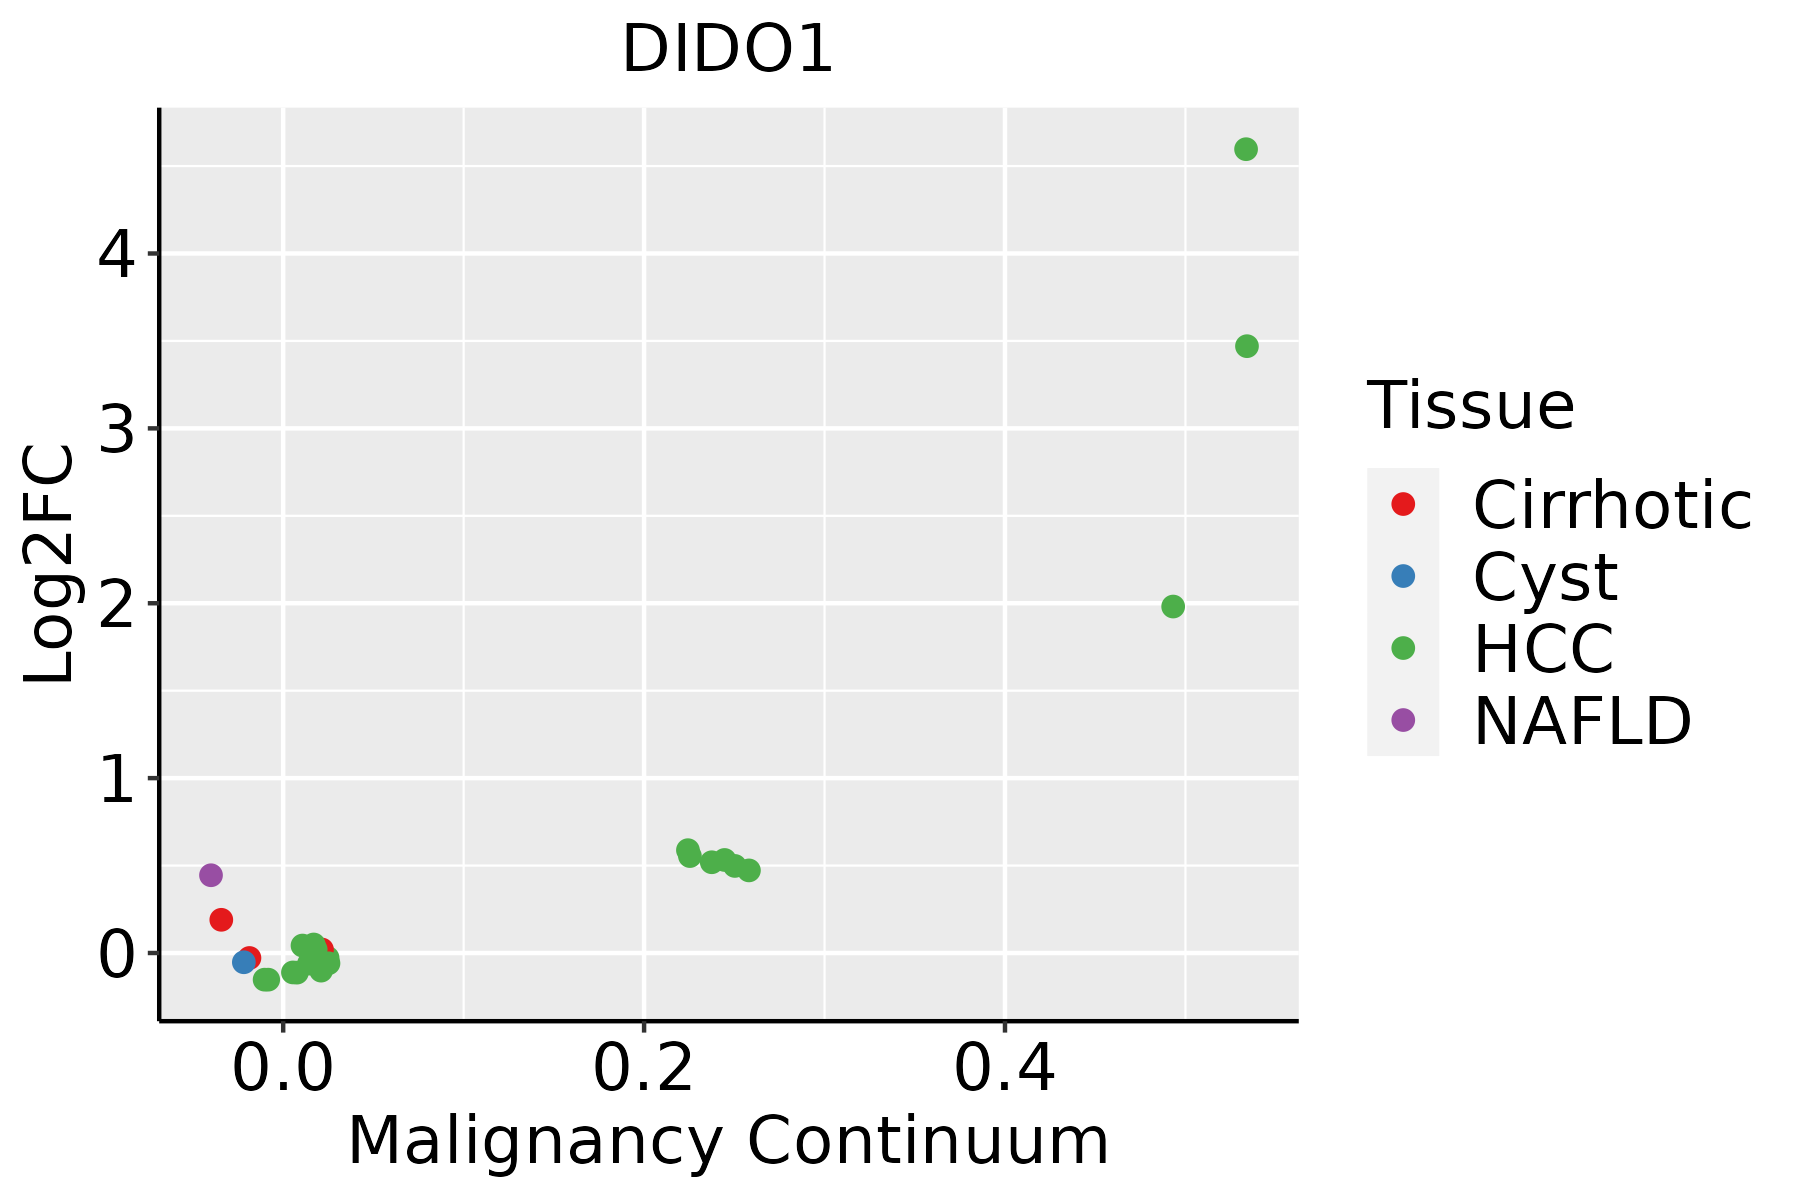 | HCC: Hepatocellular carcinoma |
| NAFLD: Non-alcoholic fatty liver disease | ||
| Oral Cavity |  | EOLP: Erosive Oral lichen planus |
| LP: leukoplakia | ||
| NEOLP: Non-erosive oral lichen planus | ||
| OSCC: Oral squamous cell carcinoma | ||
| Prostate | 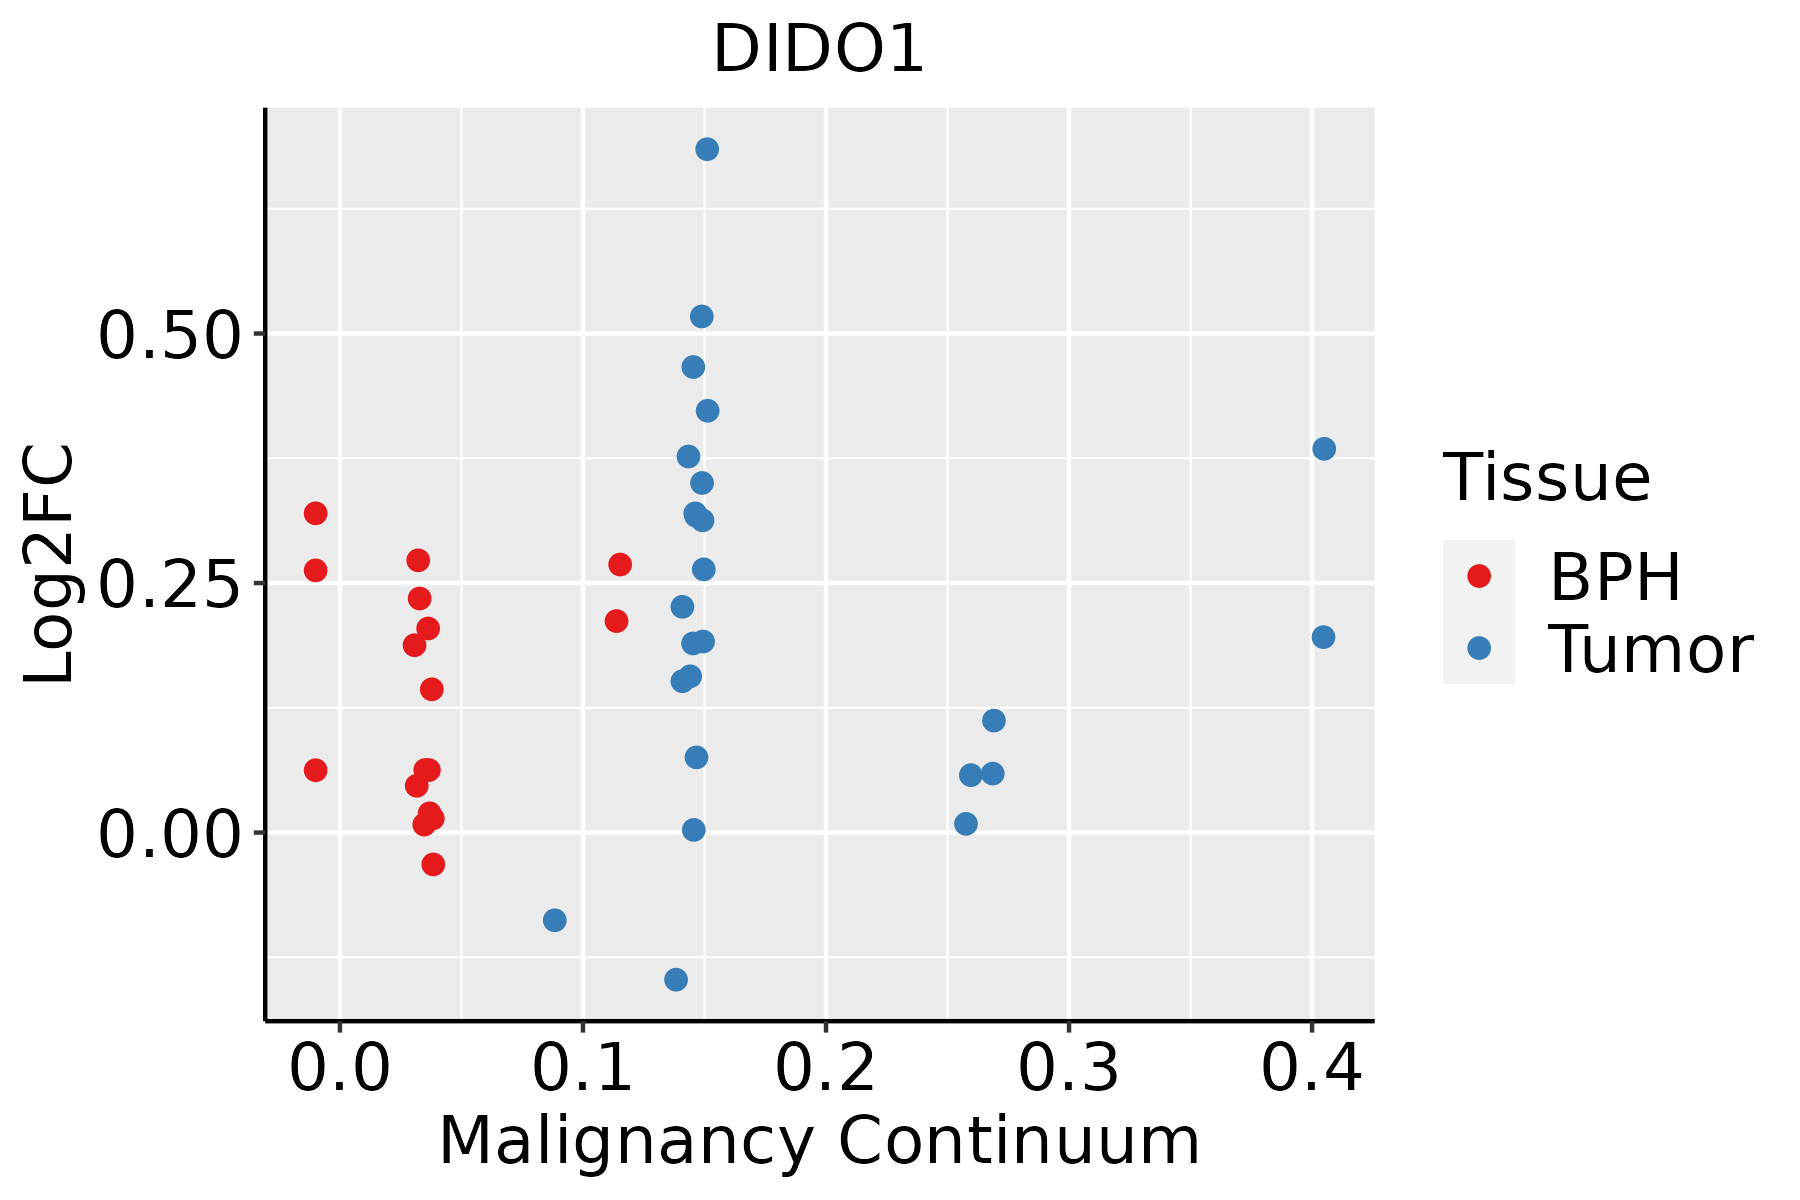 | BPH: Benign Prostatic Hyperplasia |
| Thyroid | 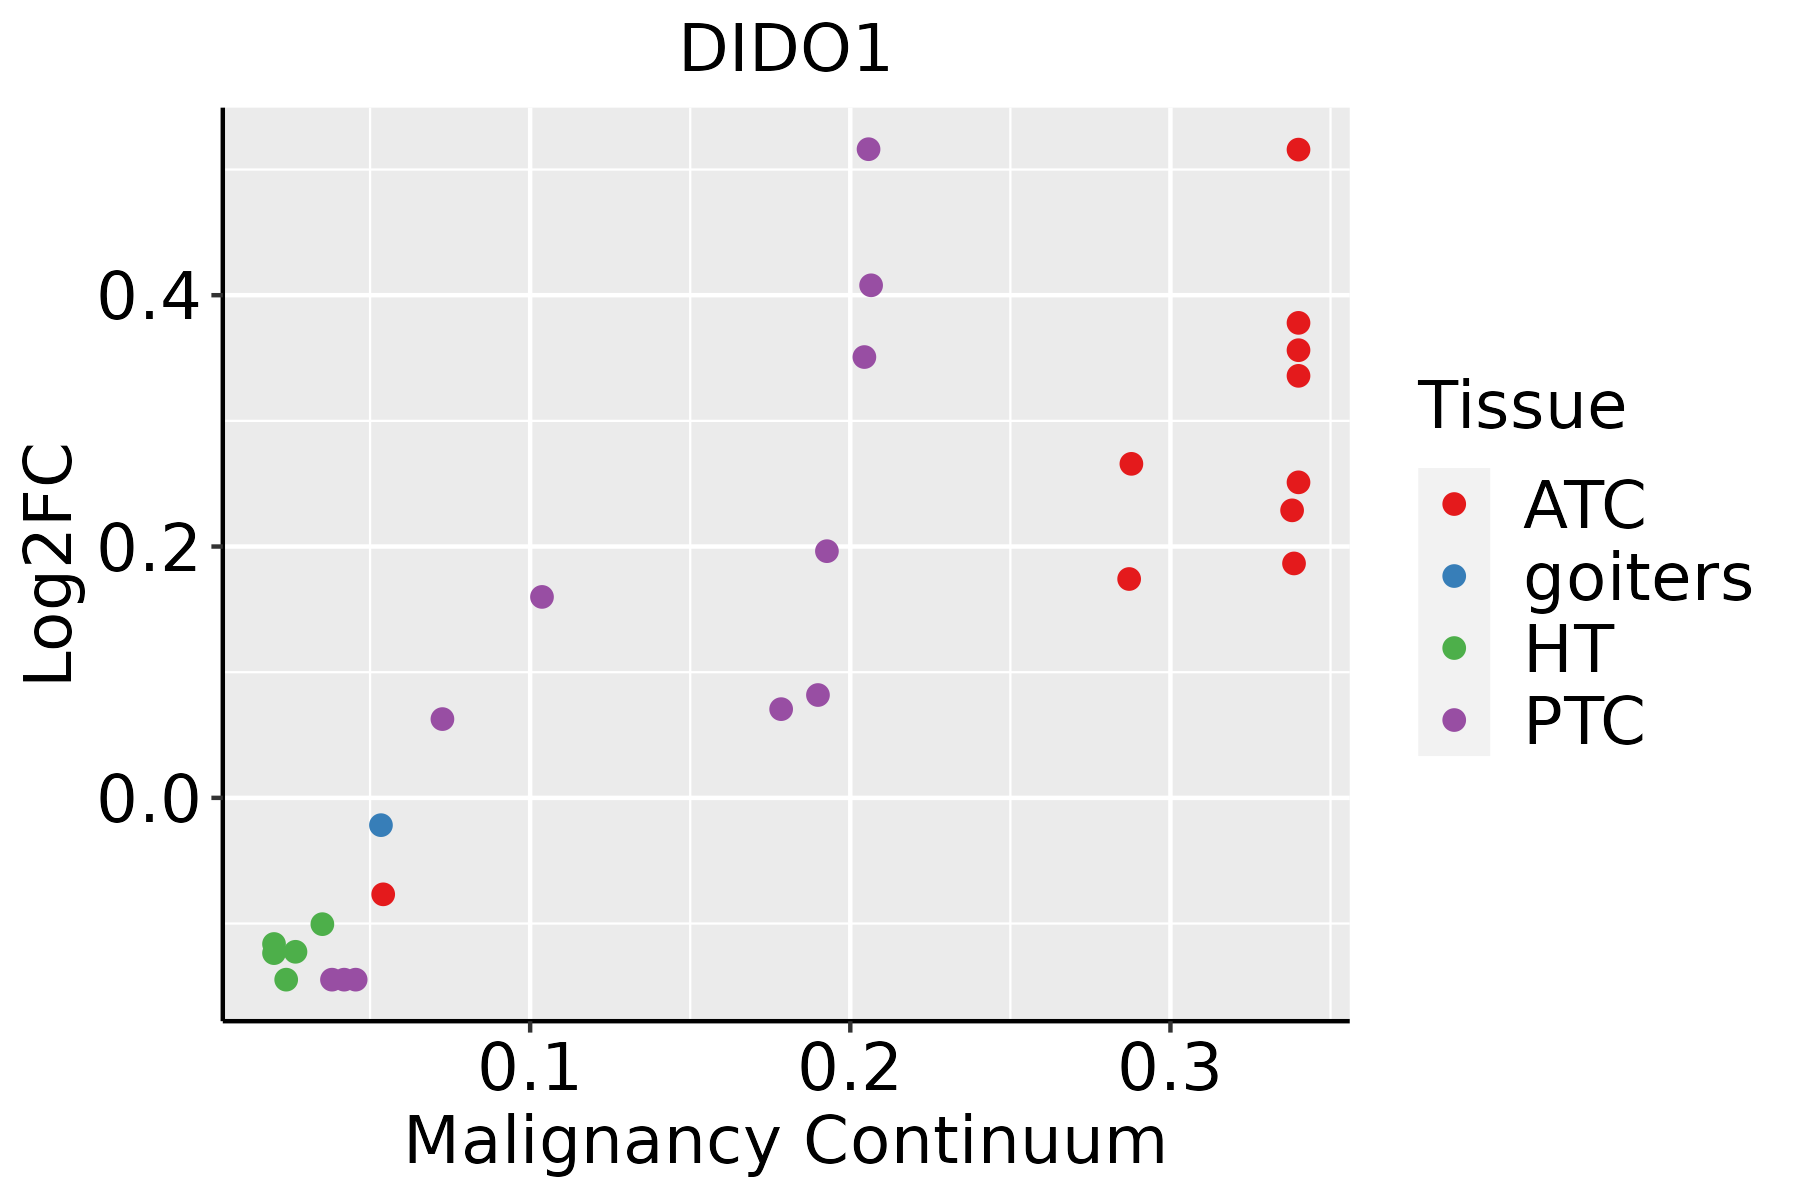 | ATC: Anaplastic thyroid cancer |
| HT: Hashimoto's thyroiditis | ||
| PTC: Papillary thyroid cancer |
| ∗log2FC in expression of this searched gene in stem-like cells from each diseased tissue sample relative to stem-like cells in normal samples in each tissue plotted against the malignancy continuum. Samples are colored based on if they are from different disease stage. |
Top |
Malignant transformation related pathway analysis |
| Find out the enriched GO biological processes and KEGG pathways involved in transition from healthy to precancer to cancer |
| Tissue | Disease Stage | Enriched GO biological Processes |
| Colorectum | AD |  |
| Colorectum | SER |  |
| Colorectum | MSS |  |
| Colorectum | MSI-H |  |
| Colorectum | FAP |  |
| ∗Top 15 enriched GO BP terms are showed in the bar plot of each disease state in each tissue. Each row represents a significant GO biological process which is colored according to the -log10(p.adjust). |
| Page: 1 2 3 4 5 6 7 8 9 |
| GO ID | Tissue | Disease Stage | Description | Gene Ratio | Bg Ratio | pvalue | p.adjust | Count |
| Page: 1 |
| Pathway ID | Tissue | Disease Stage | Description | Gene Ratio | Bg Ratio | pvalue | p.adjust | qvalue | Count |
| Page: 1 |
Top |
Cell-cell communication analysis |
| Identification of potential cell-cell interactions between two cell types and their ligand-receptor pairs for different disease states |
| Ligand | Receptor | LRpair | Pathway | Tissue | Disease Stage |
| Page: 1 |
Top |
Single-cell gene regulatory network inference analysis |
| Find out the significant the regulons (TFs) and the target genes of each regulon across cell types for different disease states |
| TF | Cell Type | Tissue | Disease Stage | Target Gene | RSS | Regulon Activity |
| ∗The dot plots of a searched regulon are shown for all cell subpopulations in each disease state of each tissue based on the regulon specific score inferred using pySCENIC and by calculating the average expression. |
| Page: 1 |
Top |
Somatic mutation of malignant transformation related genes |
| Annotation of somatic variants for genes involved in malignant transformation |
| Hugo Symbol | Variant Class | Variant Classification | dbSNP RS | HGVSc | HGVSp | HGVSp Short | SWISSPROT | BIOTYPE | SIFT | PolyPhen | Tumor Sample Barcode | Tissue | Histology | Sex | Age | Stage | Therapy Types | Drugs | Outcome |
| DIDO1 | SNV | Missense_Mutation | novel | c.4420N>C | p.Glu1474Gln | p.E1474Q | Q9BTC0 | protein_coding | deleterious(0.01) | benign(0.425) | TCGA-3C-AALI-01 | Breast | breast invasive carcinoma | Female | <65 | I/II | Unspecific | Poly E | Complete Response |
| DIDO1 | SNV | Missense_Mutation | c.4516N>A | p.Ala1506Thr | p.A1506T | Q9BTC0 | protein_coding | deleterious(0.02) | possibly_damaging(0.648) | TCGA-A2-A0YG-01 | Breast | breast invasive carcinoma | Female | <65 | III/IV | Chemotherapy | cytoxan | SD | |
| DIDO1 | SNV | Missense_Mutation | c.697N>A | p.Asp233Asn | p.D233N | Q9BTC0 | protein_coding | tolerated(0.15) | benign(0.017) | TCGA-A7-A0D9-01 | Breast | breast invasive carcinoma | Female | <65 | I/II | Chemotherapy | taxotere | SD | |
| DIDO1 | SNV | Missense_Mutation | c.365N>C | p.Arg122Thr | p.R122T | Q9BTC0 | protein_coding | deleterious(0) | benign(0.081) | TCGA-A8-A09G-01 | Breast | breast invasive carcinoma | Female | >=65 | III/IV | Unknown | Unknown | SD | |
| DIDO1 | SNV | Missense_Mutation | c.2511G>C | p.Leu837Phe | p.L837F | Q9BTC0 | protein_coding | deleterious(0) | probably_damaging(0.997) | TCGA-AC-A23H-01 | Breast | breast invasive carcinoma | Female | >=65 | I/II | Unknown | Unknown | PD | |
| DIDO1 | SNV | Missense_Mutation | c.784G>A | p.Glu262Lys | p.E262K | Q9BTC0 | protein_coding | deleterious(0) | possibly_damaging(0.761) | TCGA-AC-A23H-01 | Breast | breast invasive carcinoma | Female | >=65 | I/II | Unknown | Unknown | PD | |
| DIDO1 | SNV | Missense_Mutation | novel | c.6628N>C | p.Asp2210His | p.D2210H | Q9BTC0 | protein_coding | deleterious_low_confidence(0) | possibly_damaging(0.902) | TCGA-AC-A8OP-01 | Breast | breast invasive carcinoma | Female | >=65 | I/II | Unknown | Unknown | SD |
| DIDO1 | SNV | Missense_Mutation | novel | c.6347N>G | p.Glu2116Gly | p.E2116G | Q9BTC0 | protein_coding | deleterious(0.04) | possibly_damaging(0.655) | TCGA-BH-A0GY-01 | Breast | breast invasive carcinoma | Female | >=65 | I/II | Chemotherapy | cyotxan | SD |
| DIDO1 | SNV | Missense_Mutation | novel | c.2426C>T | p.Ser809Leu | p.S809L | Q9BTC0 | protein_coding | deleterious(0) | probably_damaging(0.998) | TCGA-C8-A133-01 | Breast | breast invasive carcinoma | Female | >=65 | III/IV | Unknown | Unknown | SD |
| DIDO1 | SNV | Missense_Mutation | c.5409G>C | p.Gln1803His | p.Q1803H | Q9BTC0 | protein_coding | deleterious(0.01) | possibly_damaging(0.819) | TCGA-C8-A274-01 | Breast | breast invasive carcinoma | Female | <65 | I/II | Hormone Therapy | tamoxiphen | SD |
| Page: 1 2 3 4 5 6 7 8 9 10 11 12 13 14 15 16 17 18 19 20 21 22 23 24 25 26 27 28 29 30 31 32 |
Top |
Related drugs of malignant transformation related genes |
| Identification of chemicals and drugs interact with genes involved in malignant transfromation |
| (DGIdb 4.0) |
| Entrez ID | Symbol | Category | Interaction Types | Drug Claim Name | Drug Name | PMIDs |
| Page: 1 |

Copyright 2023-Present -The University of Texas Health Science Center at Houston |