| Tissue | Expression Dynamics | Abbreviation |
| Cervix | 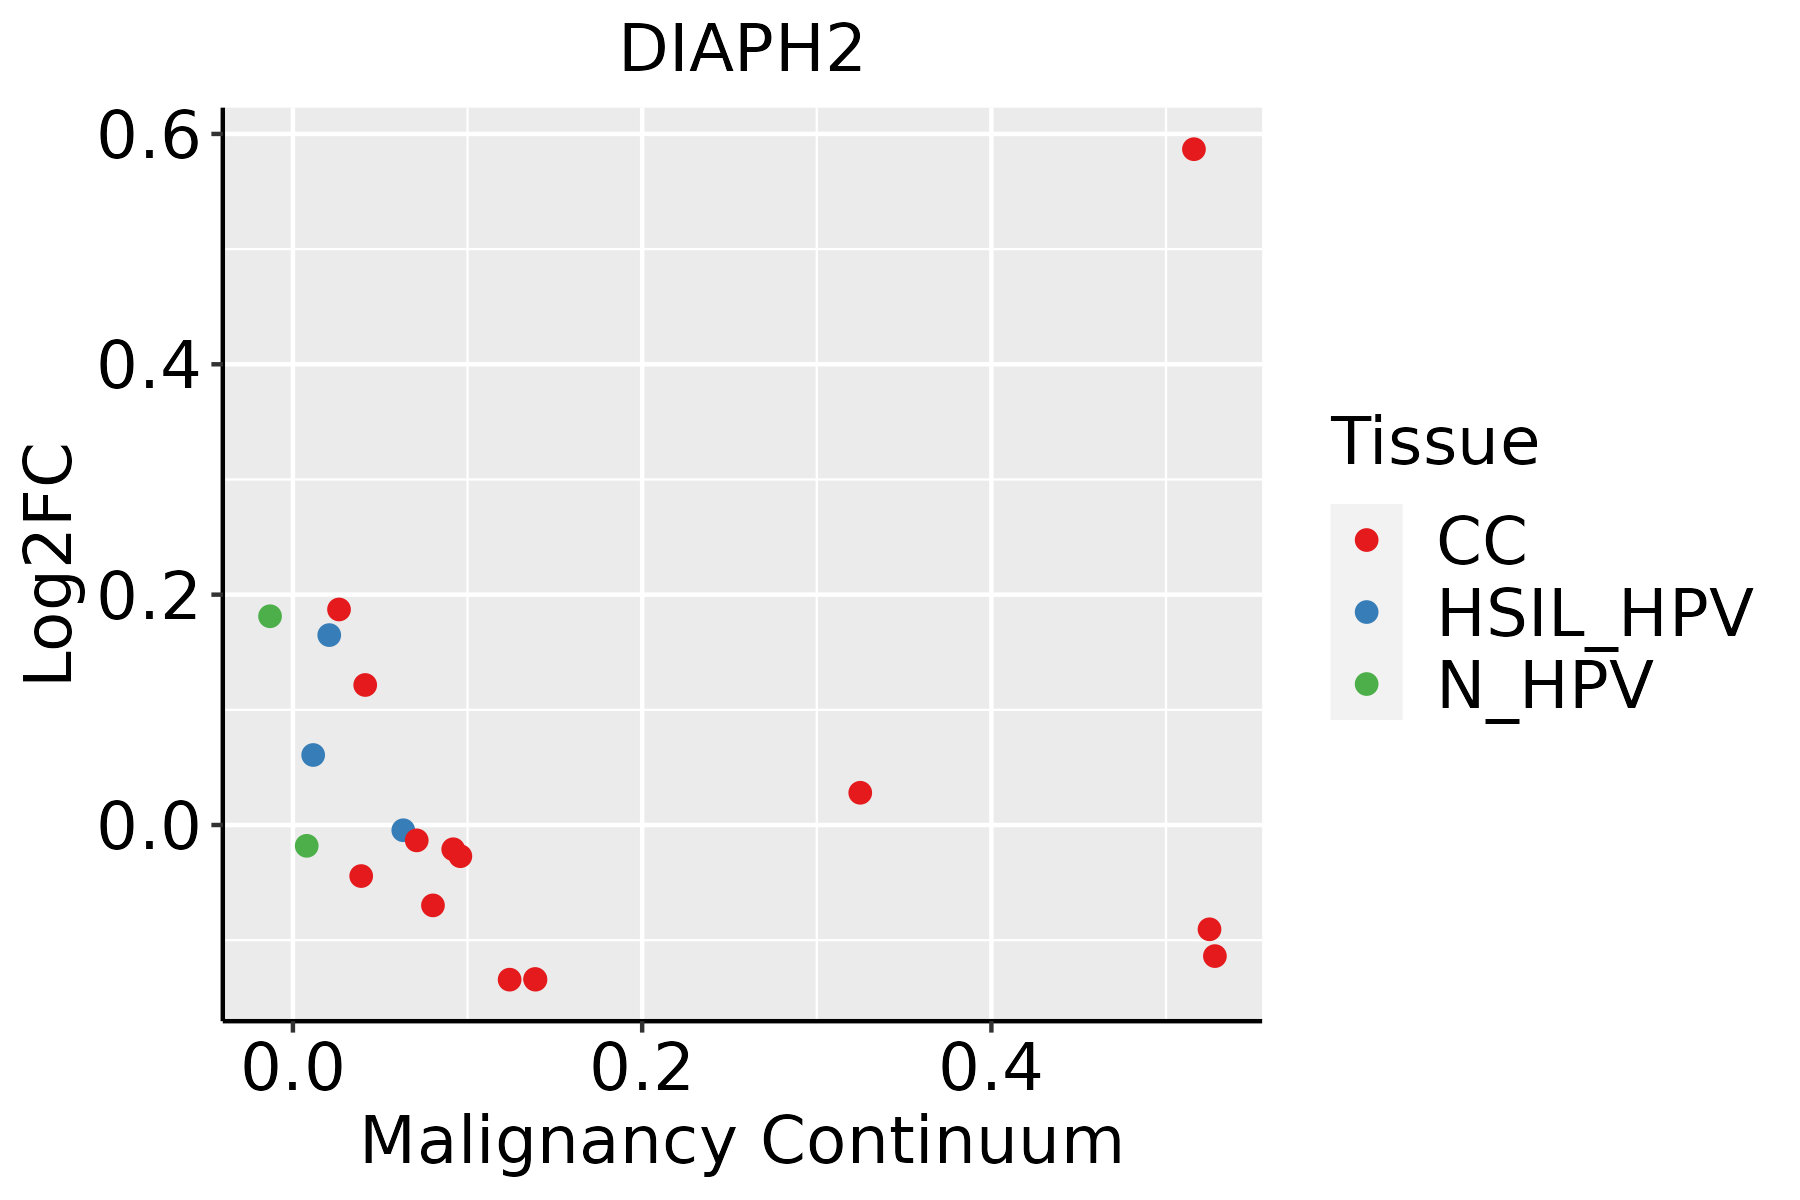 | CC: Cervix cancer |
| HSIL_HPV: HPV-infected high-grade squamous intraepithelial lesions |
| N_HPV: HPV-infected normal cervix |
| Colorectum (GSE201348) |  | FAP: Familial adenomatous polyposis |
| CRC: Colorectal cancer |
| Colorectum (HTA11) |  | AD: Adenomas |
| SER: Sessile serrated lesions |
| MSI-H: Microsatellite-high colorectal cancer |
| MSS: Microsatellite stable colorectal cancer |
| Endometrium |  | AEH: Atypical endometrial hyperplasia |
| EEC: Endometrioid Cancer |
| Esophagus |  | ESCC: Esophageal squamous cell carcinoma |
| HGIN: High-grade intraepithelial neoplasias |
| LGIN: Low-grade intraepithelial neoplasias |
| GC |  | CAG: Chronic atrophic gastritis |
| CAG with IM: Chronic atrophic gastritis with intestinal metaplasia |
| CSG: Chronic superficial gastritis |
| GC: Gastric cancer |
| SIM: Severe intestinal metaplasia |
| WIM: Wild intestinal metaplasia |
| Liver |  | HCC: Hepatocellular carcinoma |
| NAFLD: Non-alcoholic fatty liver disease |
| Lung |  | AAH: Atypical adenomatous hyperplasia |
| AIS: Adenocarcinoma in situ |
| IAC: Invasive lung adenocarcinoma |
| MIA: Minimally invasive adenocarcinoma |
| Oral Cavity | 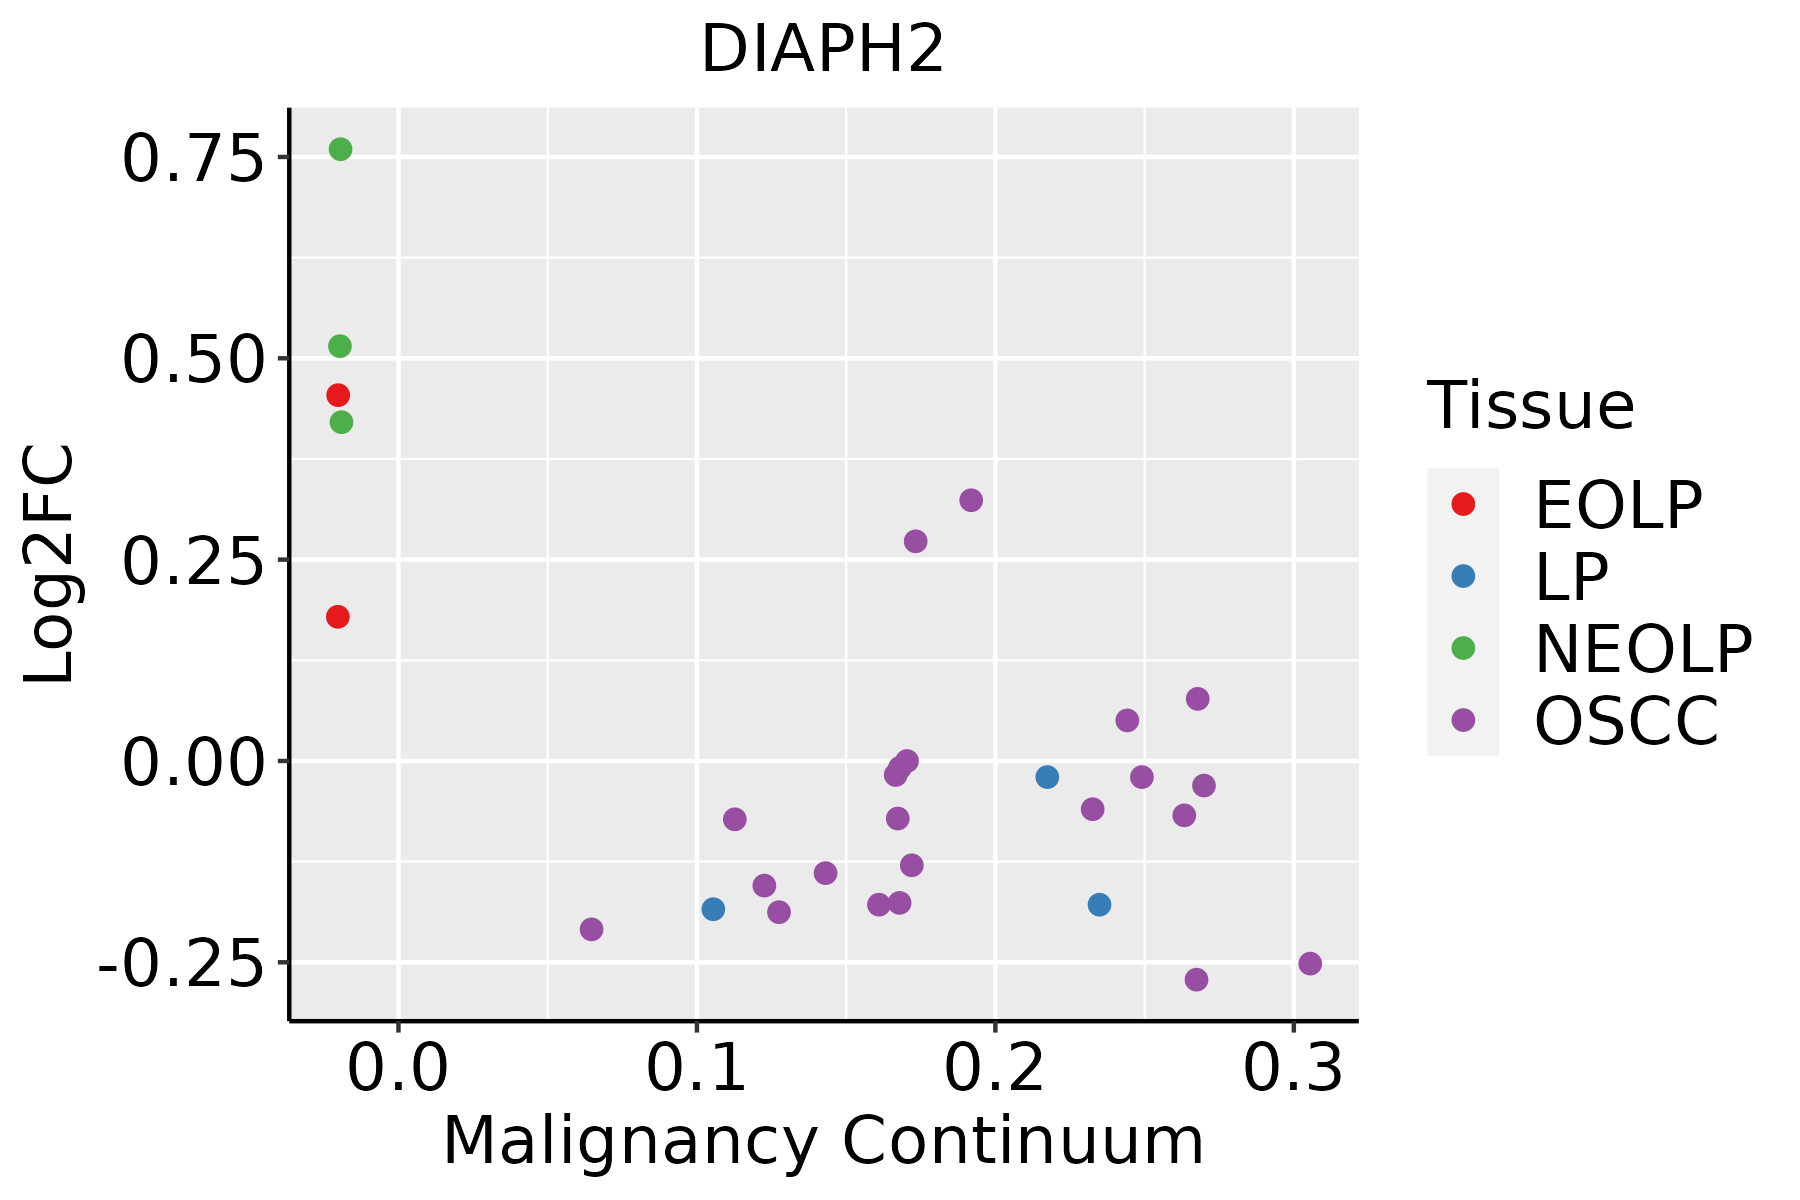 | EOLP: Erosive Oral lichen planus |
| LP: leukoplakia |
| NEOLP: Non-erosive oral lichen planus |
| OSCC: Oral squamous cell carcinoma |
| Thyroid | 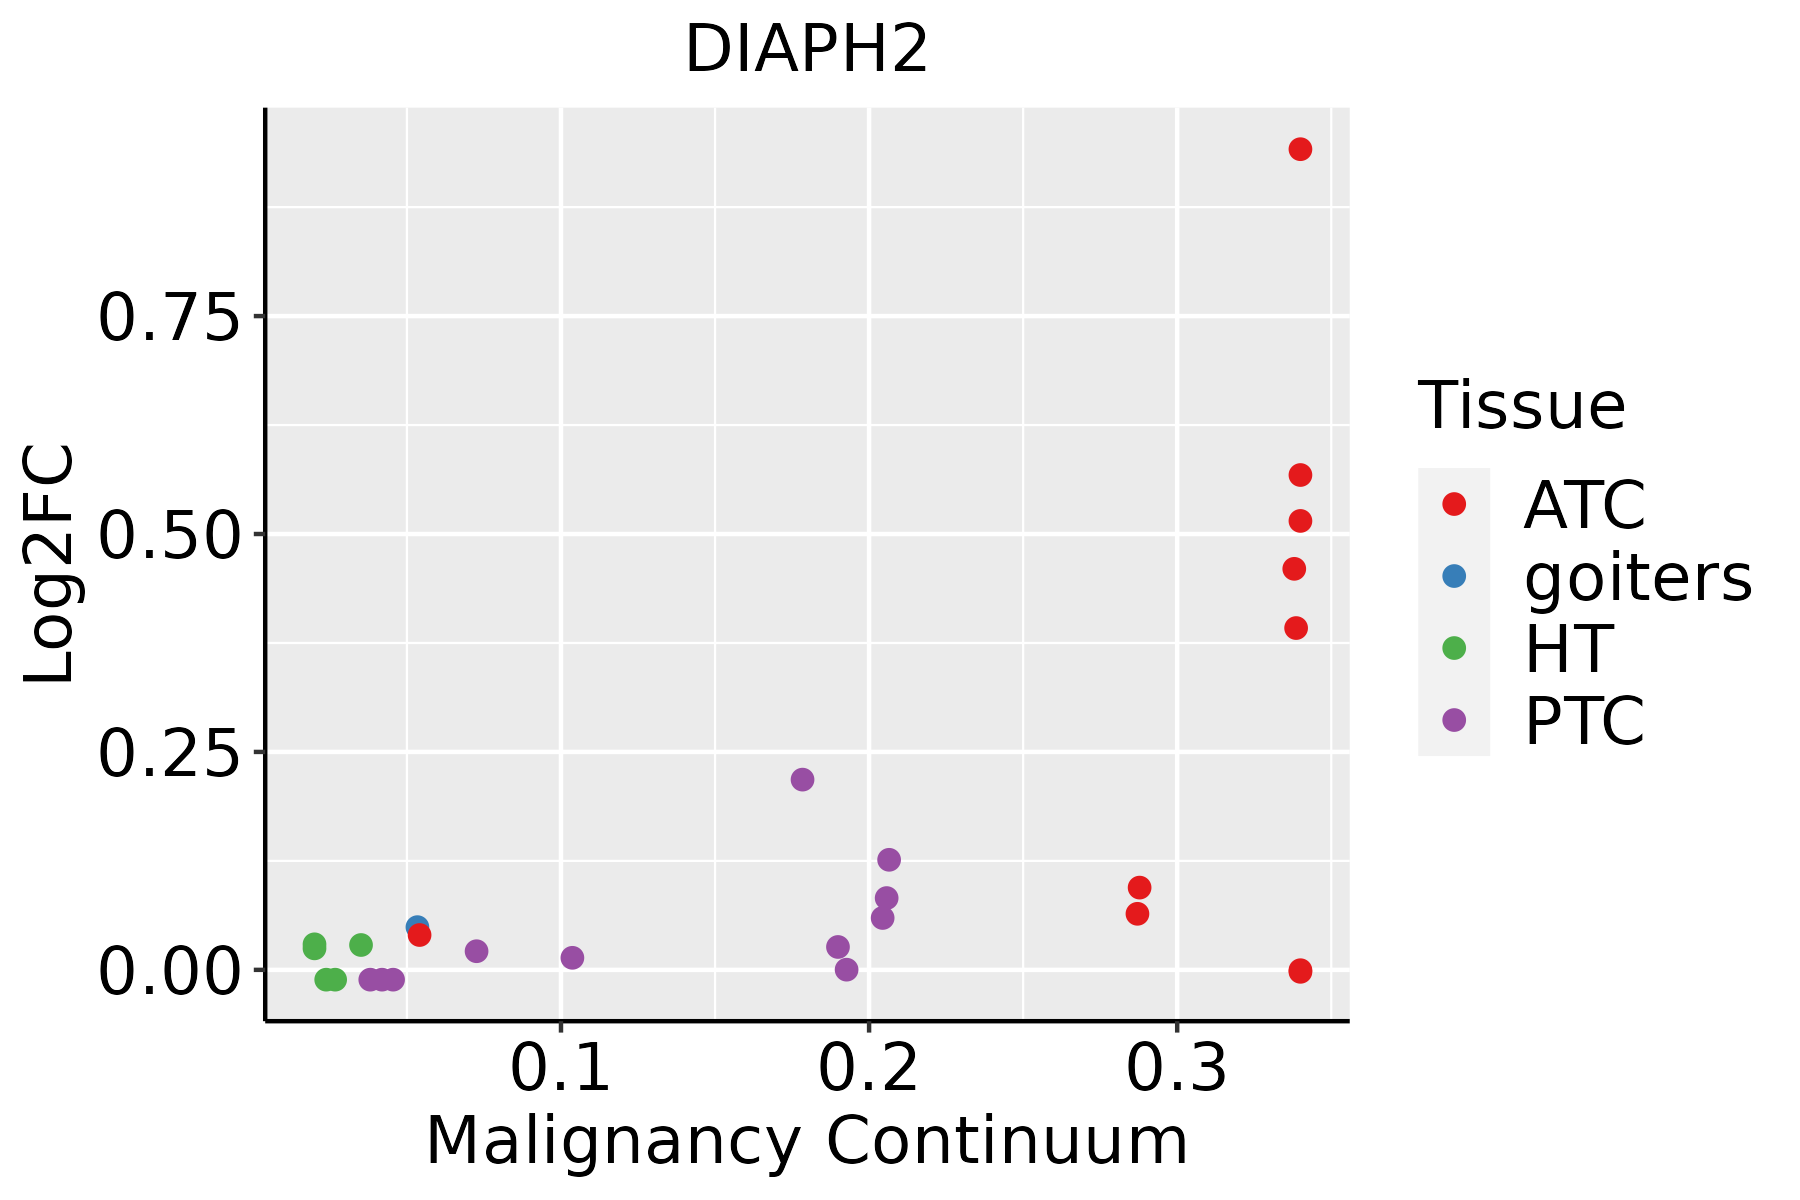 | ATC: Anaplastic thyroid cancer |
| HT: Hashimoto's thyroiditis |
| PTC: Papillary thyroid cancer |
| GO ID | Tissue | Disease Stage | Description | Gene Ratio | Bg Ratio | pvalue | p.adjust | Count |
| GO:000701510 | Cervix | CC | actin filament organization | 109/2311 | 442/18723 | 4.92e-13 | 2.45e-10 | 109 |
| GO:000701515 | Cervix | HSIL_HPV | actin filament organization | 43/737 | 442/18723 | 4.77e-08 | 3.59e-06 | 43 |
| GO:000701525 | Cervix | N_HPV | actin filament organization | 29/534 | 442/18723 | 3.00e-05 | 8.02e-04 | 29 |
| GO:0007015 | Colorectum | AD | actin filament organization | 167/3918 | 442/18723 | 1.65e-16 | 7.94e-14 | 167 |
| GO:00070151 | Colorectum | SER | actin filament organization | 134/2897 | 442/18723 | 1.39e-15 | 5.70e-13 | 134 |
| GO:00070152 | Colorectum | MSS | actin filament organization | 146/3467 | 442/18723 | 1.16e-13 | 2.67e-11 | 146 |
| GO:00070153 | Colorectum | MSI-H | actin filament organization | 50/1319 | 442/18723 | 6.19e-04 | 1.21e-02 | 50 |
| GO:00070154 | Colorectum | FAP | actin filament organization | 125/2622 | 442/18723 | 1.97e-15 | 3.03e-12 | 125 |
| GO:00070155 | Colorectum | CRC | actin filament organization | 104/2078 | 442/18723 | 4.75e-14 | 7.12e-11 | 104 |
| GO:000701516 | Endometrium | AEH | actin filament organization | 98/2100 | 442/18723 | 1.99e-11 | 2.98e-09 | 98 |
| GO:000701517 | Endometrium | EEC | actin filament organization | 95/2168 | 442/18723 | 1.31e-09 | 1.09e-07 | 95 |
| GO:000701527 | Esophagus | ESCC | actin filament organization | 259/8552 | 442/18723 | 2.37e-08 | 4.50e-07 | 259 |
| GO:00070157 | Liver | NAFLD | actin filament organization | 78/1882 | 442/18723 | 5.44e-07 | 3.21e-05 | 78 |
| GO:000701512 | Liver | Cirrhotic | actin filament organization | 171/4634 | 442/18723 | 3.93e-11 | 2.30e-09 | 171 |
| GO:000701522 | Liver | HCC | actin filament organization | 252/7958 | 442/18723 | 3.83e-10 | 1.25e-08 | 252 |
| GO:00070158 | Lung | IAC | actin filament organization | 92/2061 | 442/18723 | 1.01e-09 | 1.93e-07 | 92 |
| GO:000701513 | Lung | AIS | actin filament organization | 88/1849 | 442/18723 | 1.02e-10 | 3.13e-08 | 88 |
| GO:000701523 | Lung | AAH | actin filament organization | 37/613 | 442/18723 | 1.88e-07 | 9.56e-05 | 37 |
| GO:000701533 | Lung | MIAC | actin filament organization | 50/967 | 442/18723 | 1.64e-07 | 3.81e-05 | 50 |
| GO:000701520 | Oral cavity | OSCC | actin filament organization | 230/7305 | 442/18723 | 1.37e-08 | 2.77e-07 | 230 |
| Pathway ID | Tissue | Disease Stage | Description | Gene Ratio | Bg Ratio | pvalue | p.adjust | qvalue | Count |
| hsa0481016 | Cervix | CC | Regulation of actin cytoskeleton | 64/1267 | 229/8465 | 2.24e-07 | 2.59e-06 | 1.53e-06 | 64 |
| hsa0481017 | Cervix | CC | Regulation of actin cytoskeleton | 64/1267 | 229/8465 | 2.24e-07 | 2.59e-06 | 1.53e-06 | 64 |
| hsa04810 | Colorectum | AD | Regulation of actin cytoskeleton | 75/2092 | 229/8465 | 3.36e-03 | 1.76e-02 | 1.12e-02 | 75 |
| hsa048101 | Colorectum | AD | Regulation of actin cytoskeleton | 75/2092 | 229/8465 | 3.36e-03 | 1.76e-02 | 1.12e-02 | 75 |
| hsa048102 | Colorectum | SER | Regulation of actin cytoskeleton | 60/1580 | 229/8465 | 2.74e-03 | 2.02e-02 | 1.47e-02 | 60 |
| hsa048103 | Colorectum | SER | Regulation of actin cytoskeleton | 60/1580 | 229/8465 | 2.74e-03 | 2.02e-02 | 1.47e-02 | 60 |
| hsa048104 | Colorectum | MSS | Regulation of actin cytoskeleton | 68/1875 | 229/8465 | 4.27e-03 | 1.86e-02 | 1.14e-02 | 68 |
| hsa048105 | Colorectum | MSS | Regulation of actin cytoskeleton | 68/1875 | 229/8465 | 4.27e-03 | 1.86e-02 | 1.14e-02 | 68 |
| hsa048106 | Colorectum | FAP | Regulation of actin cytoskeleton | 65/1404 | 229/8465 | 4.07e-06 | 5.91e-05 | 3.59e-05 | 65 |
| hsa048107 | Colorectum | FAP | Regulation of actin cytoskeleton | 65/1404 | 229/8465 | 4.07e-06 | 5.91e-05 | 3.59e-05 | 65 |
| hsa048108 | Colorectum | CRC | Regulation of actin cytoskeleton | 52/1091 | 229/8465 | 2.34e-05 | 5.57e-04 | 3.78e-04 | 52 |
| hsa048109 | Colorectum | CRC | Regulation of actin cytoskeleton | 52/1091 | 229/8465 | 2.34e-05 | 5.57e-04 | 3.78e-04 | 52 |
| hsa0481018 | Endometrium | AEH | Regulation of actin cytoskeleton | 50/1197 | 229/8465 | 9.08e-04 | 5.78e-03 | 4.23e-03 | 50 |
| hsa0481019 | Endometrium | AEH | Regulation of actin cytoskeleton | 50/1197 | 229/8465 | 9.08e-04 | 5.78e-03 | 4.23e-03 | 50 |
| hsa0481024 | Endometrium | EEC | Regulation of actin cytoskeleton | 49/1237 | 229/8465 | 3.20e-03 | 1.78e-02 | 1.33e-02 | 49 |
| hsa0481034 | Endometrium | EEC | Regulation of actin cytoskeleton | 49/1237 | 229/8465 | 3.20e-03 | 1.78e-02 | 1.33e-02 | 49 |
| hsa0481028 | Esophagus | ESCC | Regulation of actin cytoskeleton | 133/4205 | 229/8465 | 5.94e-03 | 1.48e-02 | 7.56e-03 | 133 |
| hsa04810112 | Esophagus | ESCC | Regulation of actin cytoskeleton | 133/4205 | 229/8465 | 5.94e-03 | 1.48e-02 | 7.56e-03 | 133 |
| hsa0481010 | Liver | NAFLD | Regulation of actin cytoskeleton | 50/1043 | 229/8465 | 3.01e-05 | 7.59e-04 | 6.11e-04 | 50 |
| hsa0481011 | Liver | NAFLD | Regulation of actin cytoskeleton | 50/1043 | 229/8465 | 3.01e-05 | 7.59e-04 | 6.11e-04 | 50 |
| Hugo Symbol | Variant Class | Variant Classification | dbSNP RS | HGVSc | HGVSp | HGVSp Short | SWISSPROT | BIOTYPE | SIFT | PolyPhen | Tumor Sample Barcode | Tissue | Histology | Sex | Age | Stage | Therapy Types | Drugs | Outcome |
| DIAPH2 | SNV | Missense_Mutation | novel | c.1496N>G | p.Glu499Gly | p.E499G | O60879 | protein_coding | deleterious(0) | probably_damaging(0.968) | TCGA-A2-A3XT-01 | Breast | breast invasive carcinoma | Female | <65 | I/II | Chemotherapy | cyclophosphamide | PR |
| DIAPH2 | SNV | Missense_Mutation | novel | c.877A>G | p.Lys293Glu | p.K293E | O60879 | protein_coding | tolerated(0.35) | benign(0.429) | TCGA-A8-A094-01 | Breast | breast invasive carcinoma | Female | >=65 | I/II | Unknown | Unknown | SD |
| DIAPH2 | SNV | Missense_Mutation | novel | c.157G>T | p.Asp53Tyr | p.D53Y | O60879 | protein_coding | deleterious(0.01) | probably_damaging(0.997) | TCGA-AN-A046-01 | Breast | breast invasive carcinoma | Female | >=65 | I/II | Unknown | Unknown | SD |
| DIAPH2 | SNV | Missense_Mutation | | c.2875N>C | p.Glu959Gln | p.E959Q | O60879 | protein_coding | tolerated(0.13) | benign(0.336) | TCGA-AR-A24H-01 | Breast | breast invasive carcinoma | Female | >=65 | I/II | Hormone Therapy | tamoxiphen | SD |
| DIAPH2 | SNV | Missense_Mutation | | c.1837N>T | p.Pro613Ser | p.P613S | O60879 | protein_coding | tolerated(0.33) | benign(0.001) | TCGA-AR-A2LE-01 | Breast | breast invasive carcinoma | Female | >=65 | I/II | Hormone Therapy | tamoxiphen | PD |
| DIAPH2 | SNV | Missense_Mutation | | c.218N>G | p.Leu73Arg | p.L73R | O60879 | protein_coding | tolerated(0.35) | possibly_damaging(0.658) | TCGA-BH-A0AY-01 | Breast | breast invasive carcinoma | Female | <65 | I/II | Chemotherapy | | SD |
| DIAPH2 | SNV | Missense_Mutation | novel | c.2221G>C | p.Asp741His | p.D741H | O60879 | protein_coding | deleterious(0.05) | benign(0.309) | TCGA-BH-A0DZ-01 | Breast | breast invasive carcinoma | Female | <65 | I/II | Chemotherapy | docetaxel | SD |
| DIAPH2 | SNV | Missense_Mutation | | c.3248G>A | p.Arg1083Lys | p.R1083K | O60879 | protein_coding | tolerated(0.16) | benign(0.039) | TCGA-BH-A0HF-01 | Breast | breast invasive carcinoma | Female | >=65 | I/II | Hormone Therapy | arimidex | SD |
| DIAPH2 | SNV | Missense_Mutation | rs775206145 | c.2800N>T | p.Pro934Ser | p.P934S | O60879 | protein_coding | tolerated(0.07) | possibly_damaging(0.565) | TCGA-D8-A1J8-01 | Breast | breast invasive carcinoma | Female | >=65 | I/II | Hormone Therapy | nolvadex | SD |
| DIAPH2 | SNV | Missense_Mutation | | c.1040N>A | p.Ile347Lys | p.I347K | O60879 | protein_coding | deleterious(0) | probably_damaging(0.986) | TCGA-D8-A1XM-01 | Breast | breast invasive carcinoma | Female | <65 | I/II | Unknown | Unknown | SD |


