| Tissue | Expression Dynamics | Abbreviation |
| Endometrium | 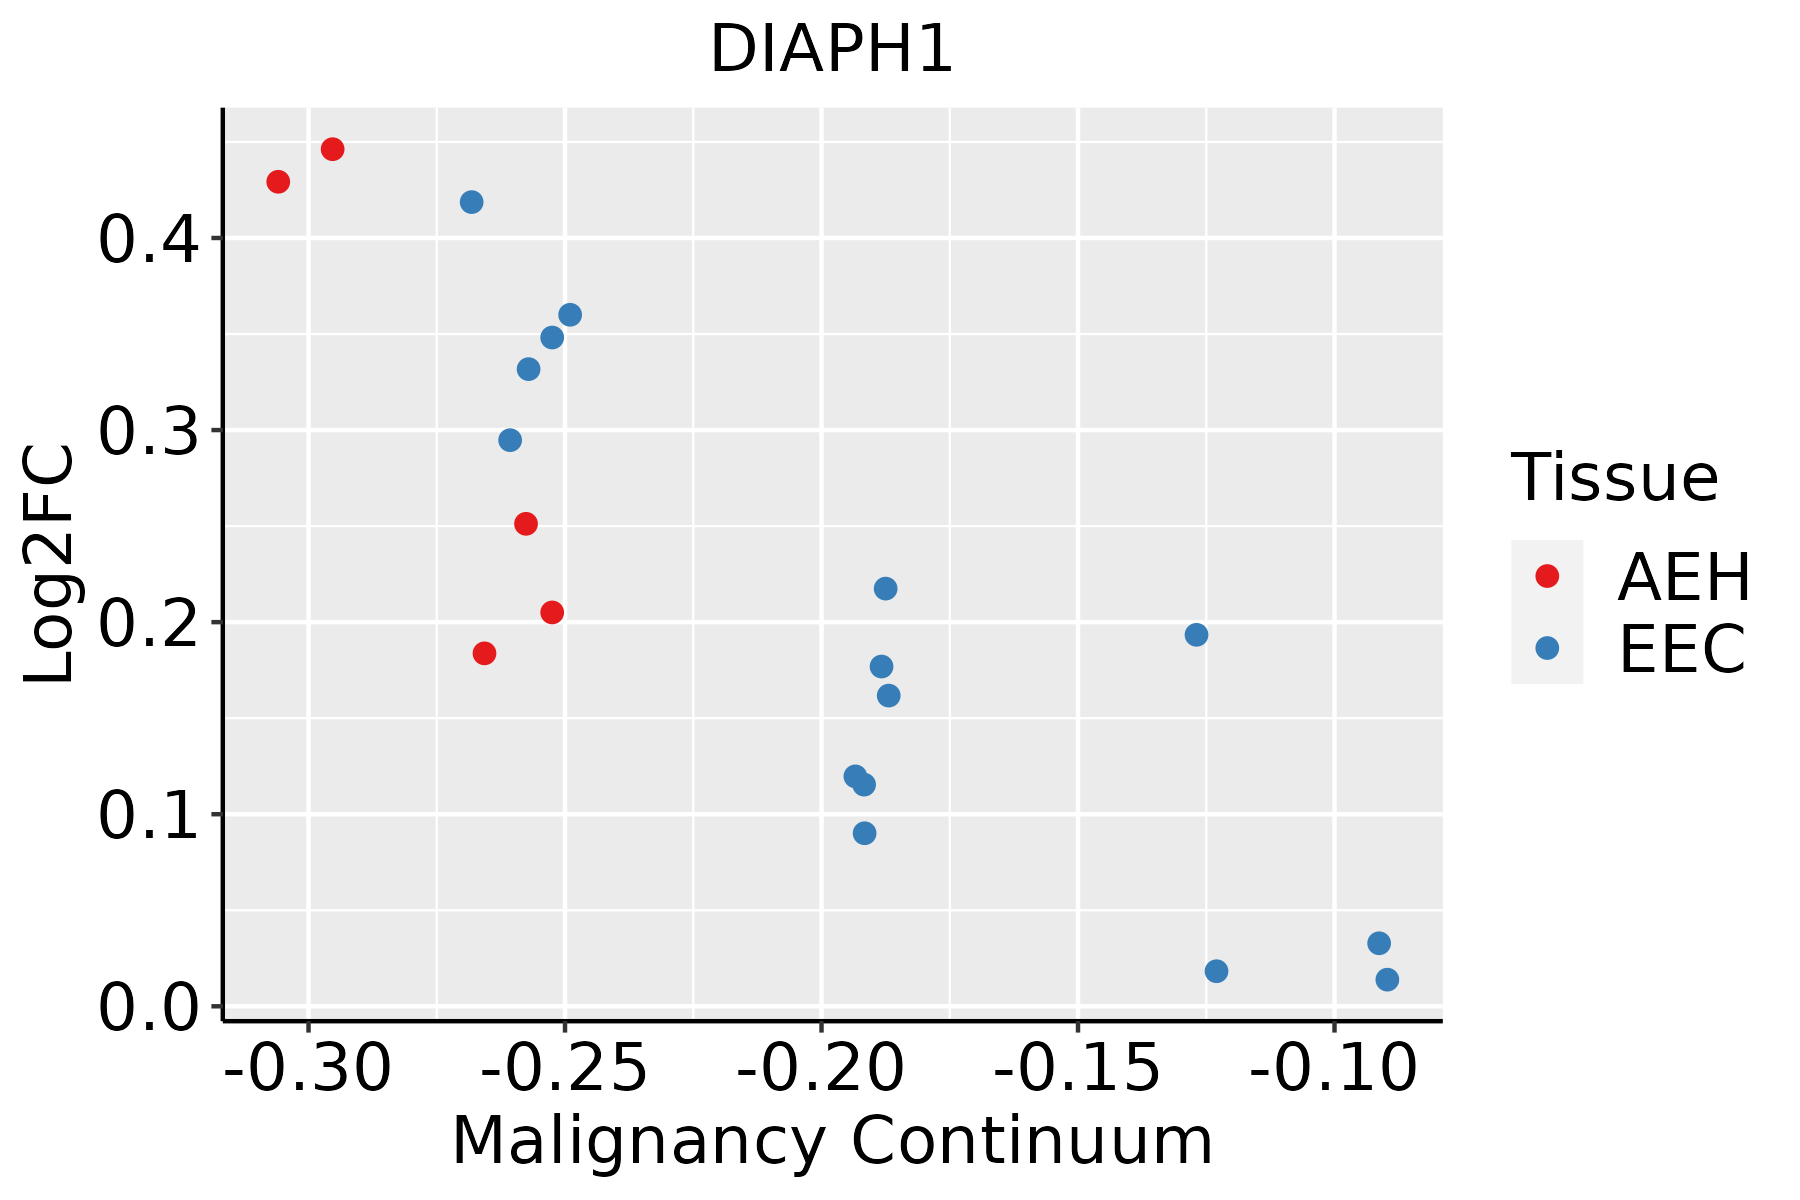 | AEH: Atypical endometrial hyperplasia |
| EEC: Endometrioid Cancer |
| Esophagus | 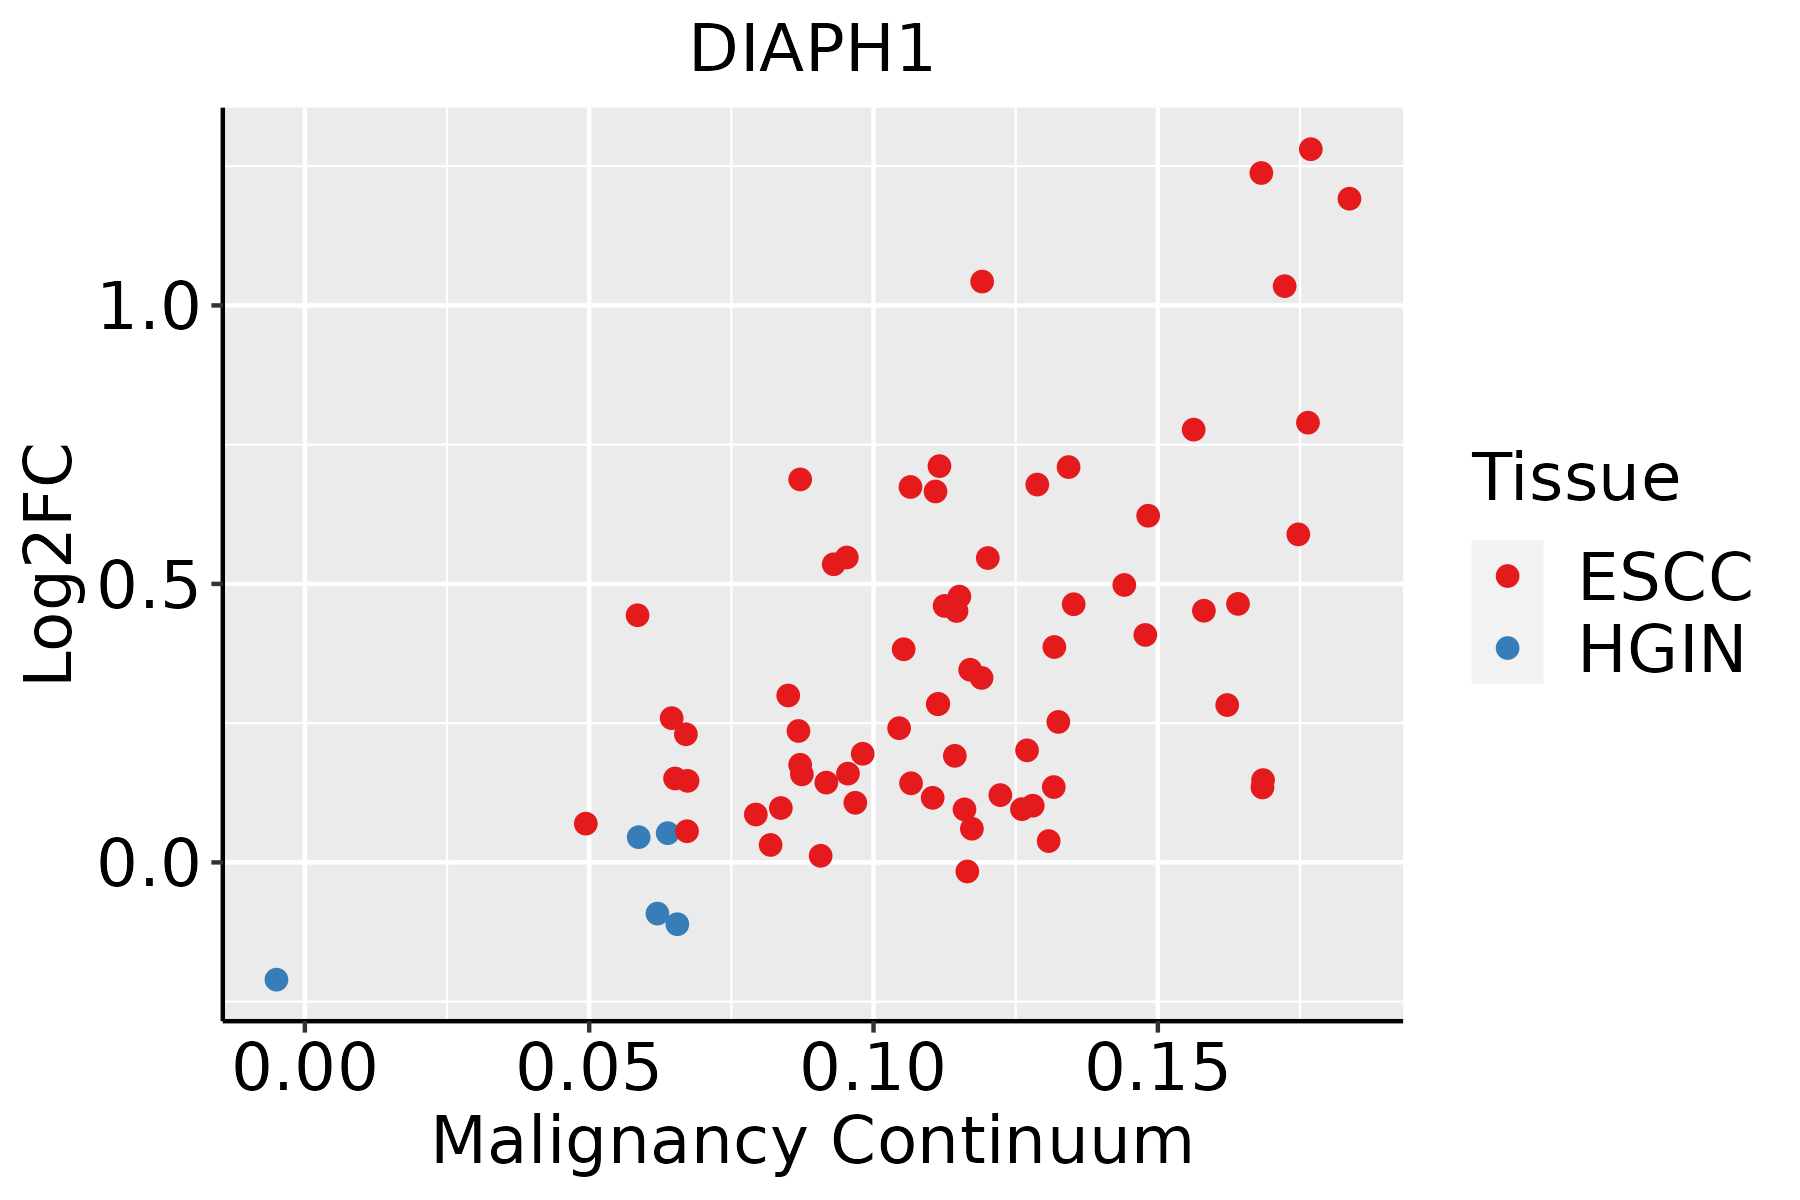 | ESCC: Esophageal squamous cell carcinoma |
| HGIN: High-grade intraepithelial neoplasias |
| LGIN: Low-grade intraepithelial neoplasias |
| Liver | 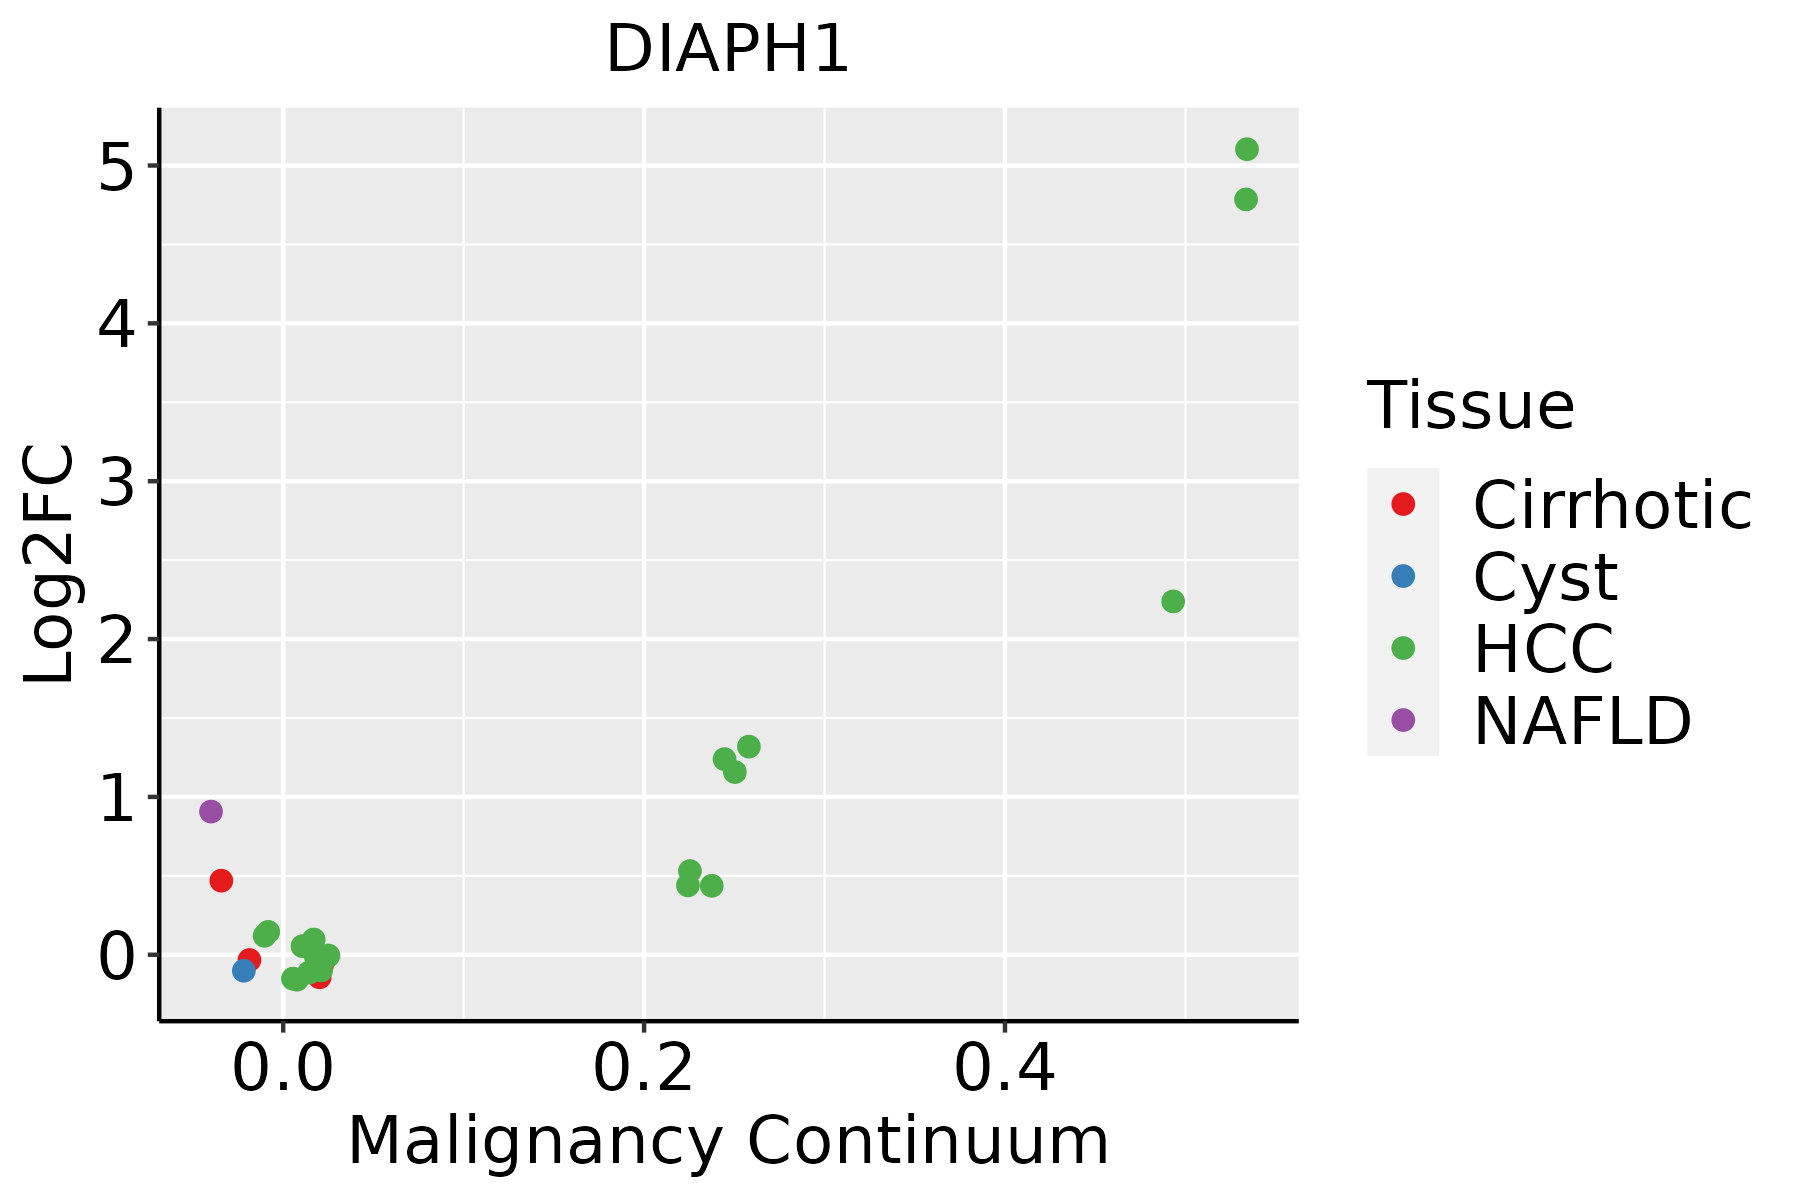 | HCC: Hepatocellular carcinoma |
| NAFLD: Non-alcoholic fatty liver disease |
| Lung | 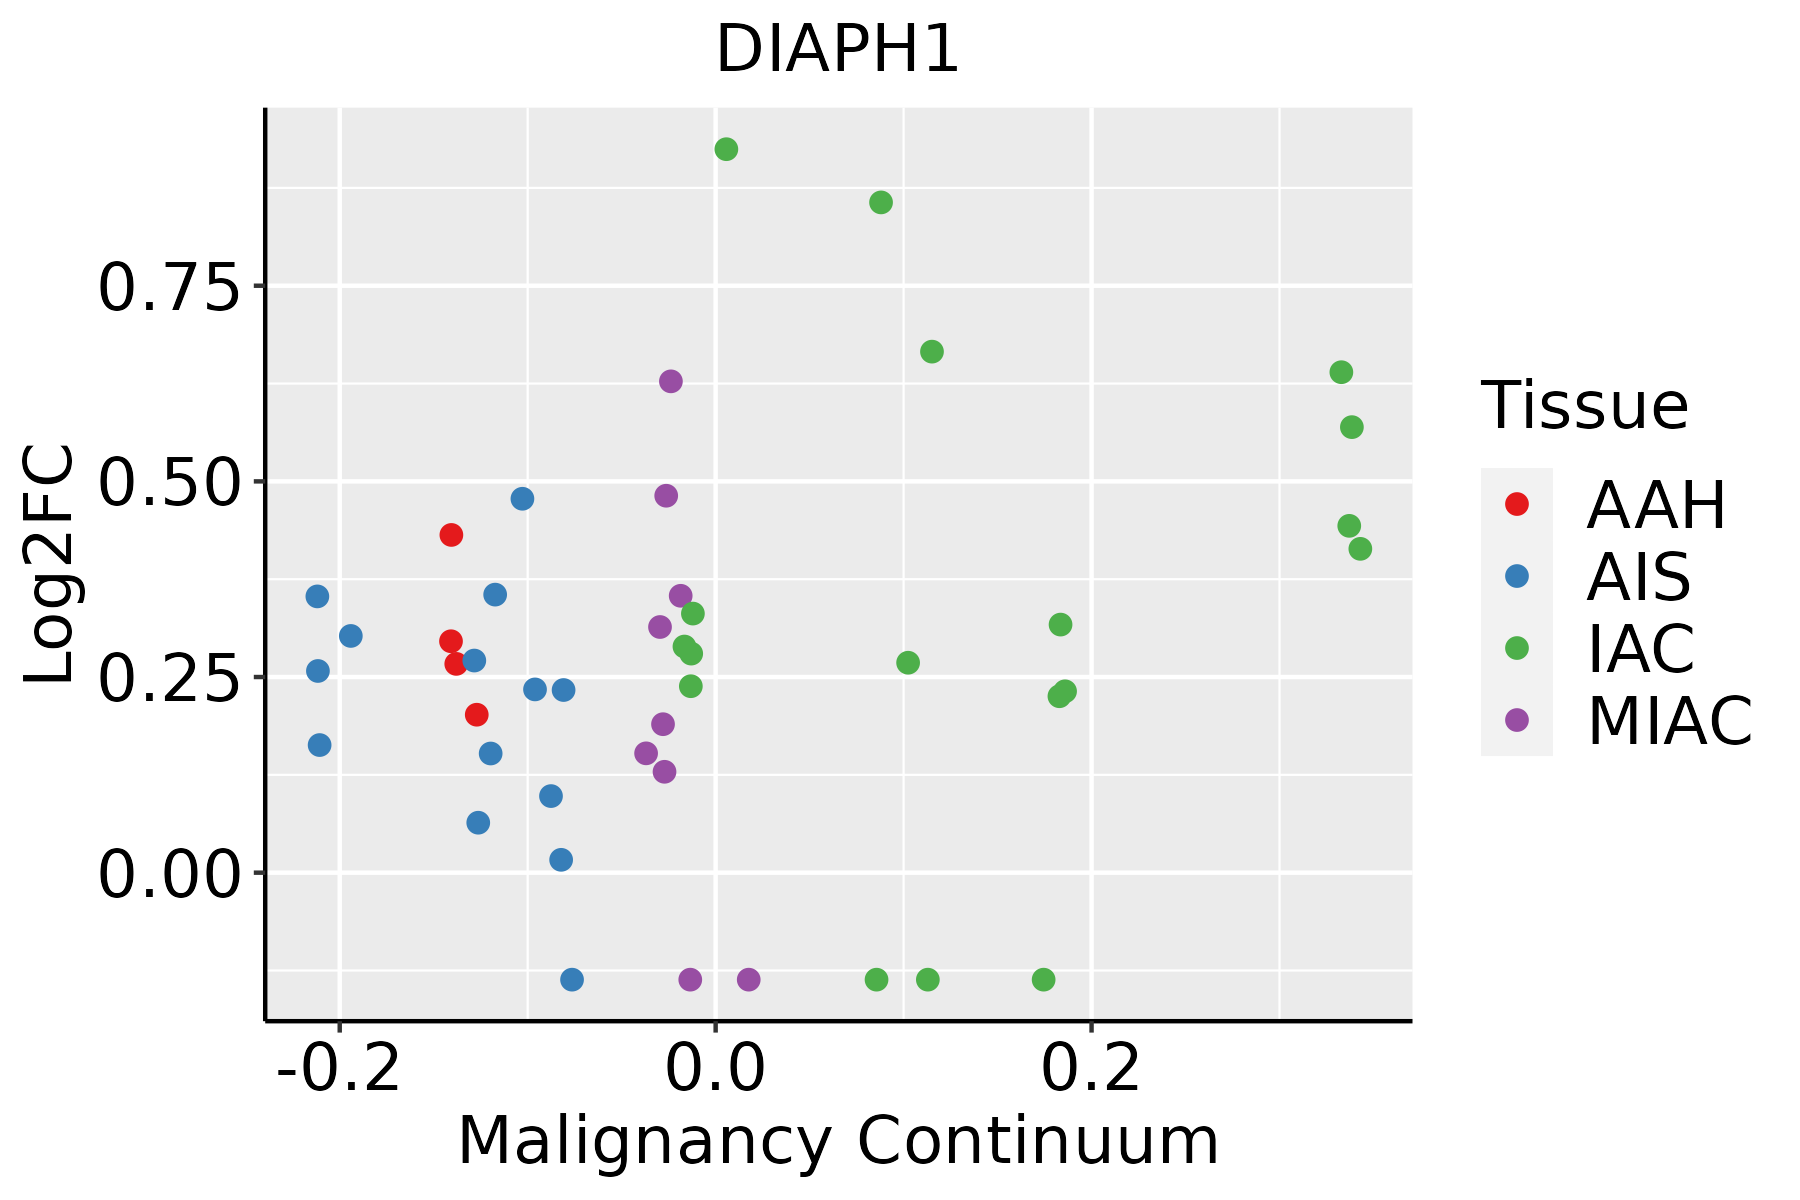 | AAH: Atypical adenomatous hyperplasia |
| AIS: Adenocarcinoma in situ |
| IAC: Invasive lung adenocarcinoma |
| MIA: Minimally invasive adenocarcinoma |
| Oral Cavity |  | EOLP: Erosive Oral lichen planus |
| LP: leukoplakia |
| NEOLP: Non-erosive oral lichen planus |
| OSCC: Oral squamous cell carcinoma |
| Prostate |  | BPH: Benign Prostatic Hyperplasia |
| Skin | 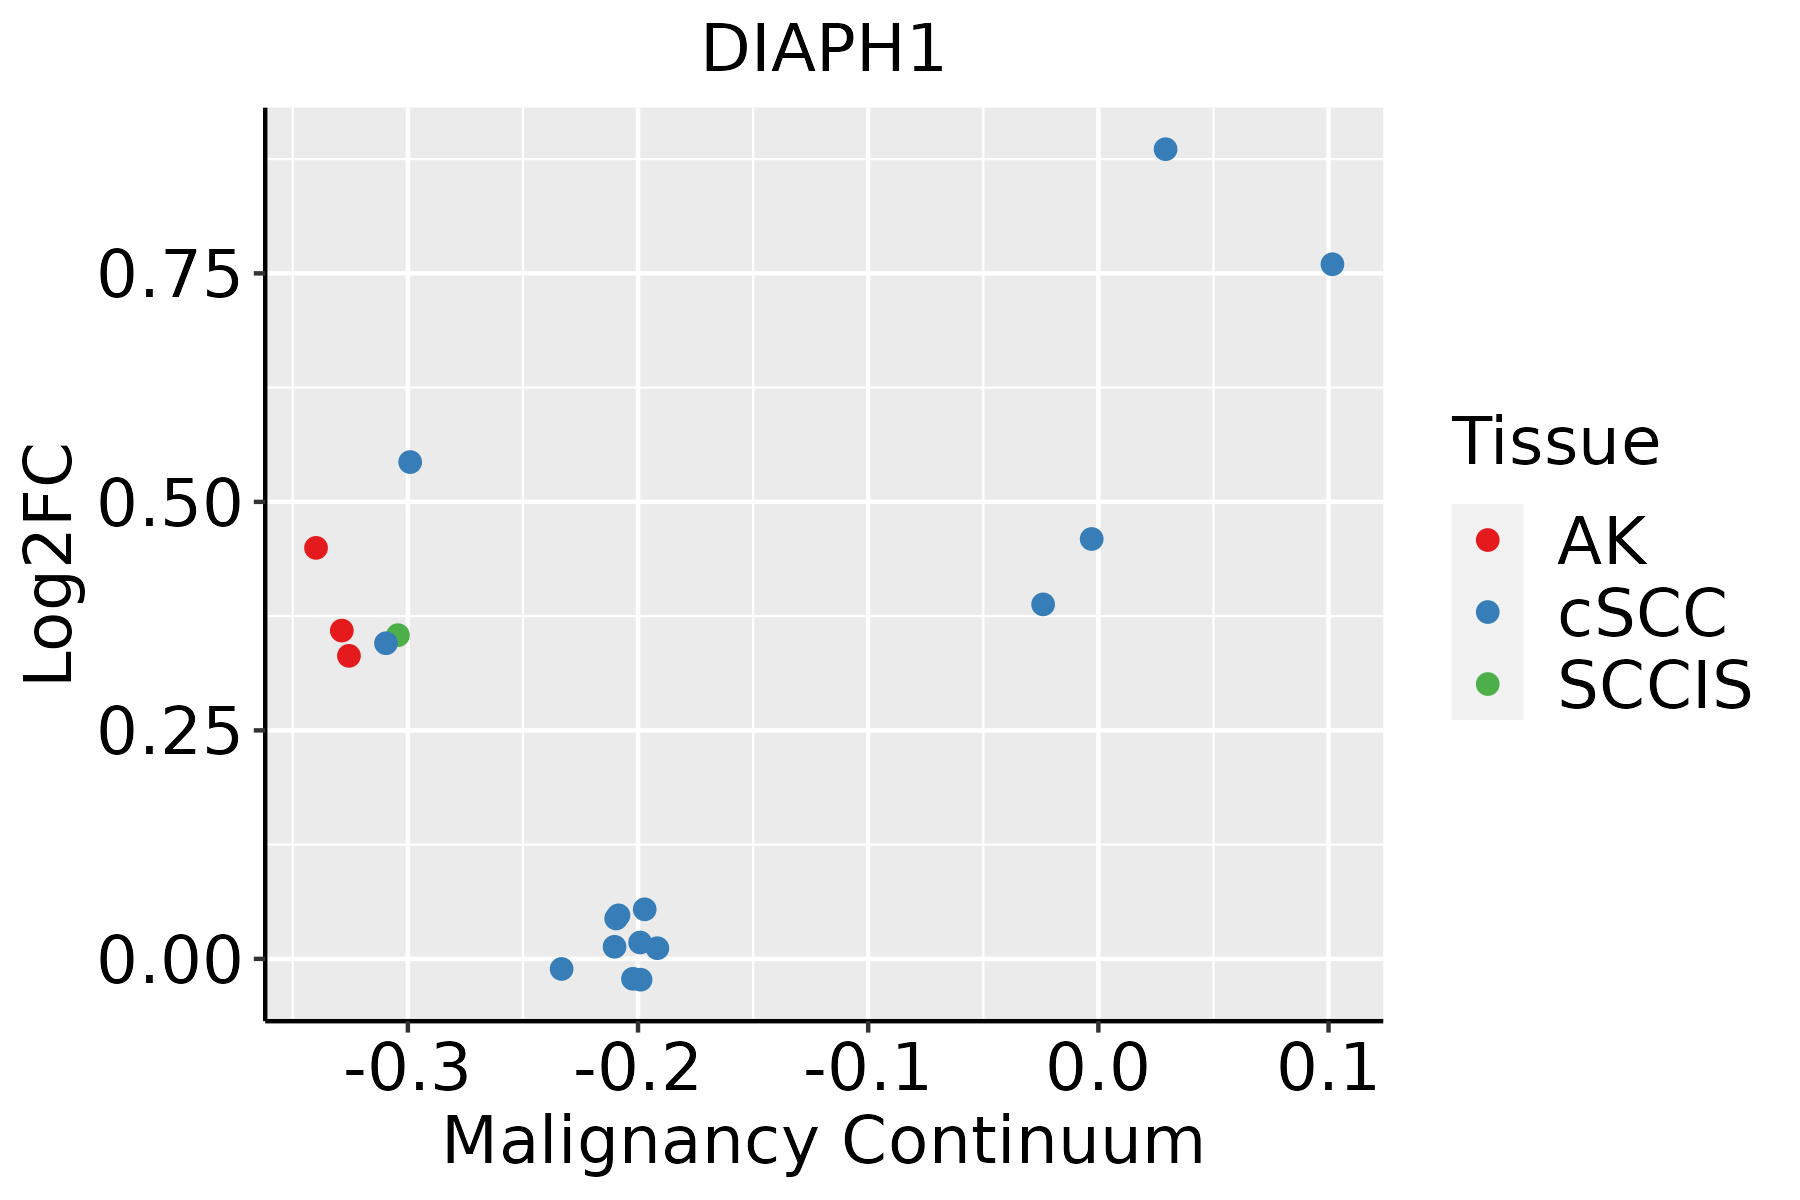 | AK: Actinic keratosis |
| cSCC: Cutaneous squamous cell carcinoma |
| SCCIS:squamous cell carcinoma in situ |
| Thyroid | 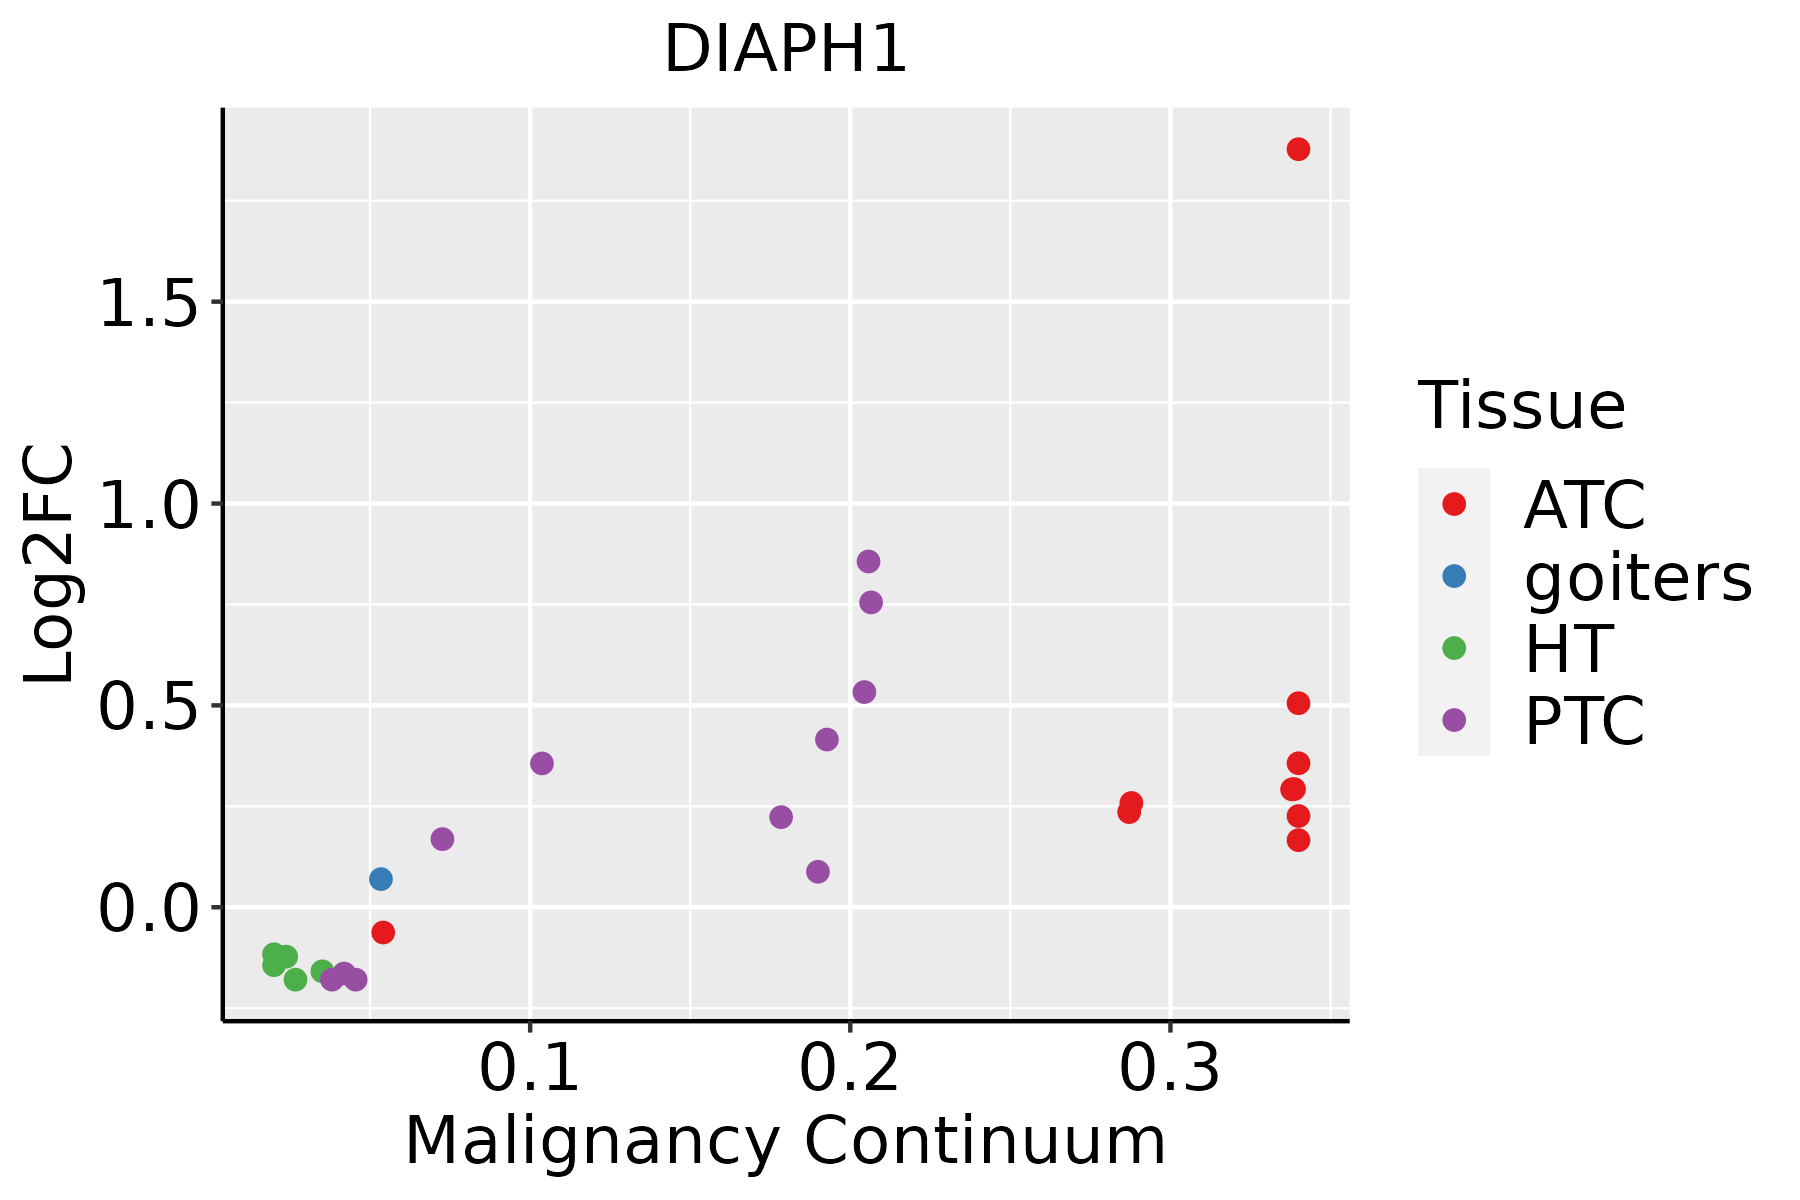 | ATC: Anaplastic thyroid cancer |
| HT: Hashimoto's thyroiditis |
| PTC: Papillary thyroid cancer |
| GO ID | Tissue | Disease Stage | Description | Gene Ratio | Bg Ratio | pvalue | p.adjust | Count |
| GO:002260415 | Endometrium | AEH | regulation of cell morphogenesis | 79/2100 | 309/18723 | 1.04e-12 | 2.24e-10 | 79 |
| GO:000701516 | Endometrium | AEH | actin filament organization | 98/2100 | 442/18723 | 1.99e-11 | 2.98e-09 | 98 |
| GO:005125816 | Endometrium | AEH | protein polymerization | 62/2100 | 297/18723 | 9.04e-07 | 3.19e-05 | 62 |
| GO:005165116 | Endometrium | AEH | maintenance of location in cell | 44/2100 | 214/18723 | 4.84e-05 | 7.94e-04 | 44 |
| GO:000815410 | Endometrium | AEH | actin polymerization or depolymerization | 44/2100 | 218/18723 | 7.64e-05 | 1.15e-03 | 44 |
| GO:00083609 | Endometrium | AEH | regulation of cell shape | 34/2100 | 154/18723 | 7.85e-05 | 1.18e-03 | 34 |
| GO:005123510 | Endometrium | AEH | maintenance of location | 60/2100 | 327/18723 | 8.19e-05 | 1.22e-03 | 60 |
| GO:003004110 | Endometrium | AEH | actin filament polymerization | 39/2100 | 191/18723 | 1.47e-04 | 1.96e-03 | 39 |
| GO:00109597 | Endometrium | AEH | regulation of metal ion transport | 66/2100 | 406/18723 | 1.24e-03 | 1.07e-02 | 66 |
| GO:19040623 | Endometrium | AEH | regulation of cation transmembrane transport | 55/2100 | 357/18723 | 9.18e-03 | 4.96e-02 | 55 |
| GO:002260416 | Endometrium | EEC | regulation of cell morphogenesis | 78/2168 | 309/18723 | 1.45e-11 | 2.28e-09 | 78 |
| GO:000701517 | Endometrium | EEC | actin filament organization | 95/2168 | 442/18723 | 1.31e-09 | 1.09e-07 | 95 |
| GO:005125817 | Endometrium | EEC | protein polymerization | 63/2168 | 297/18723 | 1.24e-06 | 4.07e-05 | 63 |
| GO:005123515 | Endometrium | EEC | maintenance of location | 62/2168 | 327/18723 | 5.92e-05 | 9.13e-04 | 62 |
| GO:005165117 | Endometrium | EEC | maintenance of location in cell | 44/2168 | 214/18723 | 1.02e-04 | 1.41e-03 | 44 |
| GO:000836014 | Endometrium | EEC | regulation of cell shape | 34/2168 | 154/18723 | 1.47e-04 | 1.87e-03 | 34 |
| GO:000815415 | Endometrium | EEC | actin polymerization or depolymerization | 44/2168 | 218/18723 | 1.59e-04 | 2.00e-03 | 44 |
| GO:003004115 | Endometrium | EEC | actin filament polymerization | 39/2168 | 191/18723 | 2.85e-04 | 3.22e-03 | 39 |
| GO:001095914 | Endometrium | EEC | regulation of metal ion transport | 70/2168 | 406/18723 | 4.12e-04 | 4.35e-03 | 70 |
| GO:005165126 | Esophagus | HGIN | maintenance of location in cell | 53/2587 | 214/18723 | 1.22e-05 | 3.45e-04 | 53 |
| Pathway ID | Tissue | Disease Stage | Description | Gene Ratio | Bg Ratio | pvalue | p.adjust | qvalue | Count |
| hsa0513126 | Endometrium | AEH | Shigellosis | 78/1197 | 247/8465 | 9.23e-13 | 2.00e-11 | 1.46e-11 | 78 |
| hsa0451015 | Endometrium | AEH | Focal adhesion | 58/1197 | 203/8465 | 4.99e-08 | 7.37e-07 | 5.39e-07 | 58 |
| hsa049337 | Endometrium | AEH | AGE-RAGE signaling pathway in diabetic complications | 28/1197 | 100/8465 | 2.11e-04 | 1.80e-03 | 1.32e-03 | 28 |
| hsa0481018 | Endometrium | AEH | Regulation of actin cytoskeleton | 50/1197 | 229/8465 | 9.08e-04 | 5.78e-03 | 4.23e-03 | 50 |
| hsa05131111 | Endometrium | AEH | Shigellosis | 78/1197 | 247/8465 | 9.23e-13 | 2.00e-11 | 1.46e-11 | 78 |
| hsa0451016 | Endometrium | AEH | Focal adhesion | 58/1197 | 203/8465 | 4.99e-08 | 7.37e-07 | 5.39e-07 | 58 |
| hsa0493314 | Endometrium | AEH | AGE-RAGE signaling pathway in diabetic complications | 28/1197 | 100/8465 | 2.11e-04 | 1.80e-03 | 1.32e-03 | 28 |
| hsa0481019 | Endometrium | AEH | Regulation of actin cytoskeleton | 50/1197 | 229/8465 | 9.08e-04 | 5.78e-03 | 4.23e-03 | 50 |
| hsa0513127 | Endometrium | EEC | Shigellosis | 79/1237 | 247/8465 | 1.80e-12 | 3.95e-11 | 2.95e-11 | 79 |
| hsa0451024 | Endometrium | EEC | Focal adhesion | 58/1237 | 203/8465 | 1.61e-07 | 2.30e-06 | 1.71e-06 | 58 |
| hsa0493321 | Endometrium | EEC | AGE-RAGE signaling pathway in diabetic complications | 28/1237 | 100/8465 | 3.68e-04 | 3.03e-03 | 2.26e-03 | 28 |
| hsa0481024 | Endometrium | EEC | Regulation of actin cytoskeleton | 49/1237 | 229/8465 | 3.20e-03 | 1.78e-02 | 1.33e-02 | 49 |
| hsa0513136 | Endometrium | EEC | Shigellosis | 79/1237 | 247/8465 | 1.80e-12 | 3.95e-11 | 2.95e-11 | 79 |
| hsa0451034 | Endometrium | EEC | Focal adhesion | 58/1237 | 203/8465 | 1.61e-07 | 2.30e-06 | 1.71e-06 | 58 |
| hsa0493331 | Endometrium | EEC | AGE-RAGE signaling pathway in diabetic complications | 28/1237 | 100/8465 | 3.68e-04 | 3.03e-03 | 2.26e-03 | 28 |
| hsa0481034 | Endometrium | EEC | Regulation of actin cytoskeleton | 49/1237 | 229/8465 | 3.20e-03 | 1.78e-02 | 1.33e-02 | 49 |
| hsa0513139 | Esophagus | HGIN | Shigellosis | 71/1383 | 247/8465 | 4.89e-07 | 7.98e-06 | 6.34e-06 | 71 |
| hsa05131114 | Esophagus | HGIN | Shigellosis | 71/1383 | 247/8465 | 4.89e-07 | 7.98e-06 | 6.34e-06 | 71 |
| hsa05131211 | Esophagus | ESCC | Shigellosis | 176/4205 | 247/8465 | 2.27e-12 | 4.01e-11 | 2.05e-11 | 176 |
| hsa0493310 | Esophagus | ESCC | AGE-RAGE signaling pathway in diabetic complications | 72/4205 | 100/8465 | 4.15e-06 | 2.28e-05 | 1.17e-05 | 72 |
| Hugo Symbol | Variant Class | Variant Classification | dbSNP RS | HGVSc | HGVSp | HGVSp Short | SWISSPROT | BIOTYPE | SIFT | PolyPhen | Tumor Sample Barcode | Tissue | Histology | Sex | Age | Stage | Therapy Types | Drugs | Outcome |
| DIAPH1 | SNV | Missense_Mutation | | c.791N>T | p.Ser264Phe | p.S264F | O60610 | protein_coding | deleterious(0) | probably_damaging(1) | TCGA-A7-A56D-01 | Breast | breast invasive carcinoma | Female | >=65 | I/II | Hormone Therapy | arimidex | SD |
| DIAPH1 | SNV | Missense_Mutation | rs201927388 | c.890N>T | p.Pro297Leu | p.P297L | O60610 | protein_coding | deleterious(0.01) | probably_damaging(1) | TCGA-A8-A06P-01 | Breast | breast invasive carcinoma | Female | <65 | III/IV | Unspecific | | SD |
| DIAPH1 | SNV | Missense_Mutation | | c.758N>T | p.Pro253Leu | p.P253L | O60610 | protein_coding | deleterious(0) | probably_damaging(1) | TCGA-BH-A0HF-01 | Breast | breast invasive carcinoma | Female | >=65 | I/II | Hormone Therapy | arimidex | SD |
| DIAPH1 | SNV | Missense_Mutation | | c.512N>T | p.Ser171Phe | p.S171F | O60610 | protein_coding | deleterious(0) | probably_damaging(1) | TCGA-BH-A0HF-01 | Breast | breast invasive carcinoma | Female | >=65 | I/II | Hormone Therapy | arimidex | SD |
| DIAPH1 | SNV | Missense_Mutation | | c.2218C>G | p.Pro740Ala | p.P740A | O60610 | protein_coding | tolerated(0.11) | probably_damaging(0.953) | TCGA-D8-A1XW-01 | Breast | breast invasive carcinoma | Female | <65 | I/II | Chemotherapy | adriamycin+cyclophosphamide | SD |
| DIAPH1 | SNV | Missense_Mutation | | c.675N>A | p.Met225Ile | p.M225I | O60610 | protein_coding | deleterious(0) | probably_damaging(0.985) | TCGA-E2-A150-01 | Breast | breast invasive carcinoma | Female | <65 | I/II | Chemotherapy | doxorubicin | SD |
| DIAPH1 | SNV | Missense_Mutation | | c.770N>G | p.Ile257Ser | p.I257S | O60610 | protein_coding | deleterious(0) | probably_damaging(0.989) | TCGA-E2-A1IG-01 | Breast | breast invasive carcinoma | Female | <65 | I/II | Chemotherapy | cyclophosphamide | SD |
| DIAPH1 | SNV | Missense_Mutation | novel | c.3676N>T | p.Gly1226Trp | p.G1226W | O60610 | protein_coding | deleterious(0) | probably_damaging(0.977) | TCGA-OL-A6VO-01 | Breast | breast invasive carcinoma | Female | <65 | I/II | Chemotherapy | taxotere | CR |
| DIAPH1 | deletion | In_Frame_Del | | c.3584_3592delAGACAGGTG | p.Glu1195_Gly1197del | p.E1195_G1197del | O60610 | protein_coding | | | TCGA-A2-A0YC-01 | Breast | breast invasive carcinoma | Female | <65 | I/II | Hormone Therapy | arimidex | PD |
| DIAPH1 | SNV | Missense_Mutation | | c.392C>T | p.Thr131Ile | p.T131I | O60610 | protein_coding | deleterious(0) | probably_damaging(0.997) | TCGA-C5-A2LX-01 | Cervix | cervical & endocervical cancer | Female | <65 | I/II | Chemotherapy | cisplatin | SD |


