
|
|||||
|
 | |
| |
| |
| |
| |
| |
|
Gene: DIABLO |
Gene summary for DIABLO |
| Gene information | Species | Human | Gene symbol | DIABLO | Gene ID | 56616 |
| Gene name | diablo IAP-binding mitochondrial protein | |
| Gene Alias | DFNA64 | |
| Cytomap | 12q24.31 | |
| Gene Type | protein-coding | GO ID | GO:0006508 | UniProtAcc | K7X1S0 |
Top |
Malignant transformation analysis |
| Identification of the aberrant gene expression in precancerous and cancerous lesions by comparing the gene expression of stem-like cells in diseased tissues with normal stem cells |
| Entrez ID | Symbol | Replicates | Species | Organ | Tissue | Adj P-value | Log2FC | Malignancy |
| 56616 | DIABLO | LZE4T | Human | Esophagus | ESCC | 3.18e-05 | 1.77e-01 | 0.0811 |
| 56616 | DIABLO | LZE7T | Human | Esophagus | ESCC | 1.02e-03 | 1.80e-01 | 0.0667 |
| 56616 | DIABLO | LZE8T | Human | Esophagus | ESCC | 1.65e-04 | 1.52e-01 | 0.067 |
| 56616 | DIABLO | LZE20T | Human | Esophagus | ESCC | 4.88e-05 | 1.71e-01 | 0.0662 |
| 56616 | DIABLO | LZE22T | Human | Esophagus | ESCC | 1.54e-04 | 2.36e-01 | 0.068 |
| 56616 | DIABLO | LZE24T | Human | Esophagus | ESCC | 2.47e-19 | 4.00e-01 | 0.0596 |
| 56616 | DIABLO | LZE21T | Human | Esophagus | ESCC | 1.37e-06 | 3.72e-01 | 0.0655 |
| 56616 | DIABLO | LZE6T | Human | Esophagus | ESCC | 5.35e-04 | 1.73e-01 | 0.0845 |
| 56616 | DIABLO | P1T-E | Human | Esophagus | ESCC | 7.17e-16 | 7.08e-01 | 0.0875 |
| 56616 | DIABLO | P2T-E | Human | Esophagus | ESCC | 1.69e-116 | 1.81e+00 | 0.1177 |
| 56616 | DIABLO | P4T-E | Human | Esophagus | ESCC | 1.02e-66 | 1.30e+00 | 0.1323 |
| 56616 | DIABLO | P5T-E | Human | Esophagus | ESCC | 1.41e-52 | 8.59e-01 | 0.1327 |
| 56616 | DIABLO | P8T-E | Human | Esophagus | ESCC | 1.85e-55 | 8.24e-01 | 0.0889 |
| 56616 | DIABLO | P9T-E | Human | Esophagus | ESCC | 4.80e-25 | 4.95e-01 | 0.1131 |
| 56616 | DIABLO | P10T-E | Human | Esophagus | ESCC | 6.99e-51 | 7.82e-01 | 0.116 |
| 56616 | DIABLO | P11T-E | Human | Esophagus | ESCC | 3.33e-42 | 1.13e+00 | 0.1426 |
| 56616 | DIABLO | P12T-E | Human | Esophagus | ESCC | 1.01e-76 | 1.28e+00 | 0.1122 |
| 56616 | DIABLO | P15T-E | Human | Esophagus | ESCC | 5.99e-45 | 8.11e-01 | 0.1149 |
| 56616 | DIABLO | P16T-E | Human | Esophagus | ESCC | 2.02e-60 | 9.92e-01 | 0.1153 |
| 56616 | DIABLO | P17T-E | Human | Esophagus | ESCC | 2.37e-18 | 5.70e-01 | 0.1278 |
| Page: 1 2 3 4 |
| Tissue | Expression Dynamics | Abbreviation |
| Esophagus | 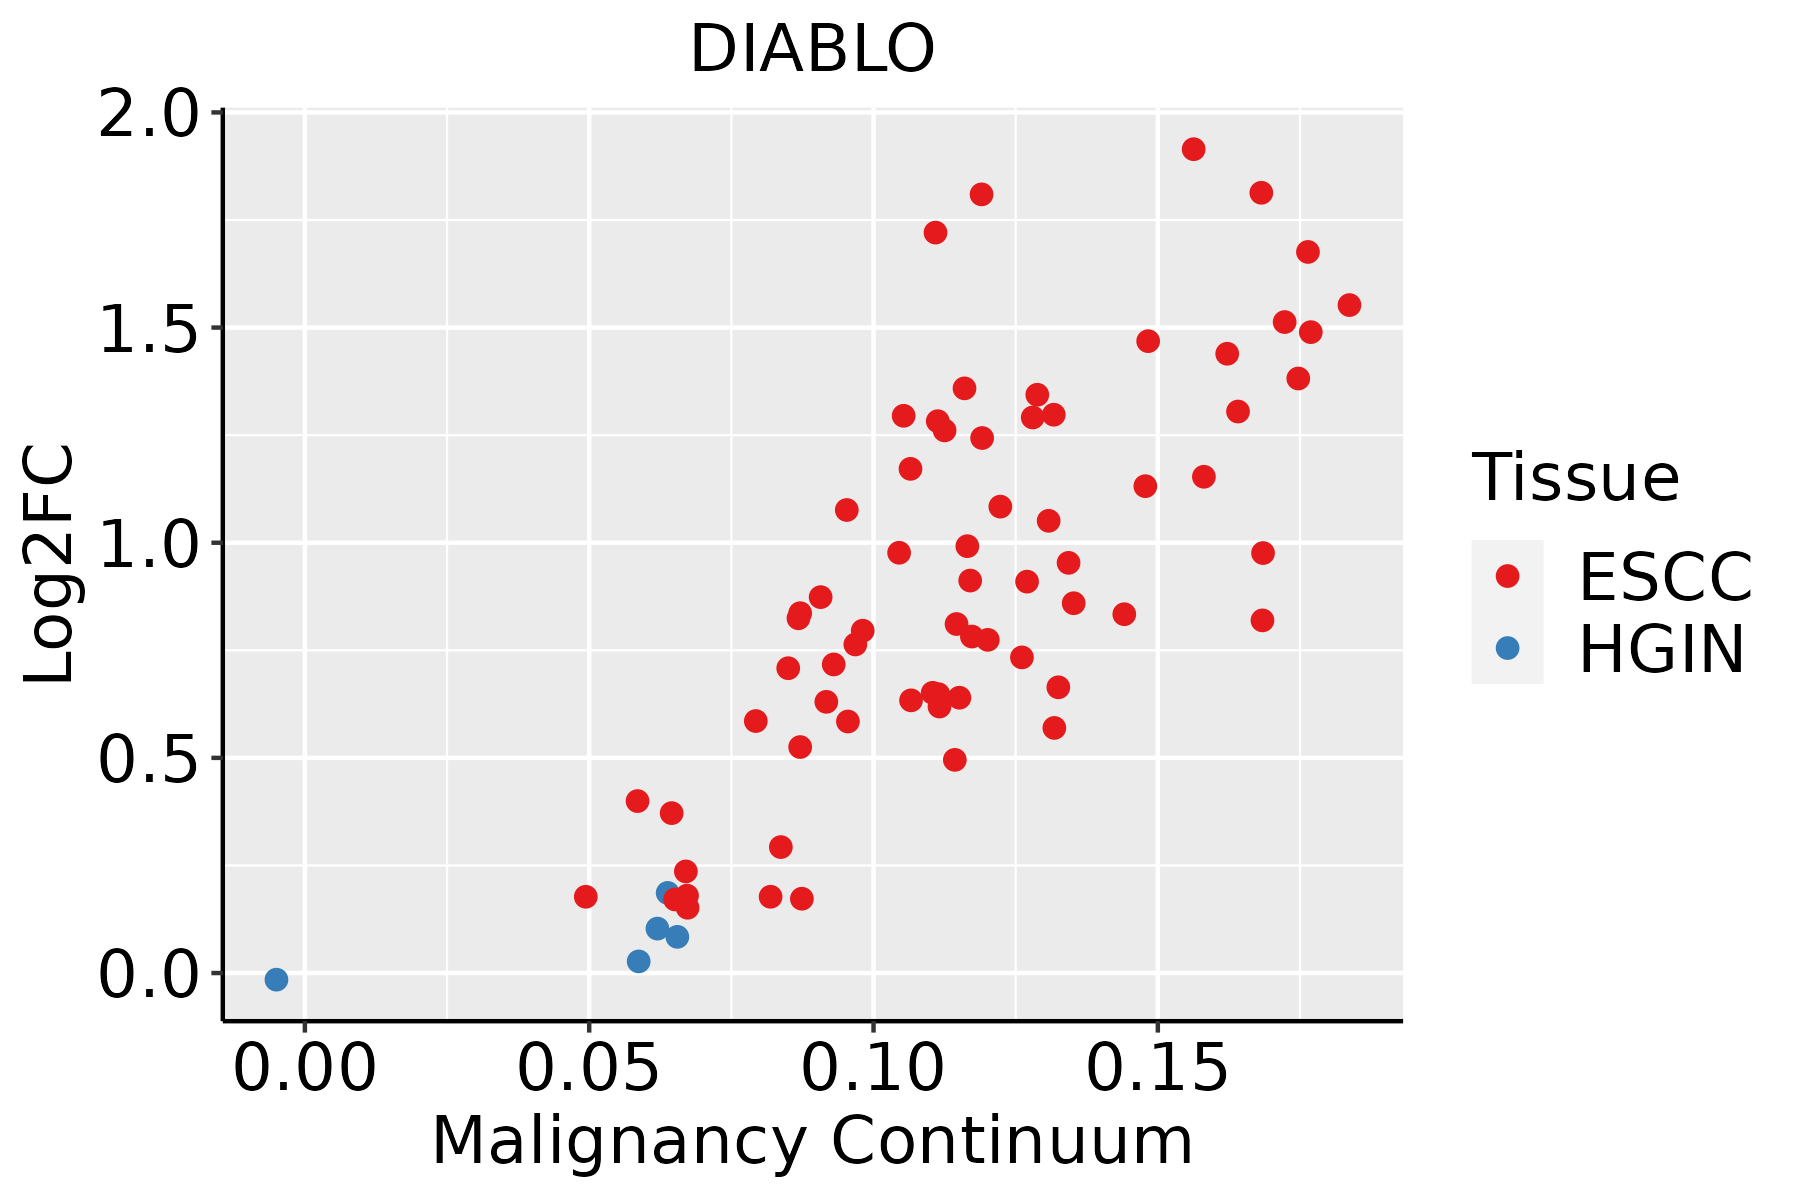 | ESCC: Esophageal squamous cell carcinoma |
| HGIN: High-grade intraepithelial neoplasias | ||
| LGIN: Low-grade intraepithelial neoplasias | ||
| Liver | 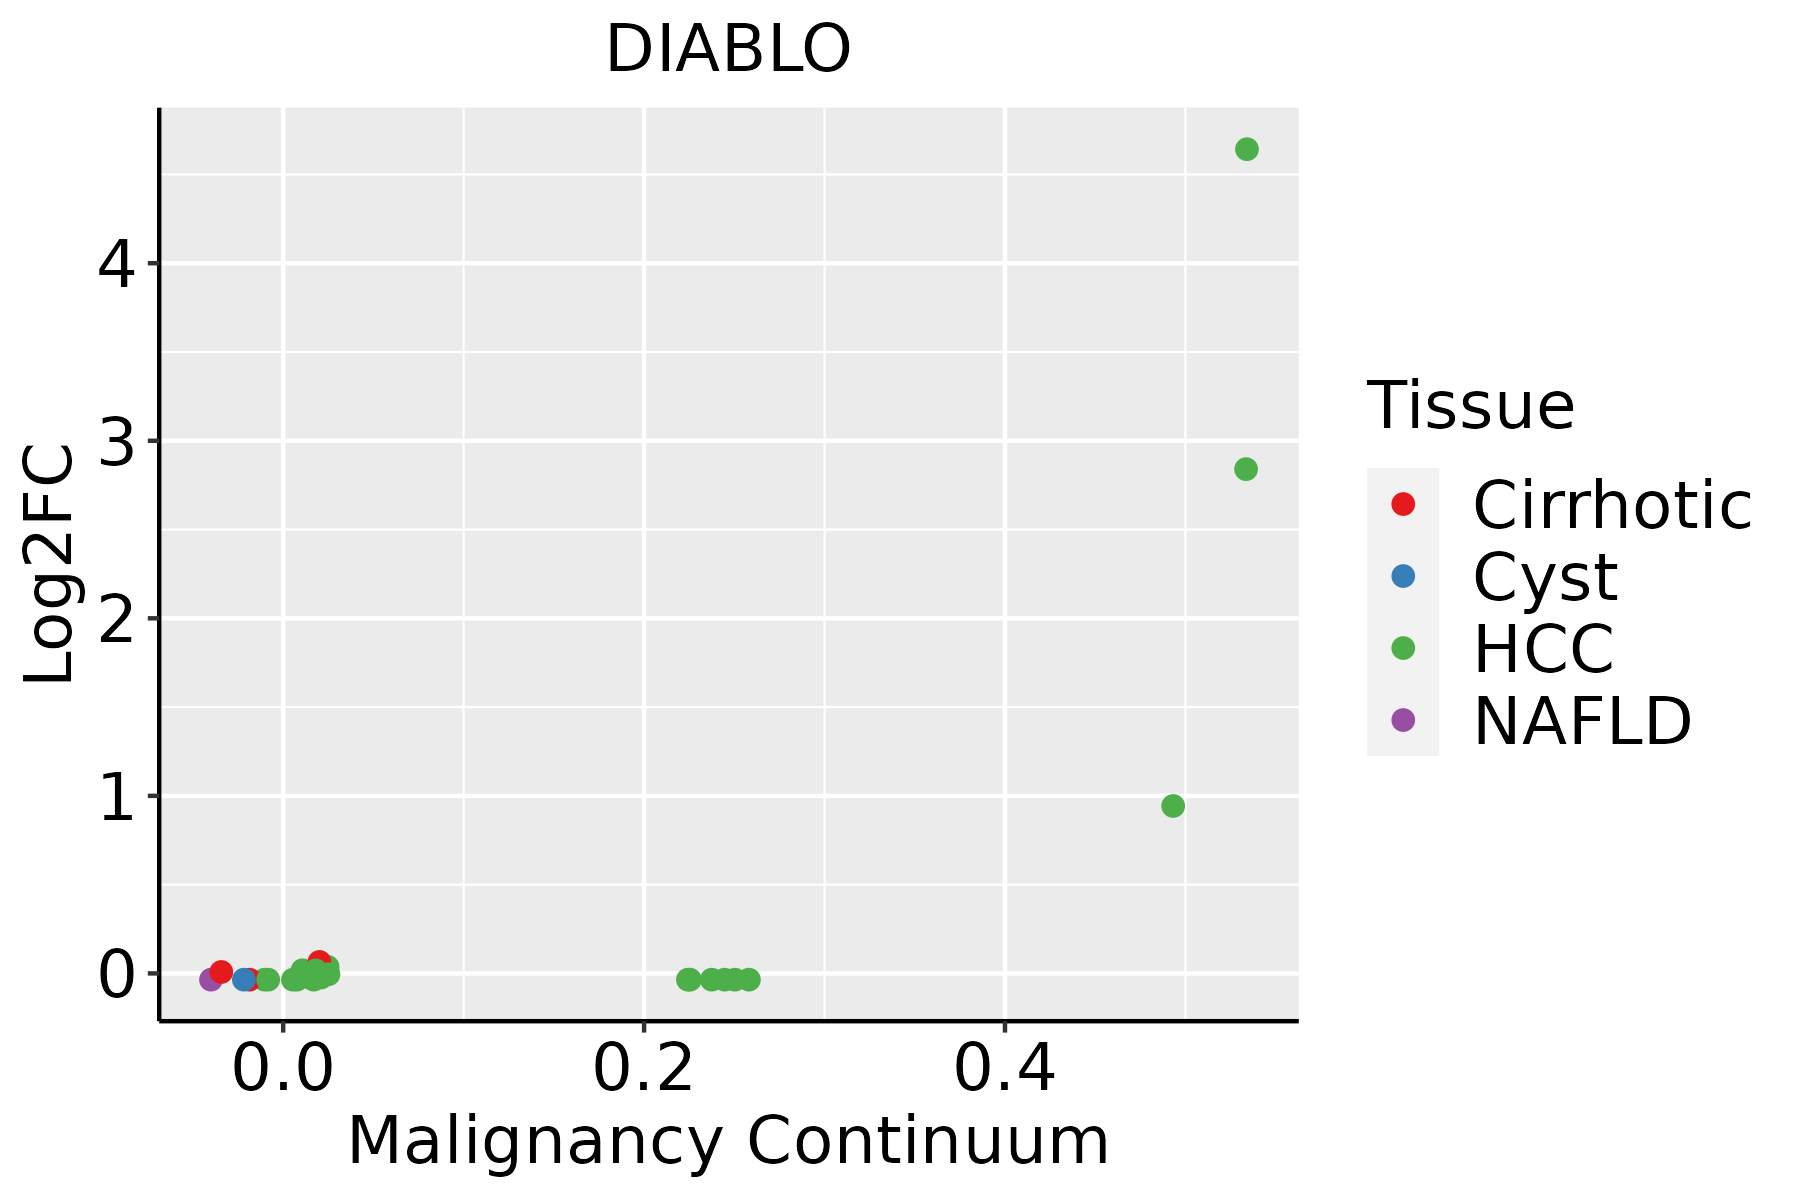 | HCC: Hepatocellular carcinoma |
| NAFLD: Non-alcoholic fatty liver disease |
| ∗log2FC in expression of this searched gene in stem-like cells from each diseased tissue sample relative to stem-like cells in normal samples in each tissue plotted against the malignancy continuum. Samples are colored based on if they are from different disease stage. |
Top |
Malignant transformation related pathway analysis |
| Find out the enriched GO biological processes and KEGG pathways involved in transition from healthy to precancer to cancer |
| Tissue | Disease Stage | Enriched GO biological Processes |
| Colorectum | AD |  |
| Colorectum | SER |  |
| Colorectum | MSS |  |
| Colorectum | MSI-H |  |
| Colorectum | FAP |  |
| ∗Top 15 enriched GO BP terms are showed in the bar plot of each disease state in each tissue. Each row represents a significant GO biological process which is colored according to the -log10(p.adjust). |
| Page: 1 2 3 4 5 6 7 8 9 |
| GO ID | Tissue | Disease Stage | Description | Gene Ratio | Bg Ratio | pvalue | p.adjust | Count |
| GO:0097193111 | Esophagus | ESCC | intrinsic apoptotic signaling pathway | 222/8552 | 288/18723 | 5.87e-28 | 2.02e-25 | 222 |
| GO:0006979111 | Esophagus | ESCC | response to oxidative stress | 303/8552 | 446/18723 | 7.15e-22 | 1.30e-19 | 303 |
| GO:0045862111 | Esophagus | ESCC | positive regulation of proteolysis | 256/8552 | 372/18723 | 7.88e-20 | 9.43e-18 | 256 |
| GO:0062197111 | Esophagus | ESCC | cellular response to chemical stress | 234/8552 | 337/18723 | 5.37e-19 | 5.97e-17 | 234 |
| GO:0097191111 | Esophagus | ESCC | extrinsic apoptotic signaling pathway | 159/8552 | 219/18723 | 4.12e-16 | 2.94e-14 | 159 |
| GO:0034599111 | Esophagus | ESCC | cellular response to oxidative stress | 197/8552 | 288/18723 | 3.76e-15 | 2.15e-13 | 197 |
| GO:2000116111 | Esophagus | ESCC | regulation of cysteine-type endopeptidase activity | 158/8552 | 235/18723 | 1.67e-11 | 5.90e-10 | 158 |
| GO:0043281111 | Esophagus | ESCC | regulation of cysteine-type endopeptidase activity involved in apoptotic process | 143/8552 | 209/18723 | 2.12e-11 | 7.31e-10 | 143 |
| GO:0010952111 | Esophagus | ESCC | positive regulation of peptidase activity | 133/8552 | 197/18723 | 4.31e-10 | 1.14e-08 | 133 |
| GO:0052547111 | Esophagus | ESCC | regulation of peptidase activity | 275/8552 | 461/18723 | 7.54e-10 | 1.88e-08 | 275 |
| GO:0070997111 | Esophagus | ESCC | neuron death | 216/8552 | 361/18723 | 3.49e-08 | 6.45e-07 | 216 |
| GO:0052548111 | Esophagus | ESCC | regulation of endopeptidase activity | 253/8552 | 432/18723 | 3.68e-08 | 6.78e-07 | 253 |
| GO:0008631110 | Esophagus | ESCC | intrinsic apoptotic signaling pathway in response to oxidative stress | 38/8552 | 45/18723 | 8.42e-08 | 1.43e-06 | 38 |
| GO:0010950111 | Esophagus | ESCC | positive regulation of endopeptidase activity | 116/8552 | 179/18723 | 1.77e-07 | 2.79e-06 | 116 |
| GO:000862519 | Esophagus | ESCC | extrinsic apoptotic signaling pathway via death domain receptors | 59/8552 | 82/18723 | 1.23e-06 | 1.52e-05 | 59 |
| GO:0051402110 | Esophagus | ESCC | neuron apoptotic process | 148/8552 | 246/18723 | 3.08e-06 | 3.47e-05 | 148 |
| GO:0043280110 | Esophagus | ESCC | positive regulation of cysteine-type endopeptidase activity involved in apoptotic process | 84/8552 | 129/18723 | 6.38e-06 | 6.55e-05 | 84 |
| GO:2001056110 | Esophagus | ESCC | positive regulation of cysteine-type endopeptidase activity | 94/8552 | 148/18723 | 8.87e-06 | 8.59e-05 | 94 |
| GO:000691915 | Esophagus | ESCC | activation of cysteine-type endopeptidase activity involved in apoptotic process | 54/8552 | 78/18723 | 2.17e-05 | 1.87e-04 | 54 |
| GO:003647320 | Esophagus | ESCC | cell death in response to oxidative stress | 59/8552 | 95/18723 | 9.12e-04 | 4.65e-03 | 59 |
| Page: 1 2 |
| Pathway ID | Tissue | Disease Stage | Description | Gene Ratio | Bg Ratio | pvalue | p.adjust | qvalue | Count |
| hsa0421027 | Esophagus | ESCC | Apoptosis | 102/4205 | 136/8465 | 1.05e-09 | 1.21e-08 | 6.21e-09 | 102 |
| hsa042156 | Esophagus | ESCC | Apoptosis - multiple species | 25/4205 | 32/8465 | 9.13e-04 | 2.92e-03 | 1.49e-03 | 25 |
| hsa0421037 | Esophagus | ESCC | Apoptosis | 102/4205 | 136/8465 | 1.05e-09 | 1.21e-08 | 6.21e-09 | 102 |
| hsa0421511 | Esophagus | ESCC | Apoptosis - multiple species | 25/4205 | 32/8465 | 9.13e-04 | 2.92e-03 | 1.49e-03 | 25 |
| hsa042102 | Liver | HCC | Apoptosis | 83/4020 | 136/8465 | 9.51e-04 | 3.58e-03 | 1.99e-03 | 83 |
| hsa042103 | Liver | HCC | Apoptosis | 83/4020 | 136/8465 | 9.51e-04 | 3.58e-03 | 1.99e-03 | 83 |
| Page: 1 |
Top |
Cell-cell communication analysis |
| Identification of potential cell-cell interactions between two cell types and their ligand-receptor pairs for different disease states |
| Ligand | Receptor | LRpair | Pathway | Tissue | Disease Stage |
| Page: 1 |
Top |
Single-cell gene regulatory network inference analysis |
| Find out the significant the regulons (TFs) and the target genes of each regulon across cell types for different disease states |
| TF | Cell Type | Tissue | Disease Stage | Target Gene | RSS | Regulon Activity |
| DIABLO | PVA | Pancreas | ADJ | SHISA2,UBXN2A,C12orf76, etc. | 2.50e-02 |  |
| DIABLO | MSC | Pancreas | ADJ | SHISA2,UBXN2A,C12orf76, etc. | 0.00e+00 | |
| DIABLO | INCAF | Pancreas | ADJ | SHISA2,UBXN2A,C12orf76, etc. | 0.00e+00 | |
| DIABLO | CAF | Pancreas | ADJ | SHISA2,UBXN2A,C12orf76, etc. | 0.00e+00 | |
| DIABLO | FIB | Pancreas | ADJ | SHISA2,UBXN2A,C12orf76, etc. | 0.00e+00 | |
| DIABLO | ERY | Pancreas | Healthy | SHISA2,UBXN2A,C12orf76, etc. | 0.00e+00 |  |
| DIABLO | APCAF | Pancreas | Healthy | SHISA2,UBXN2A,C12orf76, etc. | 0.00e+00 | |
| DIABLO | MSC | Pancreas | PanIN | SHISA2,UBXN2A,C12orf76, etc. | 0.00e+00 |  |
| DIABLO | CAF | Pancreas | PanIN | SHISA2,UBXN2A,C12orf76, etc. | 0.00e+00 | |
| DIABLO | MEGA | Pancreas | PDAC | SHISA2,UBXN2A,C12orf76, etc. | 0.00e+00 |  |
| ∗The dot plots of a searched regulon are shown for all cell subpopulations in each disease state of each tissue based on the regulon specific score inferred using pySCENIC and by calculating the average expression. |
| Page: 1 2 |
Top |
Somatic mutation of malignant transformation related genes |
| Annotation of somatic variants for genes involved in malignant transformation |
| Hugo Symbol | Variant Class | Variant Classification | dbSNP RS | HGVSc | HGVSp | HGVSp Short | SWISSPROT | BIOTYPE | SIFT | PolyPhen | Tumor Sample Barcode | Tissue | Histology | Sex | Age | Stage | Therapy Types | Drugs | Outcome |
| DIABLO | SNV | Missense_Mutation | rs760073847 | c.545N>A | p.Thr182Asn | p.T182N | Q9NR28 | protein_coding | deleterious(0) | possibly_damaging(0.837) | TCGA-A2-A04N-01 | Breast | breast invasive carcinoma | Female | >=65 | I/II | Chemotherapy | cytoxan | SD |
| DIABLO | SNV | Missense_Mutation | c.490N>C | p.Ser164Pro | p.S164P | Q9NR28 | protein_coding | tolerated(0.07) | probably_damaging(0.985) | TCGA-A2-A0ER-01 | Breast | breast invasive carcinoma | Female | <65 | I/II | Chemotherapy | cytoxan | SD | |
| DIABLO | SNV | Missense_Mutation | rs760073847 | c.545C>A | p.Thr182Asn | p.T182N | Q9NR28 | protein_coding | deleterious(0) | possibly_damaging(0.837) | TCGA-AO-A128-01 | Breast | breast invasive carcinoma | Female | <65 | I/II | Chemotherapy | doxorubicin | SD |
| DIABLO | SNV | Missense_Mutation | rs760073847 | c.545C>A | p.Thr182Asn | p.T182N | Q9NR28 | protein_coding | deleterious(0) | possibly_damaging(0.837) | TCGA-AR-A0TQ-01 | Breast | breast invasive carcinoma | Female | <65 | III/IV | Chemotherapy | doxorubicin | SD |
| DIABLO | SNV | Missense_Mutation | rs762741062 | c.49N>G | p.Arg17Gly | p.R17G | Q9NR28 | protein_coding | tolerated(0.13) | benign(0.438) | TCGA-BH-A18G-01 | Breast | breast invasive carcinoma | Female | >=65 | I/II | Unknown | Unknown | SD |
| DIABLO | SNV | Missense_Mutation | novel | c.643N>A | p.Glu215Lys | p.E215K | Q9NR28 | protein_coding | deleterious(0) | probably_damaging(0.999) | TCGA-C5-A1BF-01 | Cervix | cervical & endocervical cancer | Female | <65 | I/II | Chemotherapy | cisplatin | PD |
| DIABLO | SNV | Missense_Mutation | novel | c.422N>T | p.Ala141Val | p.A141V | Q9NR28 | protein_coding | tolerated(1) | benign(0) | TCGA-EA-A410-01 | Cervix | cervical & endocervical cancer | Female | <65 | I/II | Unknown | Unknown | SD |
| DIABLO | SNV | Missense_Mutation | c.167N>T | p.Ala56Val | p.A56V | Q9NR28 | protein_coding | deleterious(0) | probably_damaging(0.999) | TCGA-EA-A410-01 | Cervix | cervical & endocervical cancer | Female | <65 | I/II | Unknown | Unknown | SD | |
| DIABLO | SNV | Missense_Mutation | c.167C>T | p.Ala56Val | p.A56V | Q9NR28 | protein_coding | deleterious(0) | probably_damaging(0.999) | TCGA-AA-3672-01 | Colorectum | colon adenocarcinoma | Female | >=65 | III/IV | Unknown | Unknown | SD | |
| DIABLO | SNV | Missense_Mutation | c.502N>A | p.Ala168Thr | p.A168T | Q9NR28 | protein_coding | deleterious(0.02) | probably_damaging(1) | TCGA-AA-3715-01 | Colorectum | colon adenocarcinoma | Male | >=65 | I/II | Unknown | Unknown | PD |
| Page: 1 2 3 |
Top |
Related drugs of malignant transformation related genes |
| Identification of chemicals and drugs interact with genes involved in malignant transfromation |
| (DGIdb 4.0) |
| Entrez ID | Symbol | Category | Interaction Types | Drug Claim Name | Drug Name | PMIDs |
| 56616 | DIABLO | NA | CEPHALOSTATIN | 14695204 | ||
| 56616 | DIABLO | NA | RESVERATROL | RESVERATROL | 15837718,15469386 | |
| 56616 | DIABLO | NA | TRAIL | 10950947,12941843,15137068,12670926 | ||
| 56616 | DIABLO | NA | STAUROSPORINE | STAUROSPORINE | 14985459,15466201 | |
| 56616 | DIABLO | NA | PMA | 12920112 | ||
| 56616 | DIABLO | NA | CASPASE INHIBITOR | 12823542,15843890 | ||
| 56616 | DIABLO | NA | UCN-01 | UCN-01 | 12488556 | |
| 56616 | DIABLO | NA | NM-3 | 15574755 | ||
| 56616 | DIABLO | NA | ANTIOXIDANT | 16115949 | ||
| 56616 | DIABLO | NA | HYDROGEN PEROXIDE | 16085184,14987999 |
| Page: 1 2 |

Copyright 2023-Present -The University of Texas Health Science Center at Houston |