
|
|||||
|
 | |
| |
| |
| |
| |
| |
|
Gene: DHX35 |
Gene summary for DHX35 |
| Gene information | Species | Human | Gene symbol | DHX35 | Gene ID | 60625 |
| Gene name | DEAH-box helicase 35 | |
| Gene Alias | C20orf15 | |
| Cytomap | 20q11.23-q12 | |
| Gene Type | protein-coding | GO ID | GO:0000375 | UniProtAcc | Q9H5Z1 |
Top |
Malignant transformation analysis |
| Identification of the aberrant gene expression in precancerous and cancerous lesions by comparing the gene expression of stem-like cells in diseased tissues with normal stem cells |
| Entrez ID | Symbol | Replicates | Species | Organ | Tissue | Adj P-value | Log2FC | Malignancy |
| 60625 | DHX35 | LZE4T | Human | Esophagus | ESCC | 3.99e-06 | 1.54e-01 | 0.0811 |
| 60625 | DHX35 | LZE7T | Human | Esophagus | ESCC | 3.93e-03 | 1.95e-01 | 0.0667 |
| 60625 | DHX35 | LZE20T | Human | Esophagus | ESCC | 4.89e-05 | 1.23e-01 | 0.0662 |
| 60625 | DHX35 | LZE24T | Human | Esophagus | ESCC | 3.71e-14 | 2.20e-01 | 0.0596 |
| 60625 | DHX35 | P1T-E | Human | Esophagus | ESCC | 1.54e-03 | 1.46e-01 | 0.0875 |
| 60625 | DHX35 | P2T-E | Human | Esophagus | ESCC | 2.92e-14 | 2.14e-01 | 0.1177 |
| 60625 | DHX35 | P4T-E | Human | Esophagus | ESCC | 9.57e-10 | 1.84e-01 | 0.1323 |
| 60625 | DHX35 | P5T-E | Human | Esophagus | ESCC | 2.83e-04 | 1.18e-01 | 0.1327 |
| 60625 | DHX35 | P8T-E | Human | Esophagus | ESCC | 8.80e-06 | 1.54e-01 | 0.0889 |
| 60625 | DHX35 | P9T-E | Human | Esophagus | ESCC | 7.36e-03 | 8.91e-02 | 0.1131 |
| 60625 | DHX35 | P10T-E | Human | Esophagus | ESCC | 3.69e-17 | 3.15e-01 | 0.116 |
| 60625 | DHX35 | P11T-E | Human | Esophagus | ESCC | 4.72e-06 | 2.75e-01 | 0.1426 |
| 60625 | DHX35 | P12T-E | Human | Esophagus | ESCC | 1.25e-23 | 5.27e-01 | 0.1122 |
| 60625 | DHX35 | P15T-E | Human | Esophagus | ESCC | 1.14e-19 | 3.32e-01 | 0.1149 |
| 60625 | DHX35 | P16T-E | Human | Esophagus | ESCC | 4.96e-24 | 2.90e-01 | 0.1153 |
| 60625 | DHX35 | P17T-E | Human | Esophagus | ESCC | 3.98e-04 | 1.71e-01 | 0.1278 |
| 60625 | DHX35 | P20T-E | Human | Esophagus | ESCC | 4.14e-07 | 1.59e-01 | 0.1124 |
| 60625 | DHX35 | P21T-E | Human | Esophagus | ESCC | 1.06e-07 | 1.57e-01 | 0.1617 |
| 60625 | DHX35 | P22T-E | Human | Esophagus | ESCC | 1.73e-13 | 2.38e-01 | 0.1236 |
| 60625 | DHX35 | P23T-E | Human | Esophagus | ESCC | 3.45e-20 | 2.09e-01 | 0.108 |
| Page: 1 2 3 |
| Tissue | Expression Dynamics | Abbreviation |
| Esophagus | 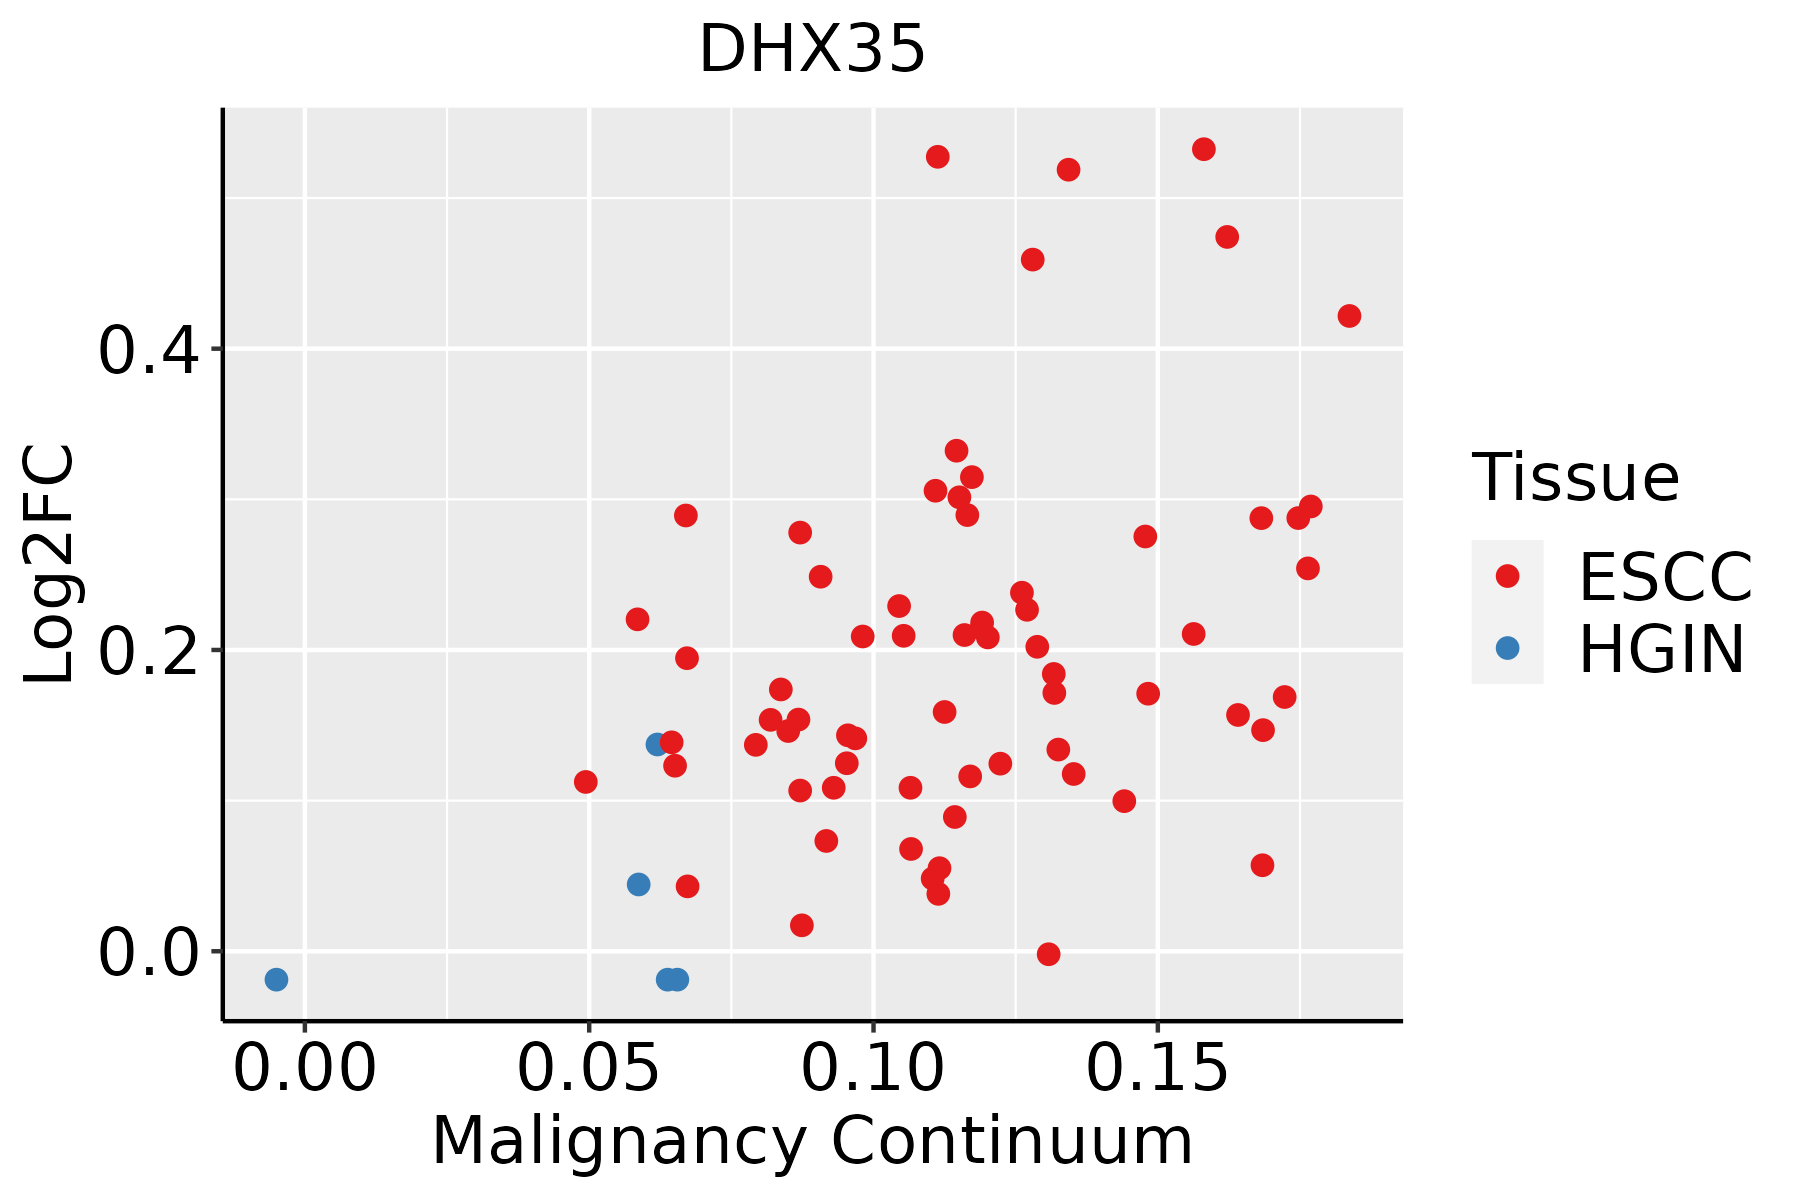 | ESCC: Esophageal squamous cell carcinoma |
| HGIN: High-grade intraepithelial neoplasias | ||
| LGIN: Low-grade intraepithelial neoplasias |
| ∗log2FC in expression of this searched gene in stem-like cells from each diseased tissue sample relative to stem-like cells in normal samples in each tissue plotted against the malignancy continuum. Samples are colored based on if they are from different disease stage. |
Top |
Malignant transformation related pathway analysis |
| Find out the enriched GO biological processes and KEGG pathways involved in transition from healthy to precancer to cancer |
| Tissue | Disease Stage | Enriched GO biological Processes |
| Colorectum | AD |  |
| Colorectum | SER |  |
| Colorectum | MSS |  |
| Colorectum | MSI-H |  |
| Colorectum | FAP |  |
| ∗Top 15 enriched GO BP terms are showed in the bar plot of each disease state in each tissue. Each row represents a significant GO biological process which is colored according to the -log10(p.adjust). |
| Page: 1 2 3 4 5 6 7 8 9 |
| GO ID | Tissue | Disease Stage | Description | Gene Ratio | Bg Ratio | pvalue | p.adjust | Count |
| GO:0008380111 | Esophagus | ESCC | RNA splicing | 336/8552 | 434/18723 | 1.74e-42 | 3.67e-39 | 336 |
| GO:0000375111 | Esophagus | ESCC | RNA splicing, via transesterification reactions | 248/8552 | 324/18723 | 3.05e-30 | 1.49e-27 | 248 |
| GO:0000377111 | Esophagus | ESCC | RNA splicing, via transesterification reactions with bulged adenosine as nucleophile | 244/8552 | 320/18723 | 2.52e-29 | 1.07e-26 | 244 |
| GO:0000398111 | Esophagus | ESCC | mRNA splicing, via spliceosome | 244/8552 | 320/18723 | 2.52e-29 | 1.07e-26 | 244 |
| GO:000170119 | Esophagus | ESCC | in utero embryonic development | 243/8552 | 367/18723 | 1.00e-15 | 6.86e-14 | 243 |
| Page: 1 |
| Pathway ID | Tissue | Disease Stage | Description | Gene Ratio | Bg Ratio | pvalue | p.adjust | qvalue | Count |
| Page: 1 |
Top |
Cell-cell communication analysis |
| Identification of potential cell-cell interactions between two cell types and their ligand-receptor pairs for different disease states |
| Ligand | Receptor | LRpair | Pathway | Tissue | Disease Stage |
| Page: 1 |
Top |
Single-cell gene regulatory network inference analysis |
| Find out the significant the regulons (TFs) and the target genes of each regulon across cell types for different disease states |
| TF | Cell Type | Tissue | Disease Stage | Target Gene | RSS | Regulon Activity |
| ∗The dot plots of a searched regulon are shown for all cell subpopulations in each disease state of each tissue based on the regulon specific score inferred using pySCENIC and by calculating the average expression. |
| Page: 1 |
Top |
Somatic mutation of malignant transformation related genes |
| Annotation of somatic variants for genes involved in malignant transformation |
| Hugo Symbol | Variant Class | Variant Classification | dbSNP RS | HGVSc | HGVSp | HGVSp Short | SWISSPROT | BIOTYPE | SIFT | PolyPhen | Tumor Sample Barcode | Tissue | Histology | Sex | Age | Stage | Therapy Types | Drugs | Outcome |
| DHX35 | SNV | Missense_Mutation | c.741C>G | p.Ile247Met | p.I247M | Q9H5Z1 | protein_coding | deleterious(0.03) | possibly_damaging(0.581) | TCGA-AC-A23H-01 | Breast | breast invasive carcinoma | Female | >=65 | I/II | Unknown | Unknown | PD | |
| DHX35 | SNV | Missense_Mutation | c.994T>C | p.Ser332Pro | p.S332P | Q9H5Z1 | protein_coding | tolerated(1) | benign(0.003) | TCGA-D8-A1XQ-01 | Breast | breast invasive carcinoma | Female | >=65 | I/II | Unknown | Unknown | SD | |
| DHX35 | SNV | Missense_Mutation | novel | c.689N>T | p.Arg230Met | p.R230M | Q9H5Z1 | protein_coding | tolerated(0.05) | benign(0.087) | TCGA-2W-A8YY-01 | Cervix | cervical & endocervical cancer | Female | <65 | I/II | Chemotherapy | cisplatin | CR |
| DHX35 | SNV | Missense_Mutation | rs149661086 | c.1607N>A | p.Arg536His | p.R536H | Q9H5Z1 | protein_coding | deleterious(0.02) | benign(0.12) | TCGA-2W-A8YY-01 | Cervix | cervical & endocervical cancer | Female | <65 | I/II | Chemotherapy | cisplatin | CR |
| DHX35 | SNV | Missense_Mutation | novel | c.454N>G | p.Leu152Val | p.L152V | Q9H5Z1 | protein_coding | tolerated(0.15) | benign(0.01) | TCGA-C5-A8XH-01 | Cervix | cervical & endocervical cancer | Female | <65 | I/II | Unknown | Unknown | SD |
| DHX35 | SNV | Missense_Mutation | c.391N>A | p.Glu131Lys | p.E131K | Q9H5Z1 | protein_coding | deleterious(0.04) | possibly_damaging(0.825) | TCGA-C5-A8XJ-01 | Cervix | cervical & endocervical cancer | Female | >=65 | I/II | Chemotherapy | cisplatin | SD | |
| DHX35 | SNV | Missense_Mutation | novel | c.1845N>A | p.Phe615Leu | p.F615L | Q9H5Z1 | protein_coding | deleterious(0) | probably_damaging(0.998) | TCGA-MY-A5BF-01 | Cervix | cervical & endocervical cancer | Female | >=65 | I/II | Chemotherapy | cisplatin | CR |
| DHX35 | SNV | Missense_Mutation | novel | c.1943N>G | p.Lys648Arg | p.K648R | Q9H5Z1 | protein_coding | tolerated(0.12) | benign(0.012) | TCGA-AA-3811-01 | Colorectum | colon adenocarcinoma | Female | >=65 | III/IV | Unknown | Unknown | PD |
| DHX35 | SNV | Missense_Mutation | novel | c.1657N>A | p.Glu553Lys | p.E553K | Q9H5Z1 | protein_coding | tolerated(0.74) | benign(0.011) | TCGA-AA-3819-01 | Colorectum | colon adenocarcinoma | Female | <65 | I/II | Unknown | Unknown | SD |
| DHX35 | SNV | Missense_Mutation | rs138301896 | c.1192N>T | p.Arg398Cys | p.R398C | Q9H5Z1 | protein_coding | deleterious(0.03) | probably_damaging(0.963) | TCGA-AA-3864-01 | Colorectum | colon adenocarcinoma | Male | >=65 | I/II | Unknown | Unknown | SD |
| Page: 1 2 3 4 5 6 7 8 |
Top |
Related drugs of malignant transformation related genes |
| Identification of chemicals and drugs interact with genes involved in malignant transfromation |
| (DGIdb 4.0) |
| Entrez ID | Symbol | Category | Interaction Types | Drug Claim Name | Drug Name | PMIDs |
| Page: 1 |

Copyright 2023-Present -The University of Texas Health Science Center at Houston |