
|
|||||
|
 | |
| |
| |
| |
| |
| |
|
Gene: DHX33 |
Gene summary for DHX33 |
| Gene information | Species | Human | Gene symbol | DHX33 | Gene ID | 56919 |
| Gene name | DEAH-box helicase 33 | |
| Gene Alias | DDX33 | |
| Cytomap | 17p13.2 | |
| Gene Type | protein-coding | GO ID | GO:0000165 | UniProtAcc | B4DIS6 |
Top |
Malignant transformation analysis |
| Identification of the aberrant gene expression in precancerous and cancerous lesions by comparing the gene expression of stem-like cells in diseased tissues with normal stem cells |
| Entrez ID | Symbol | Replicates | Species | Organ | Tissue | Adj P-value | Log2FC | Malignancy |
| 56919 | DHX33 | LZE2T | Human | Esophagus | ESCC | 1.37e-04 | 3.96e-01 | 0.082 |
| 56919 | DHX33 | LZE4T | Human | Esophagus | ESCC | 2.52e-03 | 9.39e-02 | 0.0811 |
| 56919 | DHX33 | LZE7T | Human | Esophagus | ESCC | 2.20e-04 | 3.73e-01 | 0.0667 |
| 56919 | DHX33 | LZE21D1 | Human | Esophagus | HGIN | 1.62e-04 | 1.78e-01 | 0.0632 |
| 56919 | DHX33 | LZE24T | Human | Esophagus | ESCC | 2.08e-06 | 1.79e-01 | 0.0596 |
| 56919 | DHX33 | LZE21T | Human | Esophagus | ESCC | 3.99e-02 | 2.03e-01 | 0.0655 |
| 56919 | DHX33 | P1T-E | Human | Esophagus | ESCC | 1.55e-08 | 3.29e-01 | 0.0875 |
| 56919 | DHX33 | P2T-E | Human | Esophagus | ESCC | 3.79e-21 | 3.08e-01 | 0.1177 |
| 56919 | DHX33 | P4T-E | Human | Esophagus | ESCC | 1.98e-08 | 3.19e-01 | 0.1323 |
| 56919 | DHX33 | P5T-E | Human | Esophagus | ESCC | 9.67e-05 | 1.79e-02 | 0.1327 |
| 56919 | DHX33 | P8T-E | Human | Esophagus | ESCC | 3.75e-14 | 1.32e-01 | 0.0889 |
| 56919 | DHX33 | P9T-E | Human | Esophagus | ESCC | 5.14e-13 | 3.87e-01 | 0.1131 |
| 56919 | DHX33 | P10T-E | Human | Esophagus | ESCC | 3.21e-24 | 3.58e-01 | 0.116 |
| 56919 | DHX33 | P11T-E | Human | Esophagus | ESCC | 1.14e-04 | 8.89e-02 | 0.1426 |
| 56919 | DHX33 | P12T-E | Human | Esophagus | ESCC | 1.61e-17 | 2.80e-01 | 0.1122 |
| 56919 | DHX33 | P15T-E | Human | Esophagus | ESCC | 1.57e-07 | 1.97e-01 | 0.1149 |
| 56919 | DHX33 | P16T-E | Human | Esophagus | ESCC | 3.21e-19 | 4.25e-01 | 0.1153 |
| 56919 | DHX33 | P20T-E | Human | Esophagus | ESCC | 2.13e-15 | 1.37e-01 | 0.1124 |
| 56919 | DHX33 | P21T-E | Human | Esophagus | ESCC | 1.49e-15 | 3.63e-01 | 0.1617 |
| 56919 | DHX33 | P22T-E | Human | Esophagus | ESCC | 1.57e-17 | 2.71e-01 | 0.1236 |
| Page: 1 2 3 4 |
| Tissue | Expression Dynamics | Abbreviation |
| Esophagus |  | ESCC: Esophageal squamous cell carcinoma |
| HGIN: High-grade intraepithelial neoplasias | ||
| LGIN: Low-grade intraepithelial neoplasias | ||
| Liver | 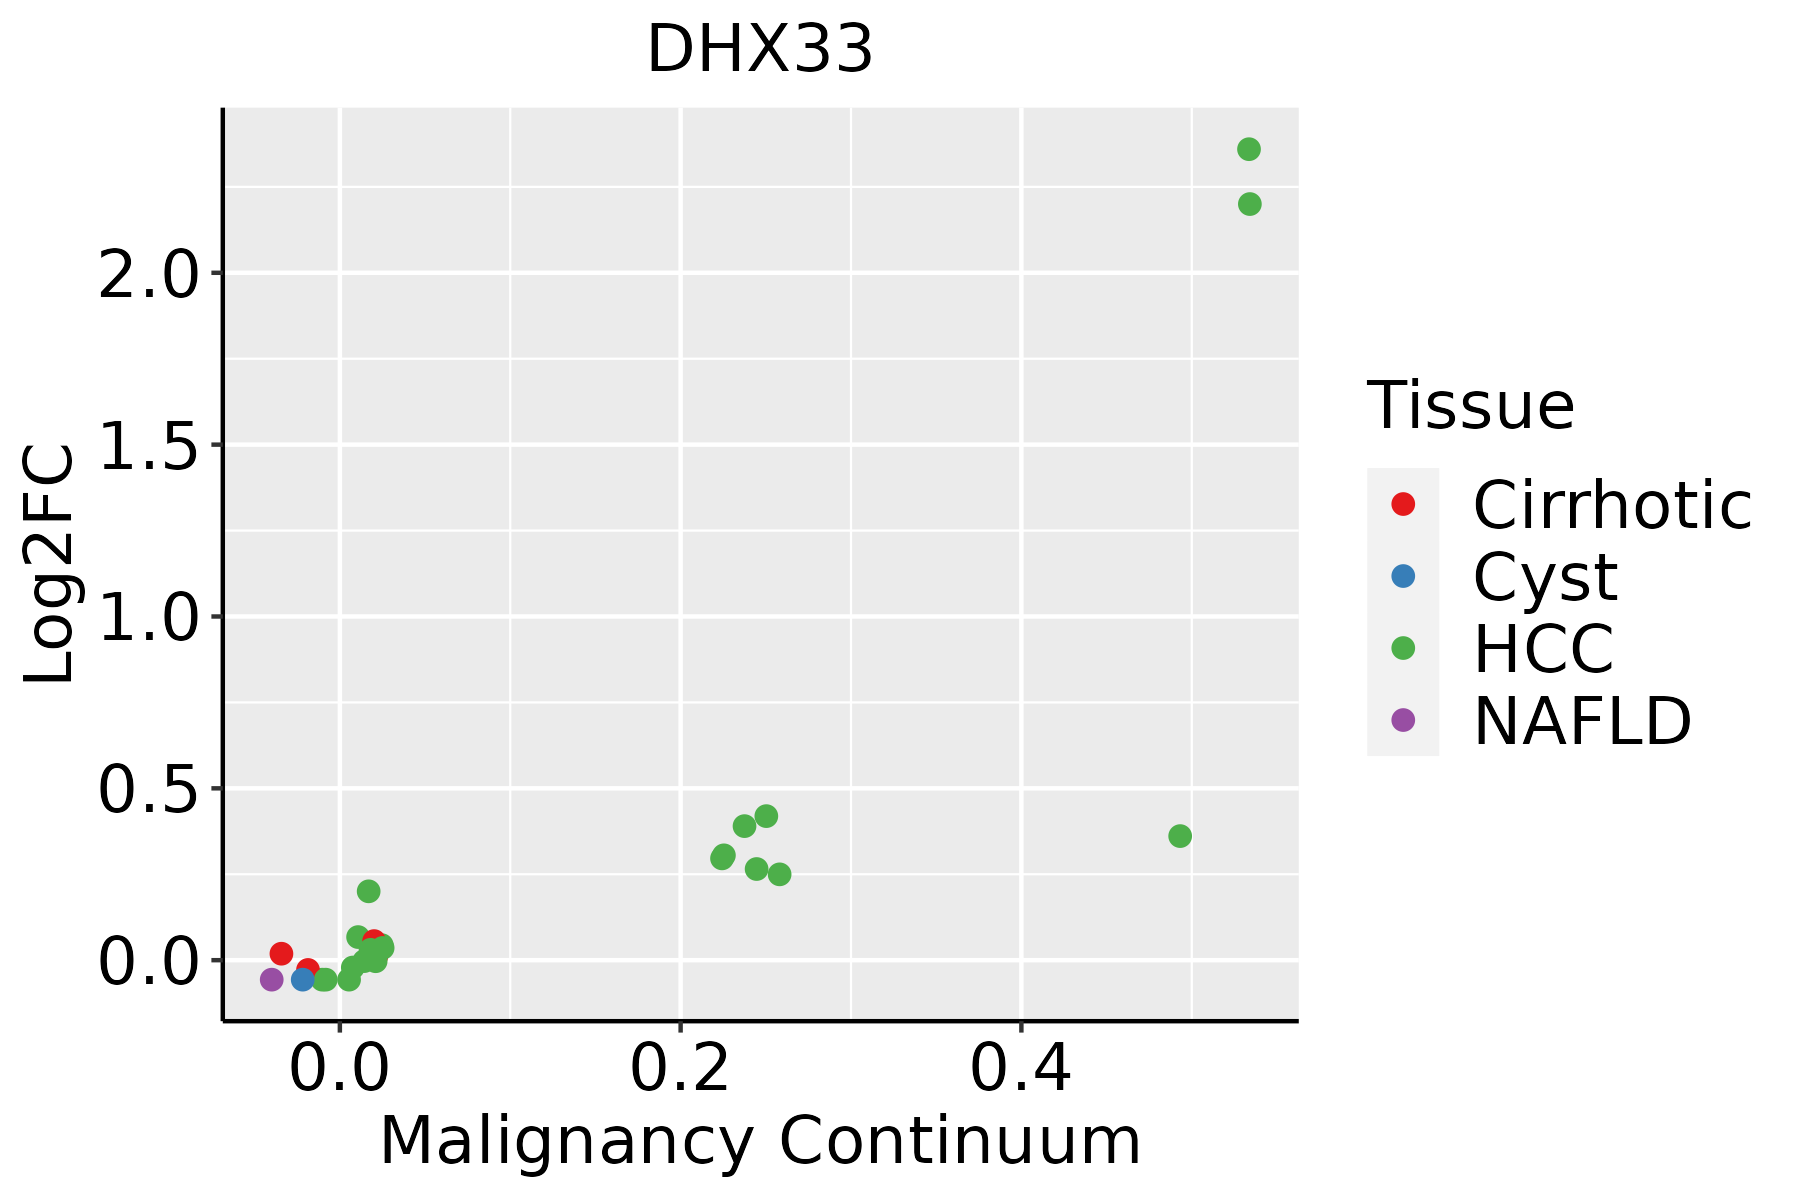 | HCC: Hepatocellular carcinoma |
| NAFLD: Non-alcoholic fatty liver disease | ||
| Thyroid | 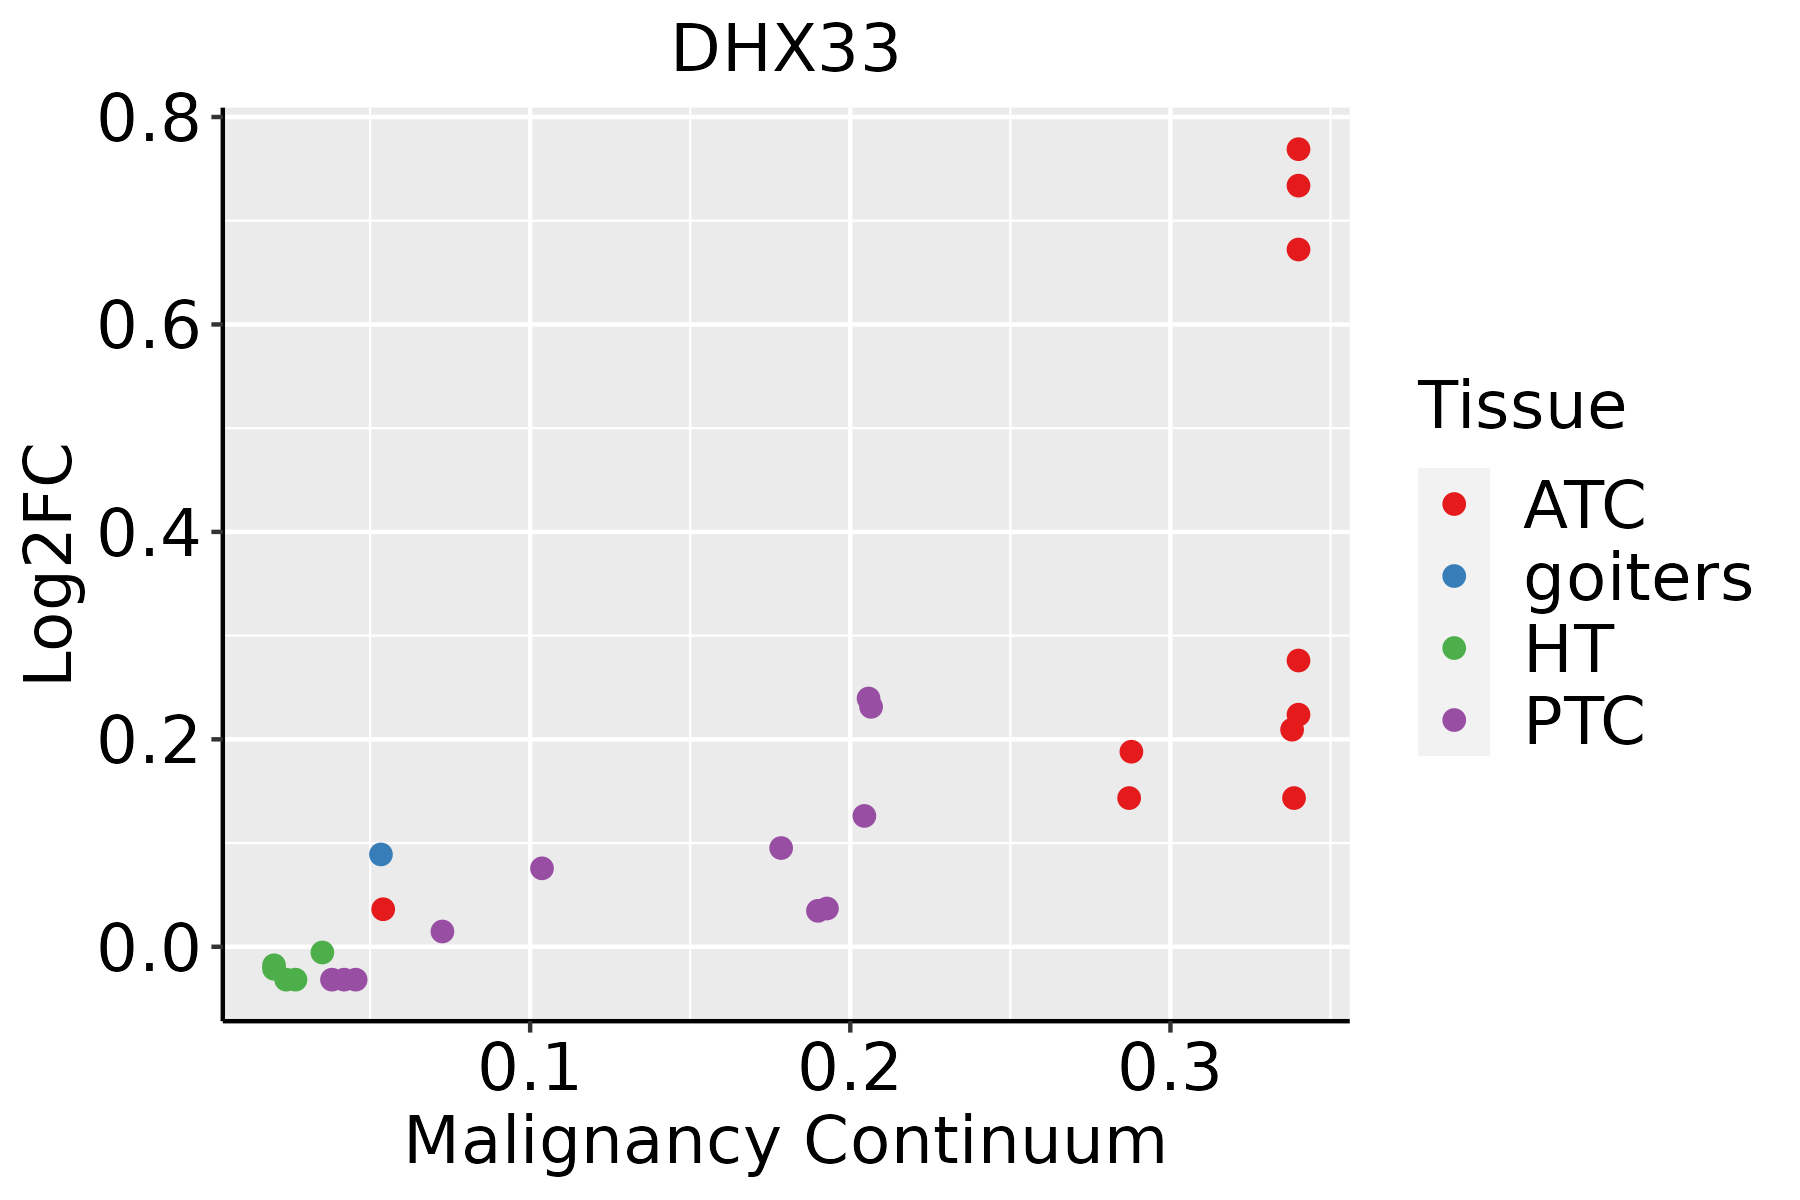 | ATC: Anaplastic thyroid cancer |
| HT: Hashimoto's thyroiditis | ||
| PTC: Papillary thyroid cancer |
| ∗log2FC in expression of this searched gene in stem-like cells from each diseased tissue sample relative to stem-like cells in normal samples in each tissue plotted against the malignancy continuum. Samples are colored based on if they are from different disease stage. |
Top |
Malignant transformation related pathway analysis |
| Find out the enriched GO biological processes and KEGG pathways involved in transition from healthy to precancer to cancer |
| Tissue | Disease Stage | Enriched GO biological Processes |
| Colorectum | AD |  |
| Colorectum | SER |  |
| Colorectum | MSS |  |
| Colorectum | MSI-H |  |
| Colorectum | FAP |  |
| ∗Top 15 enriched GO BP terms are showed in the bar plot of each disease state in each tissue. Each row represents a significant GO biological process which is colored according to the -log10(p.adjust). |
| Page: 1 2 3 4 5 6 7 8 9 |
| GO ID | Tissue | Disease Stage | Description | Gene Ratio | Bg Ratio | pvalue | p.adjust | Count |
| GO:000641320 | Esophagus | HGIN | translational initiation | 55/2587 | 118/18723 | 7.33e-18 | 2.31e-15 | 55 |
| GO:003133425 | Esophagus | HGIN | positive regulation of protein-containing complex assembly | 61/2587 | 237/18723 | 7.10e-07 | 3.00e-05 | 61 |
| GO:004325427 | Esophagus | HGIN | regulation of protein-containing complex assembly | 94/2587 | 428/18723 | 2.39e-06 | 8.55e-05 | 94 |
| GO:00324817 | Esophagus | HGIN | positive regulation of type I interferon production | 16/2587 | 58/18723 | 4.35e-03 | 3.84e-02 | 16 |
| GO:00324794 | Esophagus | HGIN | regulation of type I interferon production | 23/2587 | 95/18723 | 4.51e-03 | 3.93e-02 | 23 |
| GO:00326064 | Esophagus | HGIN | type I interferon production | 23/2587 | 95/18723 | 4.51e-03 | 3.93e-02 | 23 |
| GO:0006413110 | Esophagus | ESCC | translational initiation | 100/8552 | 118/18723 | 1.16e-18 | 1.25e-16 | 100 |
| GO:0043254111 | Esophagus | ESCC | regulation of protein-containing complex assembly | 278/8552 | 428/18723 | 3.81e-16 | 2.77e-14 | 278 |
| GO:0031334111 | Esophagus | ESCC | positive regulation of protein-containing complex assembly | 166/8552 | 237/18723 | 2.06e-14 | 1.07e-12 | 166 |
| GO:00510908 | Esophagus | ESCC | regulation of DNA-binding transcription factor activity | 252/8552 | 440/18723 | 5.22e-07 | 6.97e-06 | 252 |
| GO:00063602 | Esophagus | ESCC | transcription by RNA polymerase I | 42/8552 | 55/18723 | 3.41e-06 | 3.78e-05 | 42 |
| GO:00510918 | Esophagus | ESCC | positive regulation of DNA-binding transcription factor activity | 155/8552 | 260/18723 | 3.83e-06 | 4.14e-05 | 155 |
| GO:003248112 | Esophagus | ESCC | positive regulation of type I interferon production | 42/8552 | 58/18723 | 3.27e-05 | 2.70e-04 | 42 |
| GO:00063564 | Esophagus | ESCC | regulation of transcription by RNA polymerase I | 27/8552 | 34/18723 | 6.01e-05 | 4.62e-04 | 27 |
| GO:003247912 | Esophagus | ESCC | regulation of type I interferon production | 61/8552 | 95/18723 | 2.05e-04 | 1.29e-03 | 61 |
| GO:003260612 | Esophagus | ESCC | type I interferon production | 61/8552 | 95/18723 | 2.05e-04 | 1.29e-03 | 61 |
| GO:00510926 | Esophagus | ESCC | positive regulation of NF-kappaB transcription factor activity | 91/8552 | 152/18723 | 2.91e-04 | 1.75e-03 | 91 |
| GO:00459432 | Esophagus | ESCC | positive regulation of transcription by RNA polymerase I | 19/8552 | 23/18723 | 3.12e-04 | 1.85e-03 | 19 |
| GO:000181916 | Esophagus | ESCC | positive regulation of cytokine production | 244/8552 | 467/18723 | 2.29e-03 | 1.01e-02 | 244 |
| GO:000641322 | Liver | HCC | translational initiation | 94/7958 | 118/18723 | 1.39e-16 | 1.24e-14 | 94 |
| Page: 1 2 3 |
| Pathway ID | Tissue | Disease Stage | Description | Gene Ratio | Bg Ratio | pvalue | p.adjust | qvalue | Count |
| hsa046219 | Esophagus | HGIN | NOD-like receptor signaling pathway | 45/1383 | 186/8465 | 3.40e-03 | 2.54e-02 | 2.02e-02 | 45 |
| hsa0462114 | Esophagus | HGIN | NOD-like receptor signaling pathway | 45/1383 | 186/8465 | 3.40e-03 | 2.54e-02 | 2.02e-02 | 45 |
| hsa0462122 | Esophagus | ESCC | NOD-like receptor signaling pathway | 116/4205 | 186/8465 | 2.90e-04 | 1.03e-03 | 5.30e-04 | 116 |
| hsa0462132 | Esophagus | ESCC | NOD-like receptor signaling pathway | 116/4205 | 186/8465 | 2.90e-04 | 1.03e-03 | 5.30e-04 | 116 |
| Page: 1 |
Top |
Cell-cell communication analysis |
| Identification of potential cell-cell interactions between two cell types and their ligand-receptor pairs for different disease states |
| Ligand | Receptor | LRpair | Pathway | Tissue | Disease Stage |
| Page: 1 |
Top |
Single-cell gene regulatory network inference analysis |
| Find out the significant the regulons (TFs) and the target genes of each regulon across cell types for different disease states |
| TF | Cell Type | Tissue | Disease Stage | Target Gene | RSS | Regulon Activity |
| ∗The dot plots of a searched regulon are shown for all cell subpopulations in each disease state of each tissue based on the regulon specific score inferred using pySCENIC and by calculating the average expression. |
| Page: 1 |
Top |
Somatic mutation of malignant transformation related genes |
| Annotation of somatic variants for genes involved in malignant transformation |
| Hugo Symbol | Variant Class | Variant Classification | dbSNP RS | HGVSc | HGVSp | HGVSp Short | SWISSPROT | BIOTYPE | SIFT | PolyPhen | Tumor Sample Barcode | Tissue | Histology | Sex | Age | Stage | Therapy Types | Drugs | Outcome |
| DHX33 | insertion | In_Frame_Ins | novel | c.1191_1192insGTCTCC | p.Thr397_Gln398insValSer | p.T397_Q398insVS | Q9H6R0 | protein_coding | TCGA-BH-A0HF-01 | Breast | breast invasive carcinoma | Female | >=65 | I/II | Hormone Therapy | arimidex | SD | ||
| DHX33 | insertion | Nonsense_Mutation | novel | c.1189_1190insACTCCTGACCTAGGTGGTCCGCCCACCT | p.Thr397AsnfsTer3 | p.T397Nfs*3 | Q9H6R0 | protein_coding | TCGA-BH-A0HF-01 | Breast | breast invasive carcinoma | Female | >=65 | I/II | Hormone Therapy | arimidex | SD | ||
| DHX33 | deletion | Frame_Shift_Del | novel | c.1972delN | p.Leu658SerfsTer28 | p.L658Sfs*28 | Q9H6R0 | protein_coding | TCGA-D8-A27V-01 | Breast | breast invasive carcinoma | Female | <65 | I/II | Hormone Therapy | tamoxiphen | SD | ||
| DHX33 | deletion | Frame_Shift_Del | novel | c.545delN | p.Asp182AlafsTer29 | p.D182Afs*29 | Q9H6R0 | protein_coding | TCGA-D8-A27V-01 | Breast | breast invasive carcinoma | Female | <65 | I/II | Hormone Therapy | tamoxiphen | SD | ||
| DHX33 | SNV | Missense_Mutation | c.998N>G | p.Tyr333Cys | p.Y333C | Q9H6R0 | protein_coding | tolerated(0.09) | possibly_damaging(0.796) | TCGA-BI-A0VR-01 | Cervix | cervical & endocervical cancer | Female | <65 | III/IV | Unknown | Unknown | SD | |
| DHX33 | SNV | Missense_Mutation | rs368918561 | c.1600N>A | p.Val534Ile | p.V534I | Q9H6R0 | protein_coding | tolerated(0.7) | benign(0.03) | TCGA-EA-A410-01 | Cervix | cervical & endocervical cancer | Female | <65 | I/II | Unknown | Unknown | SD |
| DHX33 | SNV | Missense_Mutation | rs775512646 | c.977N>T | p.Pro326Leu | p.P326L | Q9H6R0 | protein_coding | deleterious(0.02) | possibly_damaging(0.861) | TCGA-EK-A2RC-01 | Cervix | cervical & endocervical cancer | Female | <65 | I/II | Unknown | Unknown | SD |
| DHX33 | SNV | Missense_Mutation | c.434N>T | p.Thr145Ile | p.T145I | Q9H6R0 | protein_coding | deleterious(0.05) | possibly_damaging(0.459) | TCGA-AD-6889-01 | Colorectum | colon adenocarcinoma | Male | >=65 | I/II | Chemotherapy | xeloda | PD | |
| DHX33 | SNV | Missense_Mutation | novel | c.145N>T | p.Arg49Trp | p.R49W | Q9H6R0 | protein_coding | deleterious(0.01) | benign(0) | TCGA-AZ-4315-01 | Colorectum | colon adenocarcinoma | Male | <65 | I/II | Unknown | Unknown | SD |
| DHX33 | SNV | Missense_Mutation | rs745955062 | c.1769C>T | p.Thr590Met | p.T590M | Q9H6R0 | protein_coding | tolerated(0.22) | benign(0.001) | TCGA-AZ-4614-01 | Colorectum | colon adenocarcinoma | Female | >=65 | I/II | Unknown | Unknown | PD |
| Page: 1 2 3 4 5 |
Top |
Related drugs of malignant transformation related genes |
| Identification of chemicals and drugs interact with genes involved in malignant transfromation |
| (DGIdb 4.0) |
| Entrez ID | Symbol | Category | Interaction Types | Drug Claim Name | Drug Name | PMIDs |
| Page: 1 |

Copyright 2023-Present -The University of Texas Health Science Center at Houston |