Schematic overview of the cellular and molecular mechanisms involved in the cancer progression, including the proposed cellular and molecular mechanisms in cancer cells trajectory. AT1: alveolar type 1 cells; AT2: alveolar type 2 cells; AAH: atypical adenomatous hyperplasia; AIS: adenocarcinoma in situ; MIA: minimally invasive adenocarcinoma; IA: invasive adenocarcinoma; EMT: epithelial-mesenchymal transition

Home

Download

Statistics

Help

Contact

Center for Computational Systems Medicine
leaf

Gene summary

leaf

Malignant transformation analysis

leaf

Malignant transformation related pathway analysis

leaf

Cell-cell communication analysis

leaf

Single-cell gene regulatory network inference analysis

leaf

Somatic mutation of malignant transformation related genes

leaf

Related drugs of malignant transformation related genes

Gene: DHX30

Gene summary for DHX30

check button Gene summary.

Gene informationSpeciesHuman
Gene symbol

DHX30

Gene ID

22907

Gene nameDExH-box helicase 30
Gene AliasDDX30
Cytomap3p21.31
Gene Typeprotein-coding
GO ID

GO:0000027

UniProtAcc

H7BXY3


Top

Malignant transformation analysis

check button Identification of the aberrant gene expression in precancerous and cancerous lesions by comparing the gene expression of stem-like cells in diseased tissues with normal stem cells
check button Malignant transformation involving gene list.
Entrez IDSymbolReplicatesSpeciesOrganTissueAdj P-valueLog2FCMalignancy
22907DHX30LZE2THumanEsophagusESCC1.34e-066.62e-010.082
22907DHX30LZE4THumanEsophagusESCC1.56e-082.91e-010.0811
22907DHX30LZE5THumanEsophagusESCC4.67e-022.73e-010.0514
22907DHX30LZE7THumanEsophagusESCC3.87e-054.62e-010.0667
22907DHX30LZE24THumanEsophagusESCC2.27e-112.99e-010.0596
22907DHX30P1T-EHumanEsophagusESCC1.18e-033.94e-010.0875
22907DHX30P2T-EHumanEsophagusESCC1.10e-264.18e-010.1177
22907DHX30P4T-EHumanEsophagusESCC1.59e-184.94e-010.1323
22907DHX30P5T-EHumanEsophagusESCC5.19e-172.27e-010.1327
22907DHX30P8T-EHumanEsophagusESCC4.76e-224.39e-010.0889
22907DHX30P9T-EHumanEsophagusESCC5.05e-174.41e-010.1131
22907DHX30P10T-EHumanEsophagusESCC7.74e-375.91e-010.116
22907DHX30P11T-EHumanEsophagusESCC7.30e-164.69e-010.1426
22907DHX30P12T-EHumanEsophagusESCC1.77e-317.21e-010.1122
22907DHX30P15T-EHumanEsophagusESCC5.62e-214.10e-010.1149
22907DHX30P16T-EHumanEsophagusESCC5.69e-245.00e-010.1153
22907DHX30P17T-EHumanEsophagusESCC3.17e-044.32e-010.1278
22907DHX30P19T-EHumanEsophagusESCC2.73e-096.75e-010.1662
22907DHX30P20T-EHumanEsophagusESCC2.17e-244.78e-010.1124
22907DHX30P21T-EHumanEsophagusESCC9.78e-214.66e-010.1617
Page: 1 2 3 4 5 6 

check button Transcriptomic changes along malignancy continuum.
TissueExpression DynamicsAbbreviation
EsophagusThe image shows the transcriptomic changes along malignancy continuum.log2FC in expression of this searched gene in stem-like cells from each diseased tissue sample relative to stem-like cells in normal samples in each tissue plotted against the malignancy continuum. Samples are colored based on if they are from different disease stage.
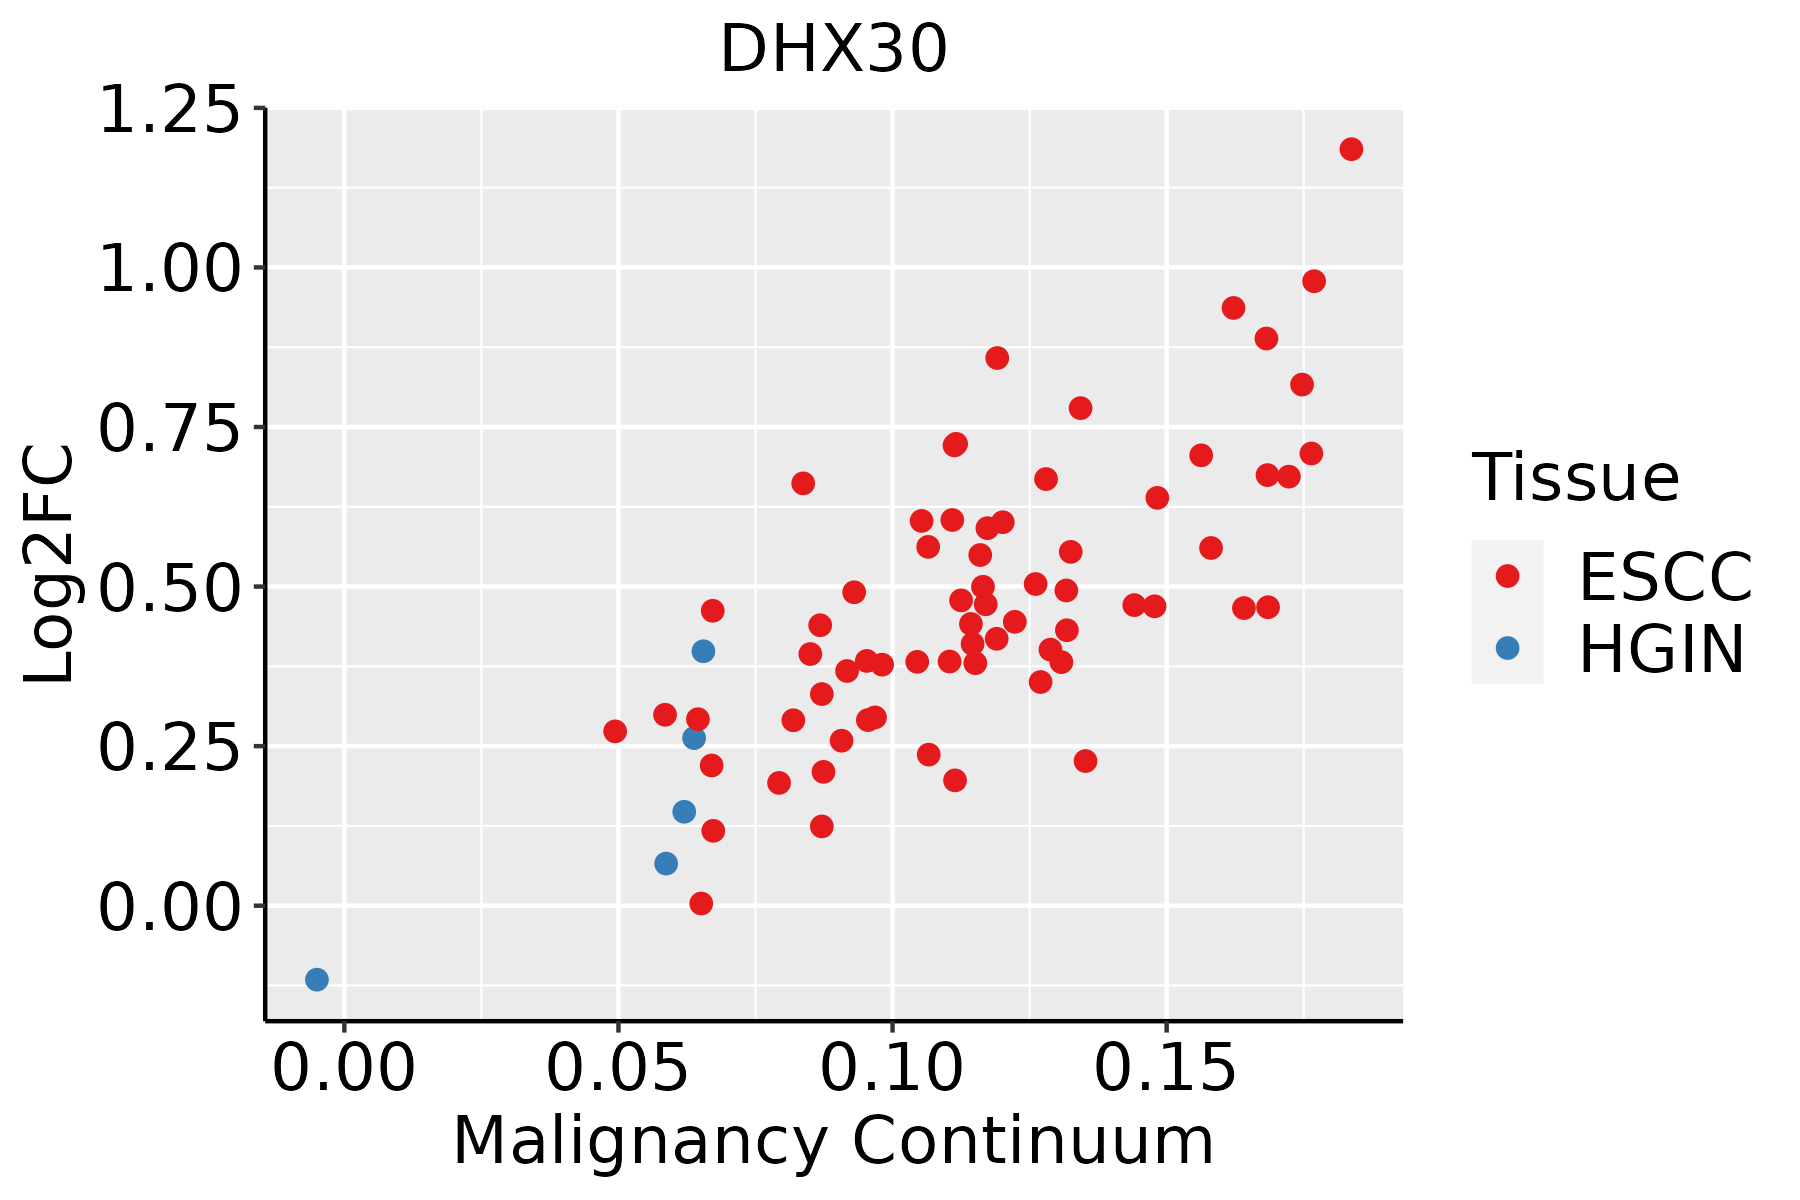
ESCC: Esophageal squamous cell carcinoma
HGIN: High-grade intraepithelial neoplasias
LGIN: Low-grade intraepithelial neoplasias
LiverThe image shows the transcriptomic changes along malignancy continuum.log2FC in expression of this searched gene in stem-like cells from each diseased tissue sample relative to stem-like cells in normal samples in each tissue plotted against the malignancy continuum. Samples are colored based on if they are from different disease stage.
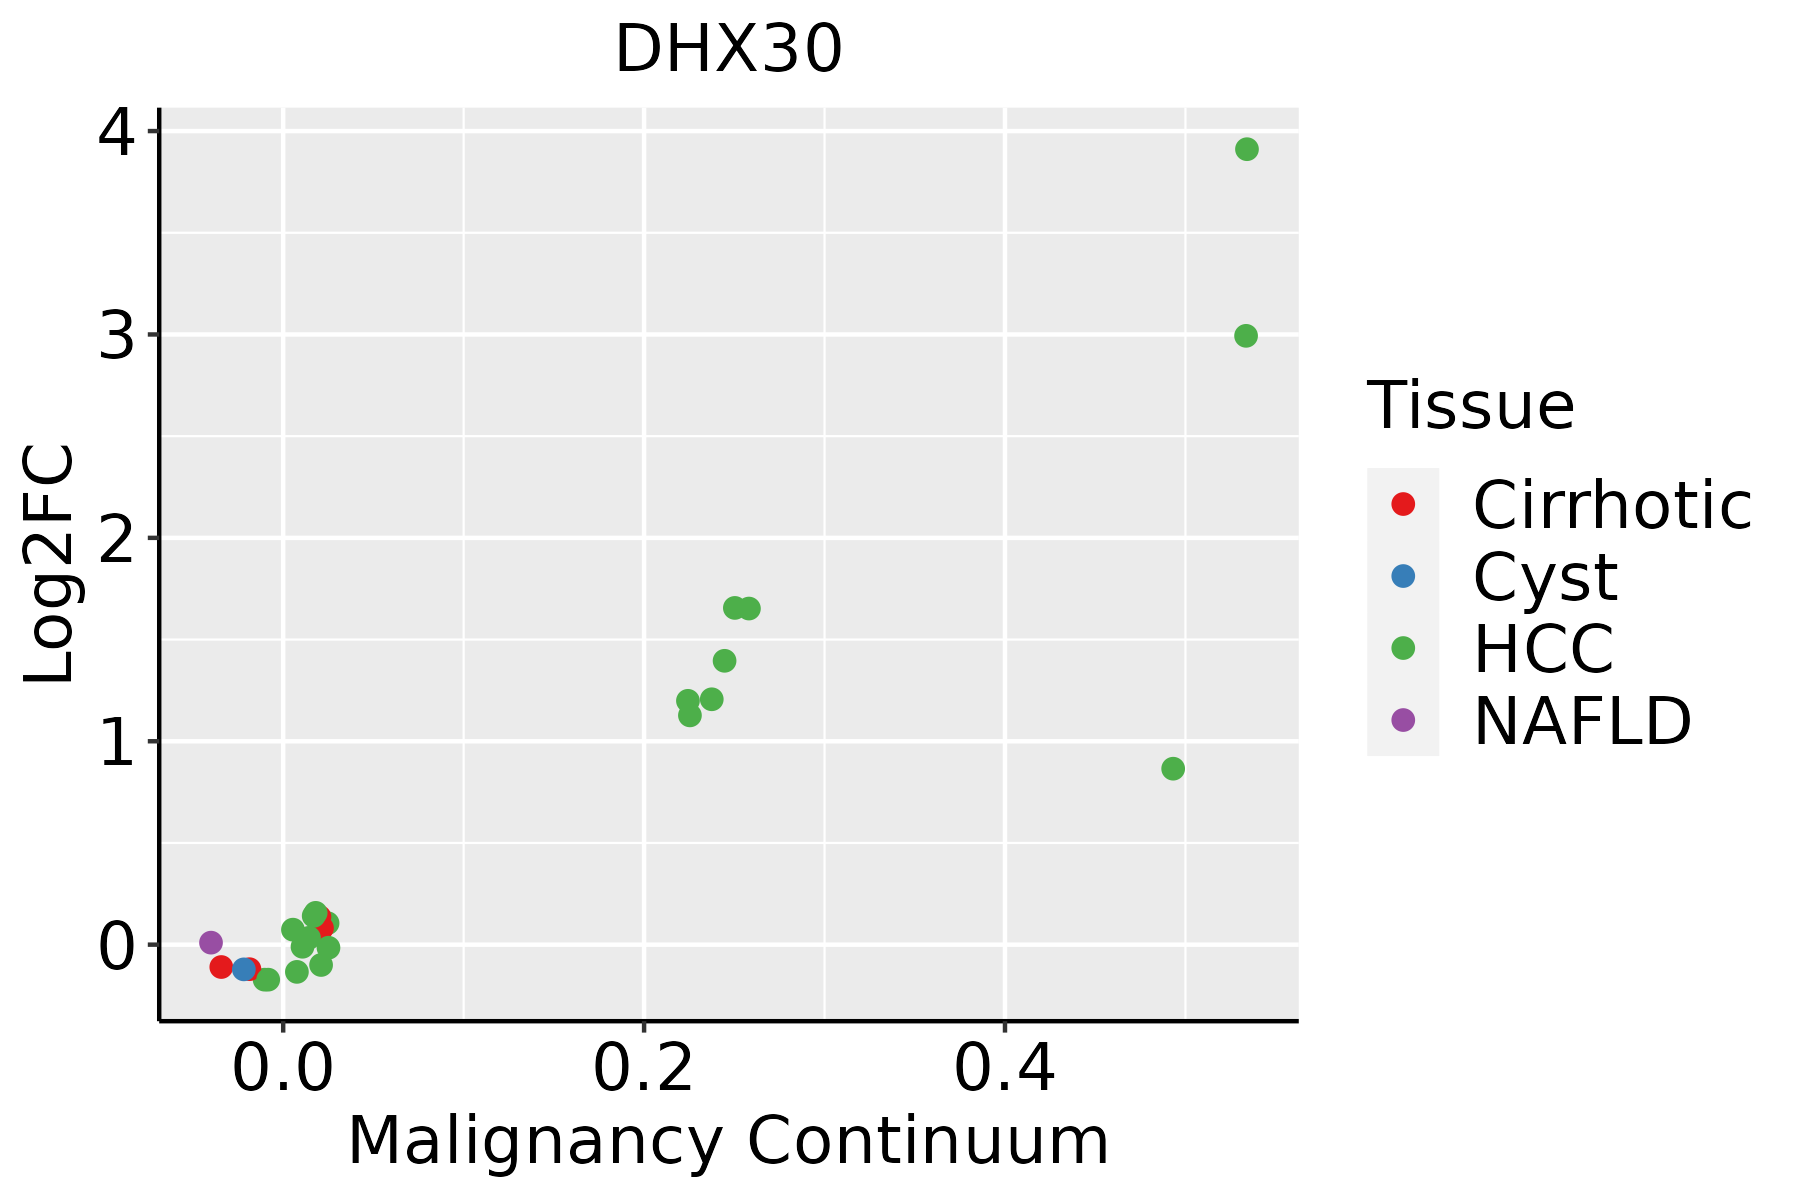
HCC: Hepatocellular carcinoma
NAFLD: Non-alcoholic fatty liver disease
Oral CavityThe image shows the transcriptomic changes along malignancy continuum.log2FC in expression of this searched gene in stem-like cells from each diseased tissue sample relative to stem-like cells in normal samples in each tissue plotted against the malignancy continuum. Samples are colored based on if they are from different disease stage.
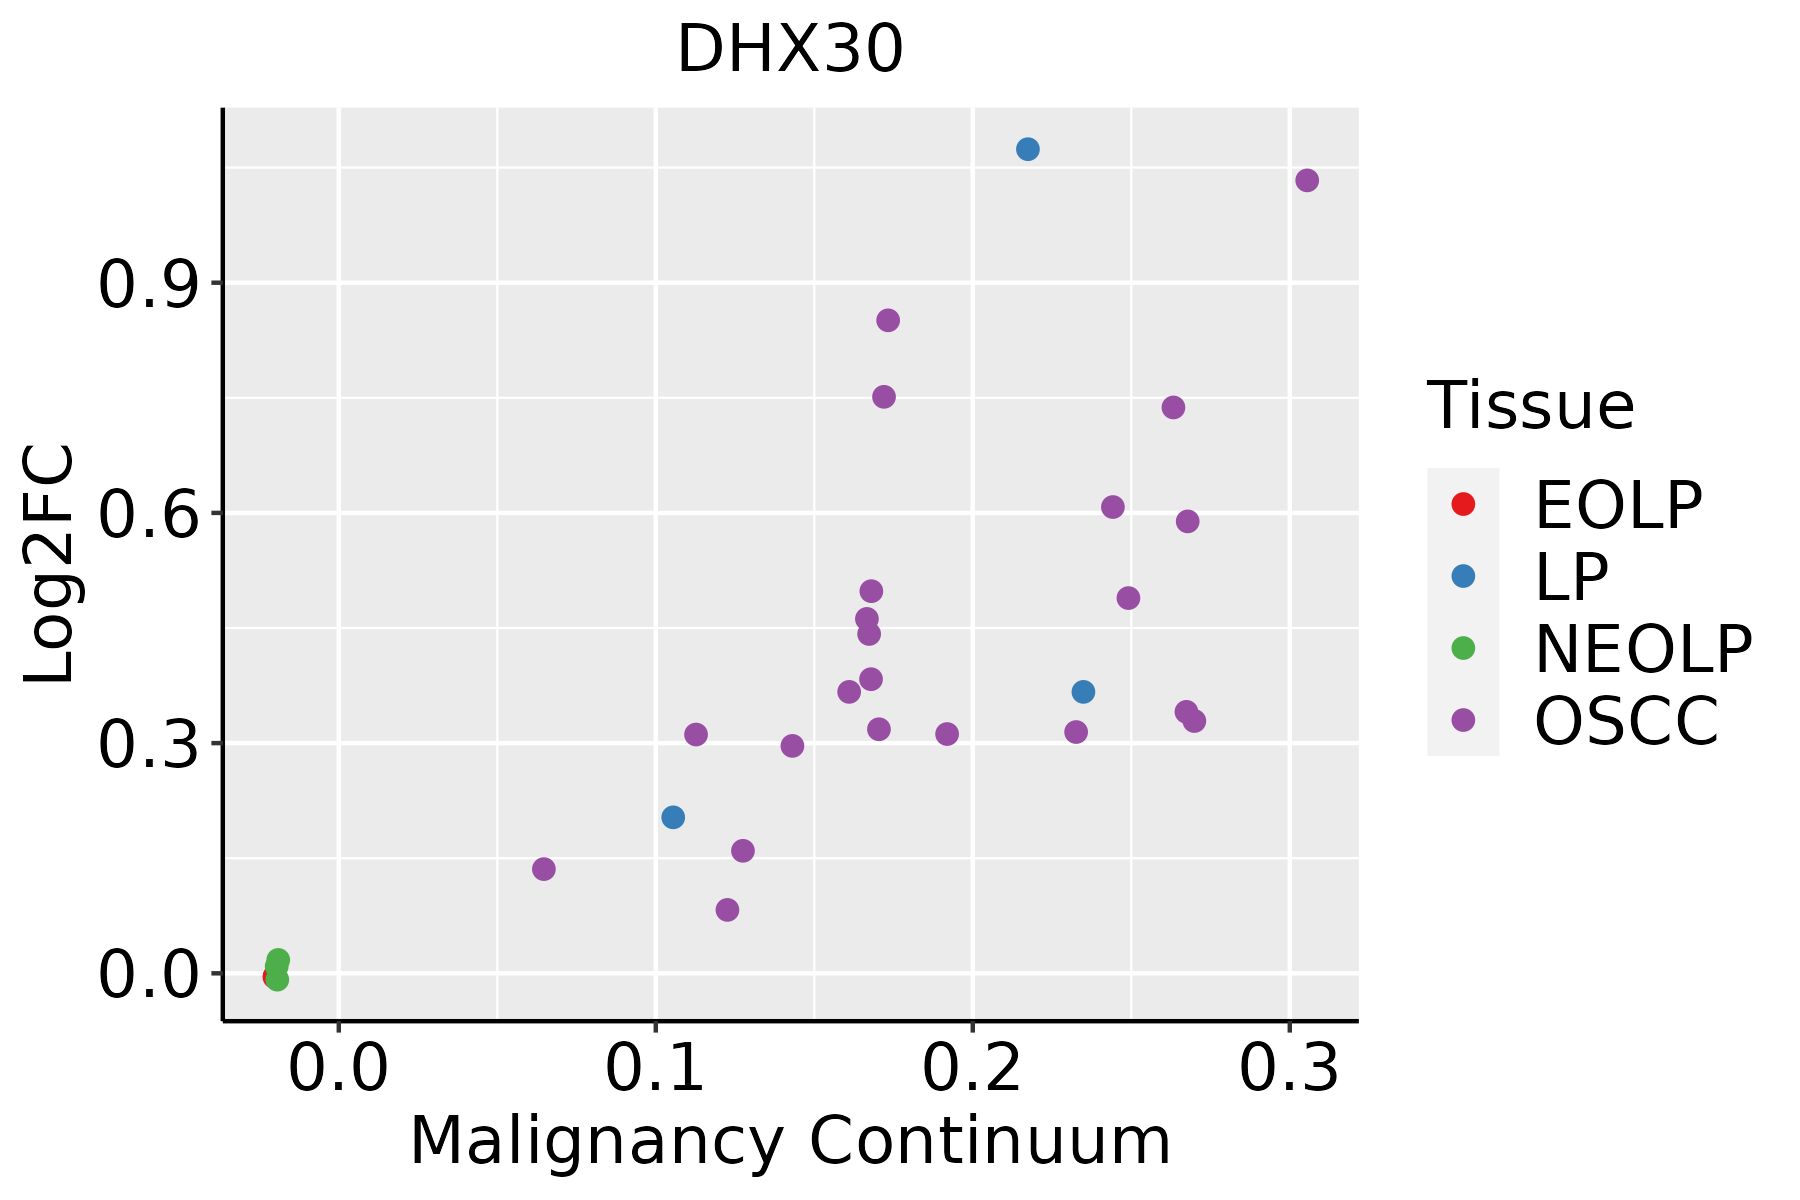
EOLP: Erosive Oral lichen planus
LP: leukoplakia
NEOLP: Non-erosive oral lichen planus
OSCC: Oral squamous cell carcinoma
SkinThe image shows the transcriptomic changes along malignancy continuum.log2FC in expression of this searched gene in stem-like cells from each diseased tissue sample relative to stem-like cells in normal samples in each tissue plotted against the malignancy continuum. Samples are colored based on if they are from different disease stage.AK: Actinic keratosis
cSCC: Cutaneous squamous cell carcinoma
SCCIS:squamous cell carcinoma in situ
ThyroidThe image shows the transcriptomic changes along malignancy continuum.log2FC in expression of this searched gene in stem-like cells from each diseased tissue sample relative to stem-like cells in normal samples in each tissue plotted against the malignancy continuum. Samples are colored based on if they are from different disease stage.
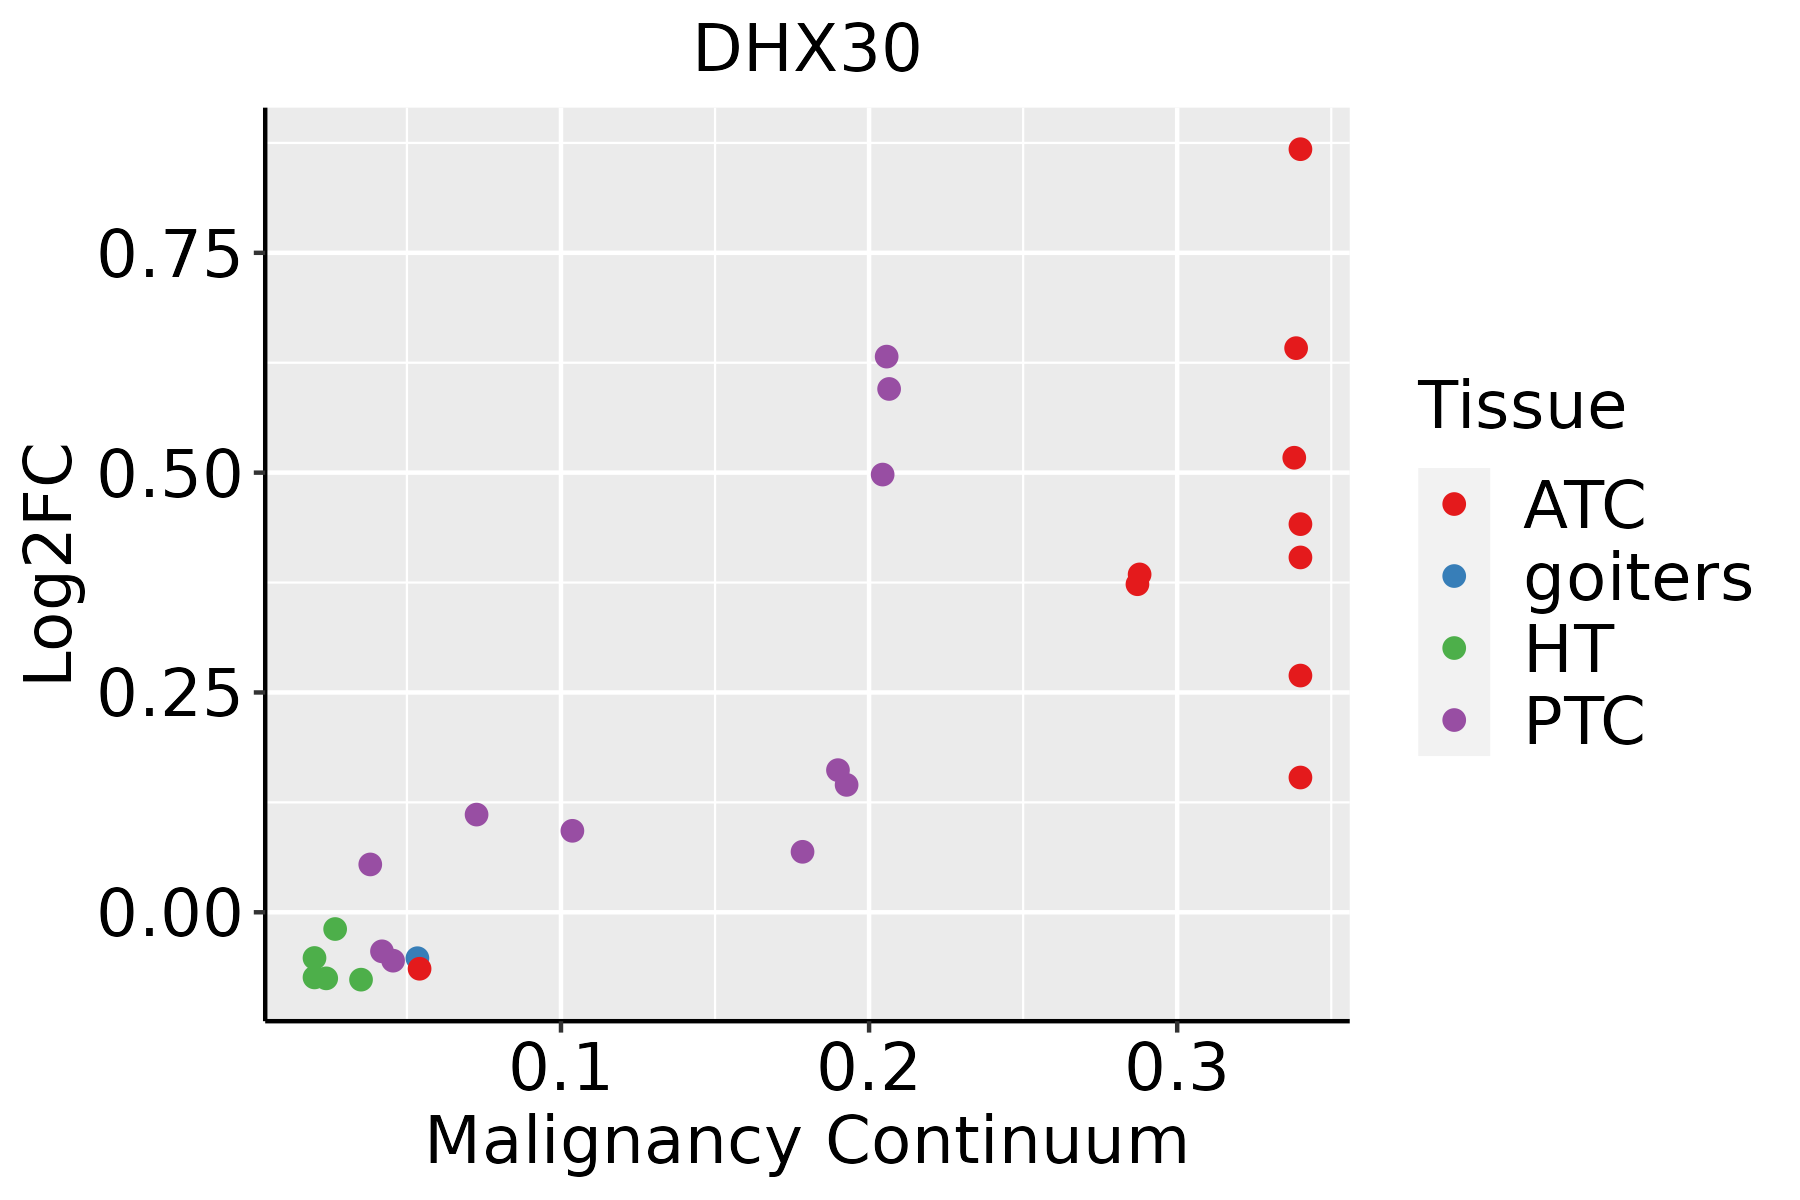
ATC: Anaplastic thyroid cancer
HT: Hashimoto's thyroiditis
PTC: Papillary thyroid cancer
∗log2FC in expression of this searched gene in stem-like cells from each diseased tissue sample relative to stem-like cells in normal samples in each tissue plotted against the malignancy continuum. Samples are colored based on if they are from different disease stage.

Top

Malignant transformation related pathway analysis

check buttonFind out the enriched GO biological processes and KEGG pathways involved in transition from healthy to precancer to cancer
check button Figure of enriched GO biological processes.
TissueDisease StageEnriched GO biological Processes
ColorectumADGO analysis - Figure of enriched GO biological processes: Top 15 enriched GO BP terms are showed in the bar plot of each disease state in each tissue. Each row represents a significant GO biological process which is colored according to the -log10(p.adjust).
ColorectumSERGO analysis - Figure of enriched GO biological processes: Top 15 enriched GO BP terms are showed in the bar plot of each disease state in each tissue. Each row represents a significant GO biological process which is colored according to the -log10(p.adjust).
ColorectumMSSGO analysis - Figure of enriched GO biological processes: Top 15 enriched GO BP terms are showed in the bar plot of each disease state in each tissue. Each row represents a significant GO biological process which is colored according to the -log10(p.adjust).
ColorectumMSI-HGO analysis - Figure of enriched GO biological processes: Top 15 enriched GO BP terms are showed in the bar plot of each disease state in each tissue. Each row represents a significant GO biological process which is colored according to the -log10(p.adjust).
ColorectumFAPGO analysis - Figure of enriched GO biological processes: Top 15 enriched GO BP terms are showed in the bar plot of each disease state in each tissue. Each row represents a significant GO biological process which is colored according to the -log10(p.adjust).
∗Top 15 enriched GO BP terms are showed in the bar plot of each disease state in each tissue. Each row represents a significant GO biological process which is colored according to the -log10(p.adjust).
Page: 1 2 3 4 5 6 7 8 9 

check button Enriched GO biological processes.
GO IDTissueDisease StageDescriptionGene RatioBg Ratiopvaluep.adjustCount
GO:0022613111EsophagusESCCribonucleoprotein complex biogenesis365/8552463/187231.74e-491.11e-45365
GO:0042254111EsophagusESCCribosome biogenesis252/8552299/187233.27e-441.04e-40252
GO:0071826111EsophagusESCCribonucleoprotein complex subunit organization166/8552227/187232.94e-172.42e-15166
GO:0022618111EsophagusESCCribonucleoprotein complex assembly159/8552220/187238.19e-165.71e-14159
GO:0042273111EsophagusESCCribosomal large subunit biogenesis65/855272/187231.53e-159.82e-1465
GO:0042255111EsophagusESCCribosome assembly50/855261/187235.66e-091.17e-0750
GO:0000027111EsophagusESCCribosomal large subunit assembly22/855227/187231.49e-049.92e-0422
GO:002261312LiverCirrhoticribonucleoprotein complex biogenesis231/4634463/187233.28e-326.86e-29231
GO:004225412LiverCirrhoticribosome biogenesis154/4634299/187231.18e-236.72e-21154
GO:007182612LiverCirrhoticribonucleoprotein complex subunit organization115/4634227/187232.67e-173.63e-15115
GO:002261812LiverCirrhoticribonucleoprotein complex assembly112/4634220/187234.35e-175.81e-15112
GO:004227312LiverCirrhoticribosomal large subunit biogenesis47/463472/187234.20e-133.29e-1147
GO:004225512LiverCirrhoticribosome assembly39/463461/187231.07e-105.72e-0939
GO:000002712LiverCirrhoticribosomal large subunit assembly15/463427/187235.96e-044.63e-0315
GO:002261322LiverHCCribonucleoprotein complex biogenesis355/7958463/187237.76e-524.92e-48355
GO:004225422LiverHCCribosome biogenesis246/7958299/187234.99e-461.58e-42246
GO:007182622LiverHCCribonucleoprotein complex subunit organization159/7958227/187233.14e-173.06e-15159
GO:004227322LiverHCCribosomal large subunit biogenesis64/795872/187232.31e-162.03e-1464
GO:002261822LiverHCCribonucleoprotein complex assembly153/7958220/187233.44e-162.91e-14153
GO:004225522LiverHCCribosome assembly50/795861/187232.79e-109.50e-0950
Page: 1 2 3 

check button Enriched KEGG pathways.
Pathway IDTissueDisease StageDescriptionGene RatioBg Ratiopvaluep.adjustqvalueCount
Page: 1 

Top

Cell-cell communication analysis

check buttonIdentification of potential cell-cell interactions between two cell types and their ligand-receptor pairs for different disease states
LigandReceptorLRpairPathwayTissueDisease Stage
Page: 1 

Top

Single-cell gene regulatory network inference analysis

check buttonFind out the significant the regulons (TFs) and the target genes of each regulon across cell types for different disease states
TFCell TypeTissueDisease StageTarget GeneRSSRegulon Activity
∗The dot plots of a searched regulon are shown for all cell subpopulations in each disease state of each tissue based on the regulon specific score inferred using pySCENIC and by calculating the average expression.
Page: 1 

Top

Somatic mutation of malignant transformation related genes

check buttonAnnotation of somatic variants for genes involved in malignant transformation
Hugo SymbolVariant ClassVariant ClassificationdbSNP RSHGVScHGVSpHGVSp ShortSWISSPROTBIOTYPESIFTPolyPhenTumor Sample BarcodeTissueHistologySexAgeStageTherapy TypesDrugsOutcome
DHX30SNVMissense_Mutationrs748383690c.1951N>Ap.Asp651Asnp.D651NQ7L2E3protein_codingtolerated(0.19)benign(0.137)TCGA-AN-A046-01Breastbreast invasive carcinomaFemale>=65I/IIUnknownUnknownSD
DHX30SNVMissense_Mutationrs754158644c.2086G>Ap.Glu696Lysp.E696KQ7L2E3protein_codingtolerated(0.85)benign(0.001)TCGA-C8-A8HQ-01Breastbreast invasive carcinomaFemale<65I/IIUnknownUnknownSD
DHX30SNVMissense_Mutationrs776820854c.2987N>Tp.Ser996Leup.S996LQ7L2E3protein_codingdeleterious(0.02)benign(0.05)TCGA-GM-A2DO-01Breastbreast invasive carcinomaFemale<65I/IIHormone TherapytamoxiphenCR
DHX30insertionNonsense_Mutationnovelc.1843_1844insGAACAAGGACTGAGTAGAACTGGAGGCATCTGAGCTTp.Met615ArgfsTer6p.M615Rfs*6Q7L2E3protein_codingTCGA-AN-A0FN-01Breastbreast invasive carcinomaFemale<65I/IIUnknownUnknownSD
DHX30insertionIn_Frame_Insnovelc.909_910insATTTCATGCCTTCTGCCCTTCTGGCTCCCTp.Lys303_Ala304insIleSerCysLeuLeuProPheTrpLeuProp.K303_A304insISCLLPFWLPQ7L2E3protein_codingTCGA-AO-A0JF-01Breastbreast invasive carcinomaFemale>=65I/IIChemotherapydoxorubicinSD
DHX30insertionFrame_Shift_Insnovelc.797_798insCCTCCACAp.Met266IlefsTer26p.M266Ifs*26Q7L2E3protein_codingTCGA-B6-A0IK-01Breastbreast invasive carcinomaFemale<65III/IVUnknownUnknownPD
DHX30insertionNonsense_Mutationnovelc.799_800insTAAGGTGAGTTGGGTCTCCTAGAp.Gln267LeufsTer3p.Q267Lfs*3Q7L2E3protein_codingTCGA-B6-A0IK-01Breastbreast invasive carcinomaFemale<65III/IVUnknownUnknownPD
DHX30insertionFrame_Shift_Insnovelc.1725_1726insCCTGACCAACATGGTGAAACCTTGTCTGTACTAAAAATACAp.Lys576ProfsTer29p.K576Pfs*29Q7L2E3protein_codingTCGA-BH-A0BM-01Breastbreast invasive carcinomaFemale<65I/IIChemotherapyadriamycinSD
DHX30SNVMissense_Mutationrs139889547c.464G>Ap.Arg155Hisp.R155HQ7L2E3protein_codingtolerated_low_confidence(0.06)benign(0.232)TCGA-2W-A8YY-01Cervixcervical & endocervical cancerFemale<65I/IIChemotherapycisplatinCR
DHX30SNVMissense_Mutationnovelc.742C>Ap.Leu248Ilep.L248IQ7L2E3protein_codingtolerated(0.1)benign(0.242)TCGA-2W-A8YY-01Cervixcervical & endocervical cancerFemale<65I/IIChemotherapycisplatinCR
Page: 1 2 3 4 5 6 7 8 9 10 11 12 13 14 

Top

Related drugs of malignant transformation related genes

check buttonIdentification of chemicals and drugs interact with genes involved in malignant transfromation
(DGIdb 4.0)
Entrez IDSymbolCategoryInteraction TypesDrug Claim NameDrug NamePMIDs
Page: 1