
|
|||||
|
 | |
| |
| |
| |
| |
| |
|
Gene: DHX16 |
Gene summary for DHX16 |
| Gene information | Species | Human | Gene symbol | DHX16 | Gene ID | 8449 |
| Gene name | DEAH-box helicase 16 | |
| Gene Alias | DBP2 | |
| Cytomap | 6p21.33 | |
| Gene Type | protein-coding | GO ID | GO:0000375 | UniProtAcc | A0A1U9X7L7 |
Top |
Malignant transformation analysis |
| Identification of the aberrant gene expression in precancerous and cancerous lesions by comparing the gene expression of stem-like cells in diseased tissues with normal stem cells |
| Entrez ID | Symbol | Replicates | Species | Organ | Tissue | Adj P-value | Log2FC | Malignancy |
| 8449 | DHX16 | LZE2T | Human | Esophagus | ESCC | 3.12e-03 | 4.19e-01 | 0.082 |
| 8449 | DHX16 | LZE4T | Human | Esophagus | ESCC | 1.70e-09 | 1.76e-01 | 0.0811 |
| 8449 | DHX16 | LZE7T | Human | Esophagus | ESCC | 2.00e-04 | 2.88e-01 | 0.0667 |
| 8449 | DHX16 | LZE8T | Human | Esophagus | ESCC | 1.27e-05 | 1.65e-01 | 0.067 |
| 8449 | DHX16 | LZE21D1 | Human | Esophagus | HGIN | 1.83e-02 | 2.16e-01 | 0.0632 |
| 8449 | DHX16 | LZE22T | Human | Esophagus | ESCC | 4.04e-02 | 3.42e-01 | 0.068 |
| 8449 | DHX16 | LZE24T | Human | Esophagus | ESCC | 6.25e-10 | 3.33e-01 | 0.0596 |
| 8449 | DHX16 | LZE6T | Human | Esophagus | ESCC | 5.44e-07 | 2.64e-01 | 0.0845 |
| 8449 | DHX16 | P1T-E | Human | Esophagus | ESCC | 9.71e-08 | 4.48e-01 | 0.0875 |
| 8449 | DHX16 | P2T-E | Human | Esophagus | ESCC | 3.30e-31 | 4.76e-01 | 0.1177 |
| 8449 | DHX16 | P4T-E | Human | Esophagus | ESCC | 1.68e-18 | 5.03e-01 | 0.1323 |
| 8449 | DHX16 | P5T-E | Human | Esophagus | ESCC | 1.80e-14 | 2.62e-01 | 0.1327 |
| 8449 | DHX16 | P8T-E | Human | Esophagus | ESCC | 3.98e-15 | 2.43e-01 | 0.0889 |
| 8449 | DHX16 | P9T-E | Human | Esophagus | ESCC | 1.23e-17 | 3.55e-01 | 0.1131 |
| 8449 | DHX16 | P10T-E | Human | Esophagus | ESCC | 5.45e-17 | 1.95e-01 | 0.116 |
| 8449 | DHX16 | P11T-E | Human | Esophagus | ESCC | 3.93e-09 | 4.07e-01 | 0.1426 |
| 8449 | DHX16 | P12T-E | Human | Esophagus | ESCC | 1.75e-16 | 3.50e-01 | 0.1122 |
| 8449 | DHX16 | P15T-E | Human | Esophagus | ESCC | 1.15e-12 | 3.44e-01 | 0.1149 |
| 8449 | DHX16 | P16T-E | Human | Esophagus | ESCC | 2.90e-14 | 2.97e-01 | 0.1153 |
| 8449 | DHX16 | P17T-E | Human | Esophagus | ESCC | 2.12e-15 | 5.38e-01 | 0.1278 |
| Page: 1 2 3 4 5 |
| Tissue | Expression Dynamics | Abbreviation |
| Esophagus | 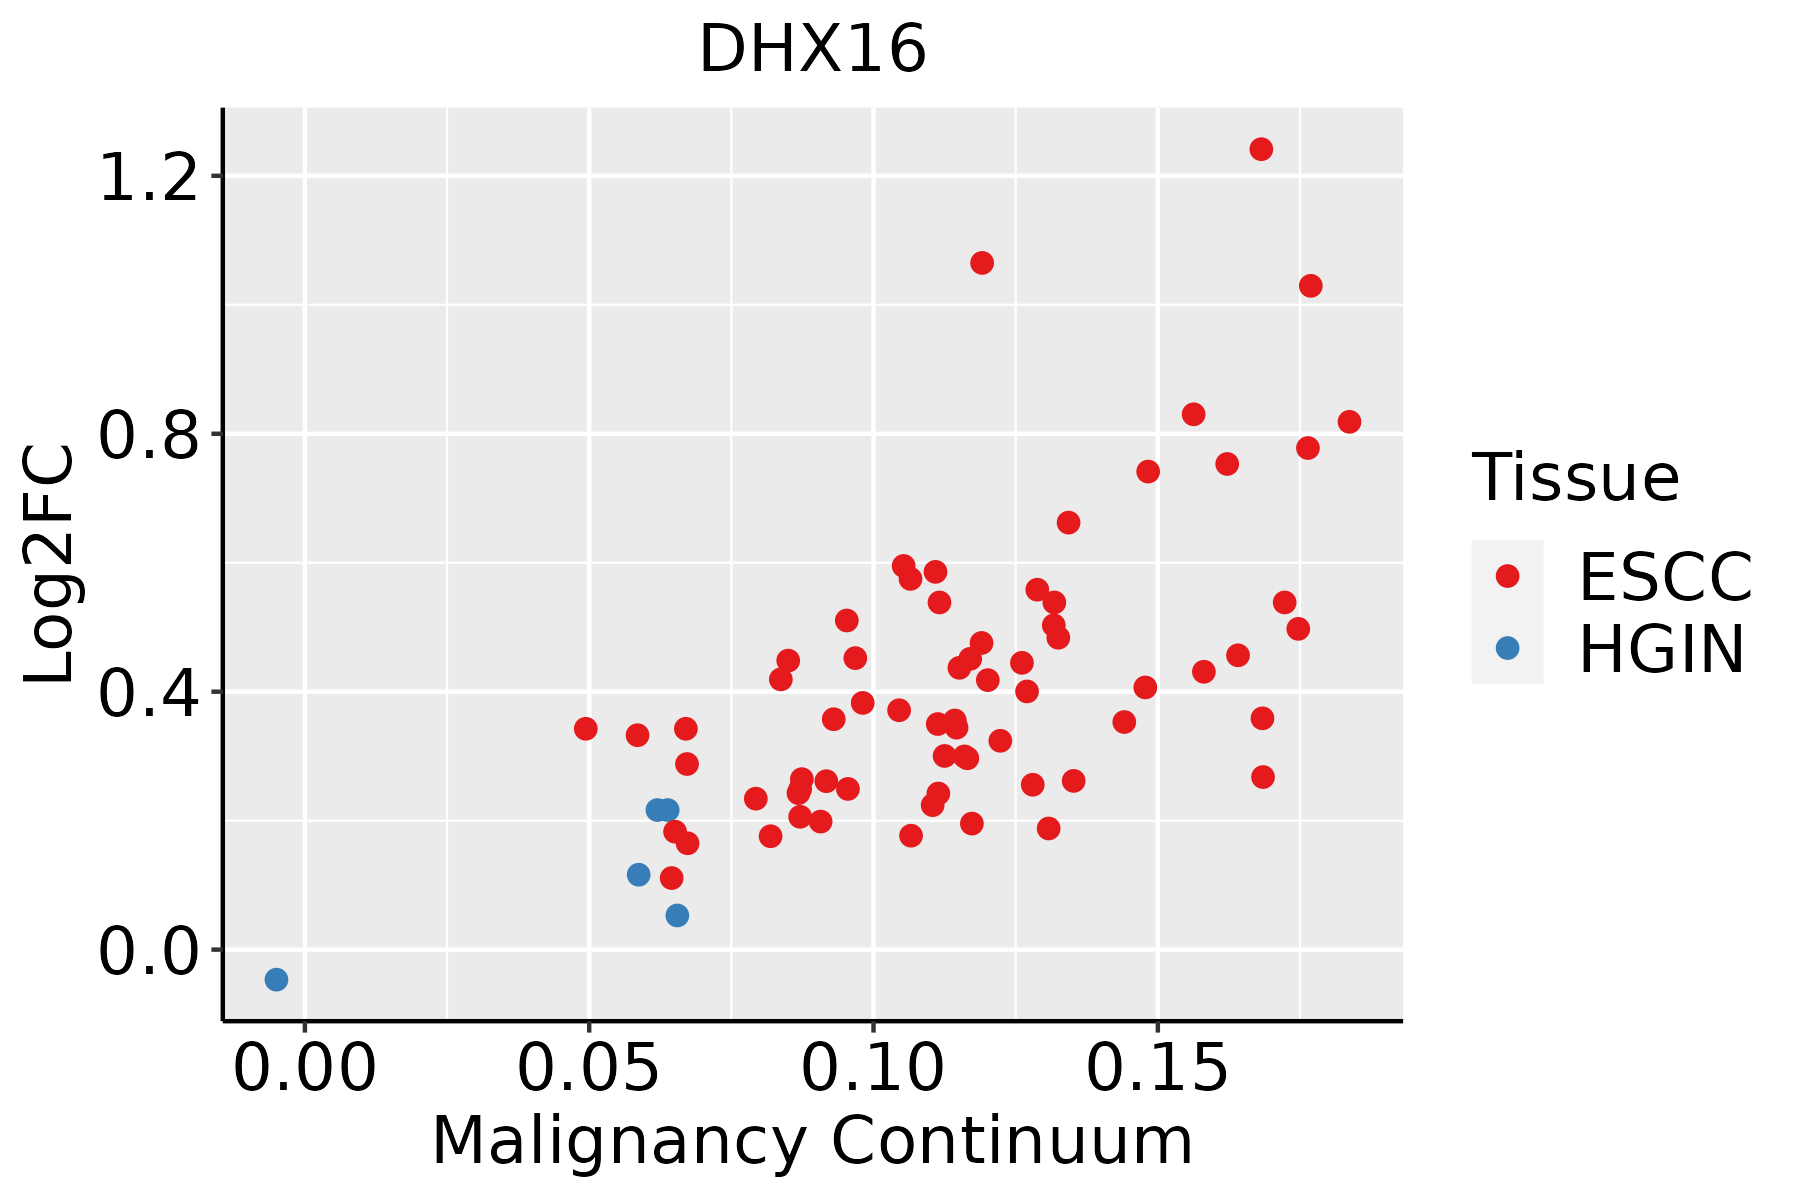 | ESCC: Esophageal squamous cell carcinoma |
| HGIN: High-grade intraepithelial neoplasias | ||
| LGIN: Low-grade intraepithelial neoplasias | ||
| Liver | 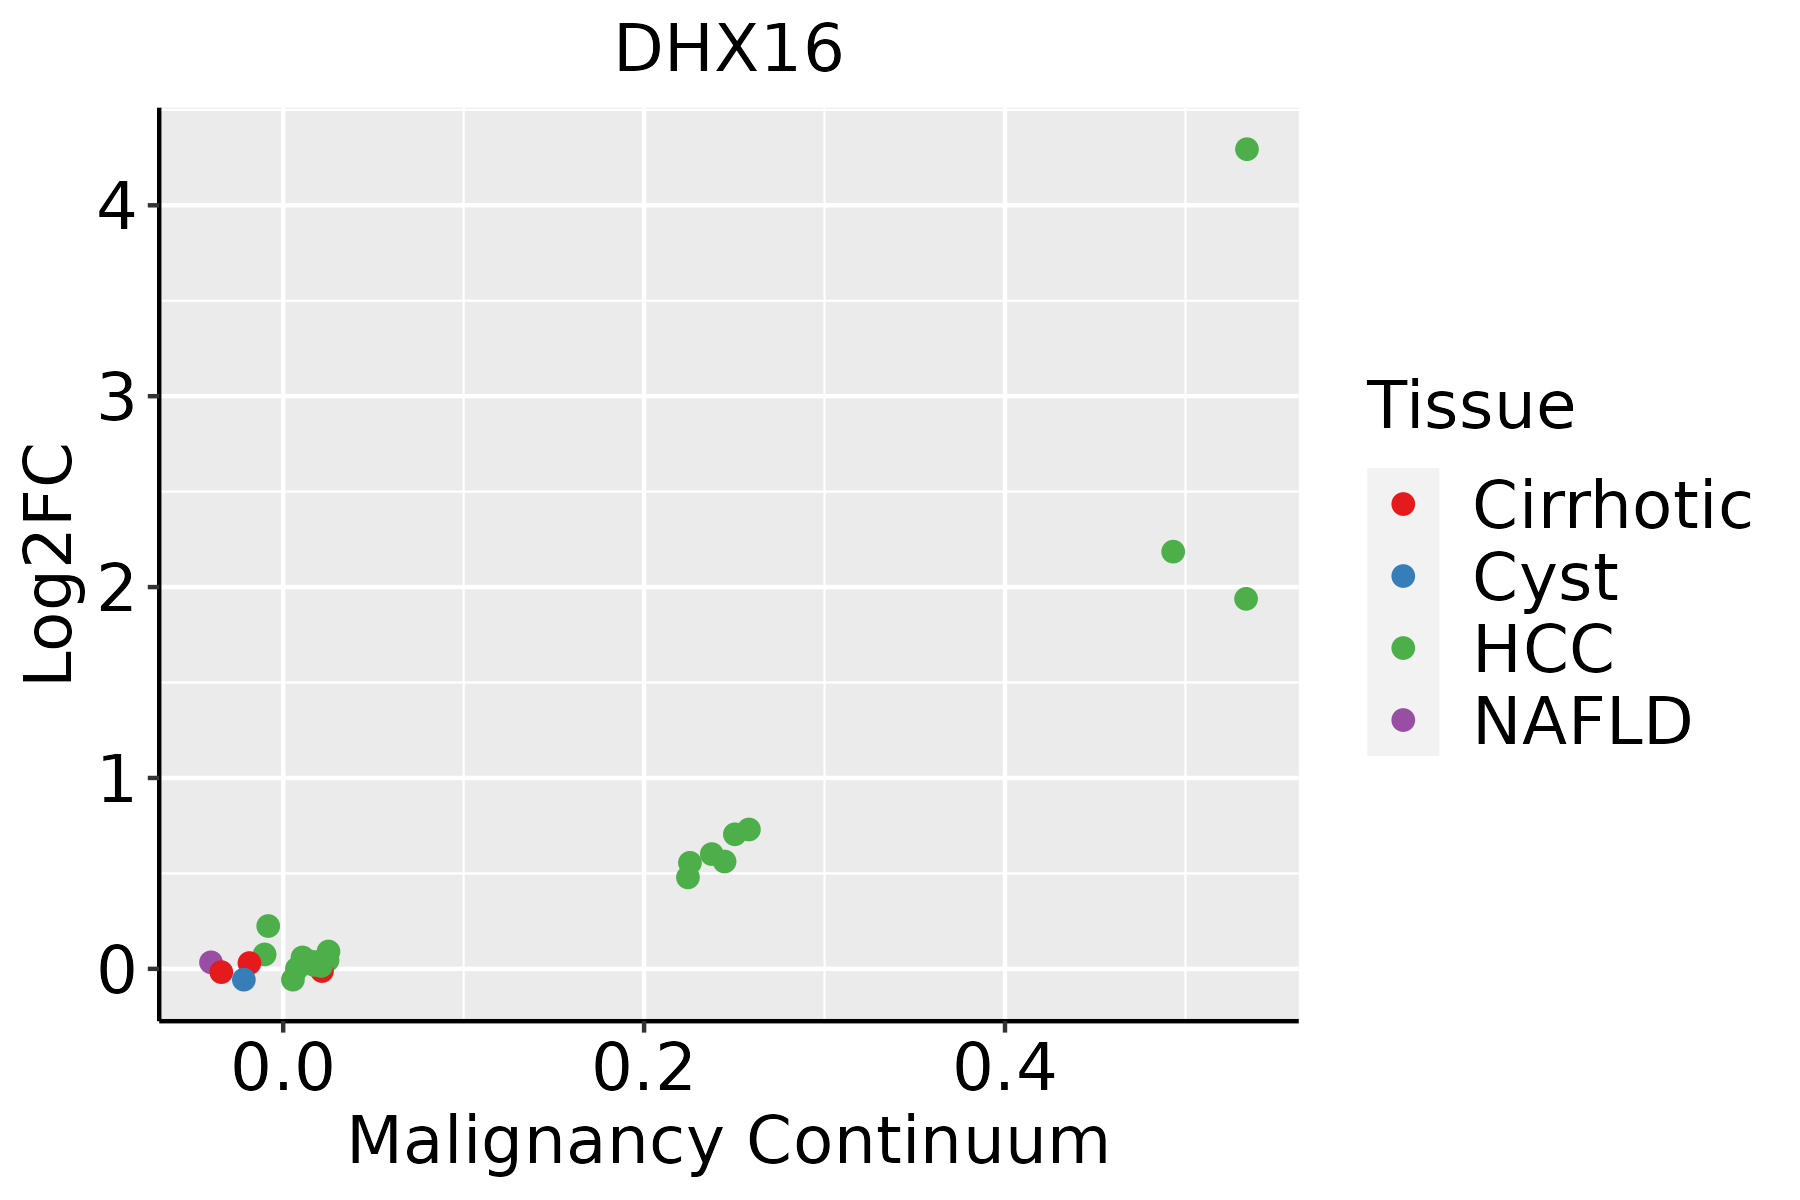 | HCC: Hepatocellular carcinoma |
| NAFLD: Non-alcoholic fatty liver disease | ||
| Oral Cavity | 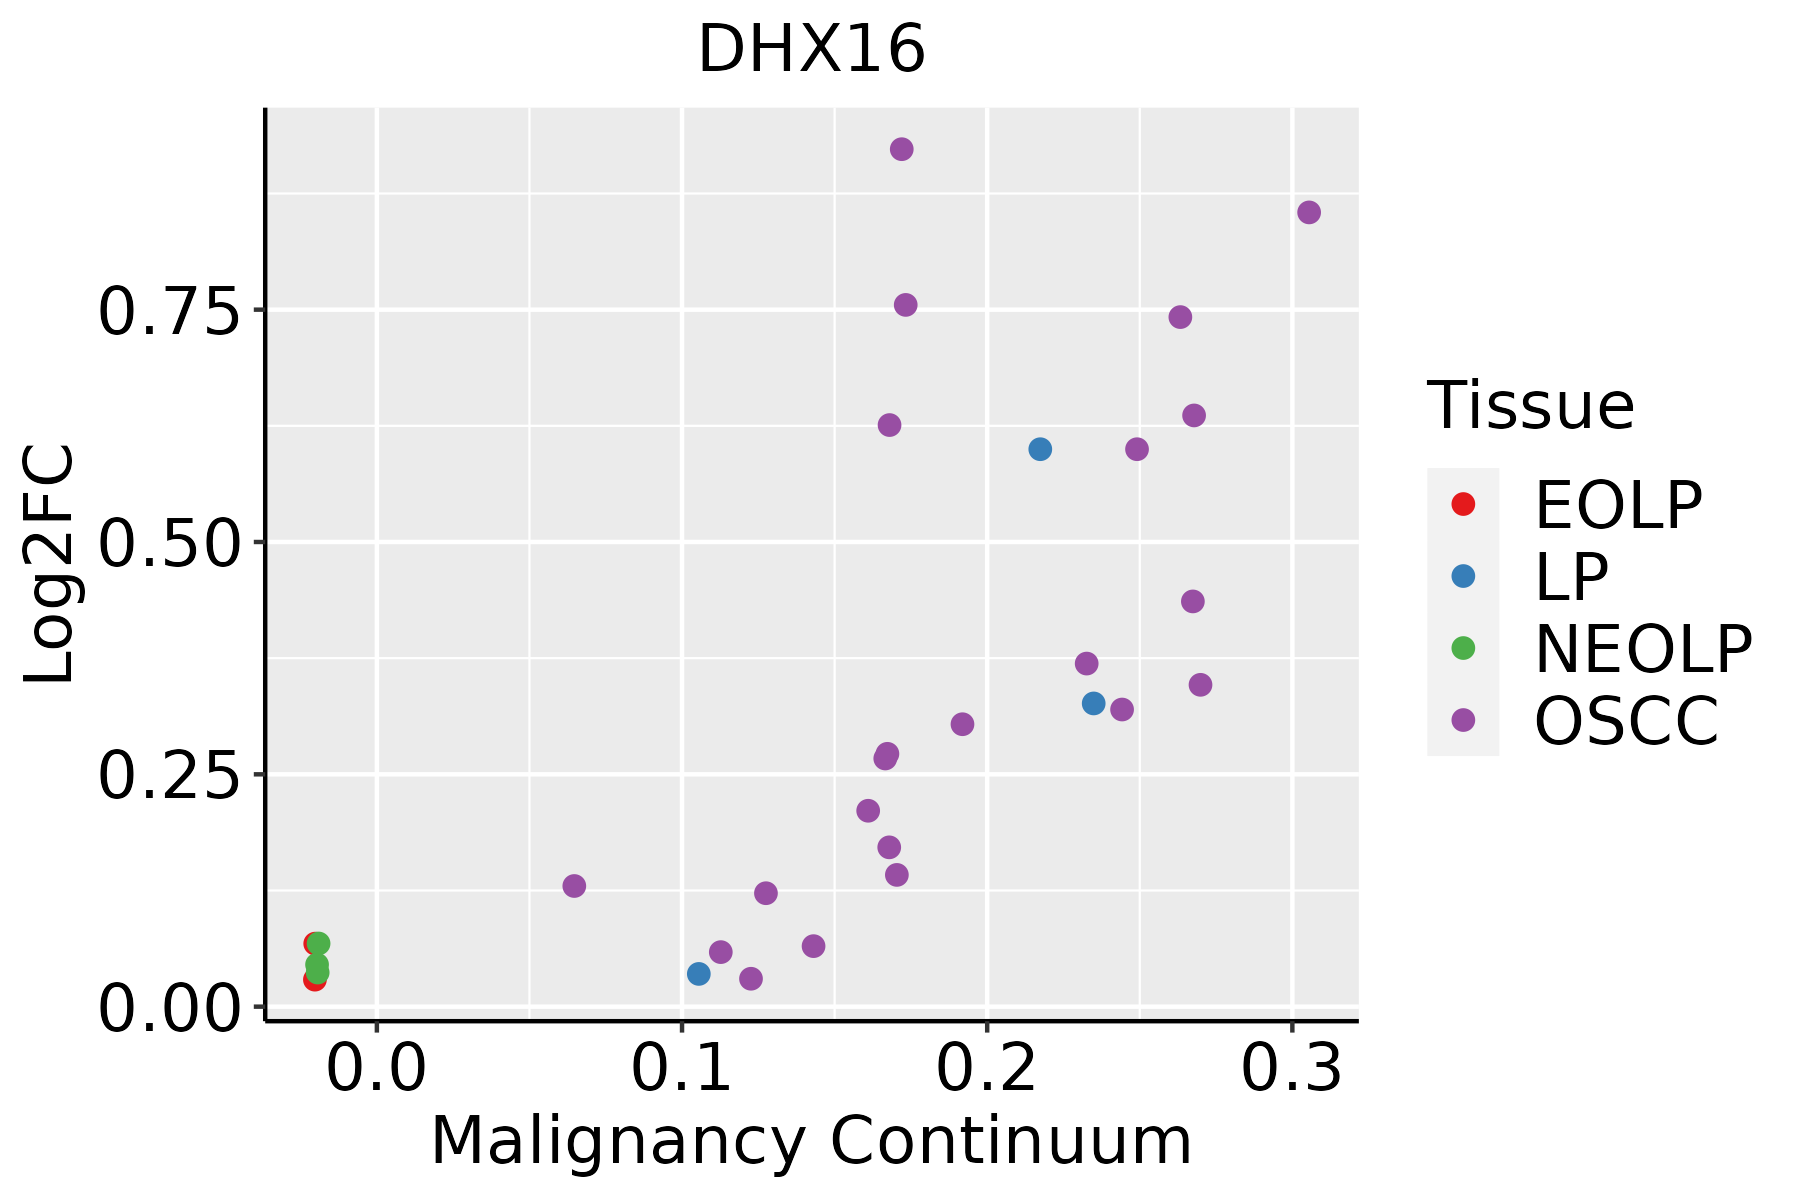 | EOLP: Erosive Oral lichen planus |
| LP: leukoplakia | ||
| NEOLP: Non-erosive oral lichen planus | ||
| OSCC: Oral squamous cell carcinoma |
| ∗log2FC in expression of this searched gene in stem-like cells from each diseased tissue sample relative to stem-like cells in normal samples in each tissue plotted against the malignancy continuum. Samples are colored based on if they are from different disease stage. |
Top |
Malignant transformation related pathway analysis |
| Find out the enriched GO biological processes and KEGG pathways involved in transition from healthy to precancer to cancer |
| Tissue | Disease Stage | Enriched GO biological Processes |
| Colorectum | AD |  |
| Colorectum | SER |  |
| Colorectum | MSS |  |
| Colorectum | MSI-H |  |
| Colorectum | FAP |  |
| ∗Top 15 enriched GO BP terms are showed in the bar plot of each disease state in each tissue. Each row represents a significant GO biological process which is colored according to the -log10(p.adjust). |
| Page: 1 2 3 4 5 6 7 8 9 |
| GO ID | Tissue | Disease Stage | Description | Gene Ratio | Bg Ratio | pvalue | p.adjust | Count |
| GO:000838026 | Esophagus | HGIN | RNA splicing | 160/2587 | 434/18723 | 3.74e-34 | 1.12e-30 | 160 |
| GO:000037520 | Esophagus | HGIN | RNA splicing, via transesterification reactions | 115/2587 | 324/18723 | 3.16e-23 | 3.80e-20 | 115 |
| GO:000037720 | Esophagus | HGIN | RNA splicing, via transesterification reactions with bulged adenosine as nucleophile | 113/2587 | 320/18723 | 1.24e-22 | 9.26e-20 | 113 |
| GO:000039820 | Esophagus | HGIN | mRNA splicing, via spliceosome | 113/2587 | 320/18723 | 1.24e-22 | 9.26e-20 | 113 |
| GO:0008380111 | Esophagus | ESCC | RNA splicing | 336/8552 | 434/18723 | 1.74e-42 | 3.67e-39 | 336 |
| GO:0000375111 | Esophagus | ESCC | RNA splicing, via transesterification reactions | 248/8552 | 324/18723 | 3.05e-30 | 1.49e-27 | 248 |
| GO:0000377111 | Esophagus | ESCC | RNA splicing, via transesterification reactions with bulged adenosine as nucleophile | 244/8552 | 320/18723 | 2.52e-29 | 1.07e-26 | 244 |
| GO:0000398111 | Esophagus | ESCC | mRNA splicing, via spliceosome | 244/8552 | 320/18723 | 2.52e-29 | 1.07e-26 | 244 |
| GO:000838022 | Liver | HCC | RNA splicing | 313/7958 | 434/18723 | 1.36e-36 | 1.73e-33 | 313 |
| GO:000037522 | Liver | HCC | RNA splicing, via transesterification reactions | 228/7958 | 324/18723 | 1.47e-24 | 4.06e-22 | 228 |
| GO:000037722 | Liver | HCC | RNA splicing, via transesterification reactions with bulged adenosine as nucleophile | 224/7958 | 320/18723 | 1.16e-23 | 2.62e-21 | 224 |
| GO:000039822 | Liver | HCC | mRNA splicing, via spliceosome | 224/7958 | 320/18723 | 1.16e-23 | 2.62e-21 | 224 |
| GO:000838020 | Oral cavity | OSCC | RNA splicing | 308/7305 | 434/18723 | 2.43e-42 | 7.70e-39 | 308 |
| GO:000037519 | Oral cavity | OSCC | RNA splicing, via transesterification reactions | 225/7305 | 324/18723 | 5.20e-29 | 2.99e-26 | 225 |
| GO:000037719 | Oral cavity | OSCC | RNA splicing, via transesterification reactions with bulged adenosine as nucleophile | 221/7305 | 320/18723 | 5.50e-28 | 2.18e-25 | 221 |
| GO:000039819 | Oral cavity | OSCC | mRNA splicing, via spliceosome | 221/7305 | 320/18723 | 5.50e-28 | 2.18e-25 | 221 |
| GO:0008380110 | Oral cavity | LP | RNA splicing | 237/4623 | 434/18723 | 1.82e-41 | 3.79e-38 | 237 |
| GO:0000375110 | Oral cavity | LP | RNA splicing, via transesterification reactions | 181/4623 | 324/18723 | 1.36e-33 | 1.70e-30 | 181 |
| GO:0000377110 | Oral cavity | LP | RNA splicing, via transesterification reactions with bulged adenosine as nucleophile | 179/4623 | 320/18723 | 2.48e-33 | 2.22e-30 | 179 |
| GO:0000398110 | Oral cavity | LP | mRNA splicing, via spliceosome | 179/4623 | 320/18723 | 2.48e-33 | 2.22e-30 | 179 |
| Page: 1 |
| Pathway ID | Tissue | Disease Stage | Description | Gene Ratio | Bg Ratio | pvalue | p.adjust | qvalue | Count |
| hsa0304018 | Esophagus | HGIN | Spliceosome | 79/1383 | 217/8465 | 3.22e-13 | 7.00e-12 | 5.56e-12 | 79 |
| hsa0304019 | Esophagus | HGIN | Spliceosome | 79/1383 | 217/8465 | 3.22e-13 | 7.00e-12 | 5.56e-12 | 79 |
| hsa0304027 | Esophagus | ESCC | Spliceosome | 128/4205 | 217/8465 | 3.31e-03 | 8.79e-03 | 4.50e-03 | 128 |
| hsa0304037 | Esophagus | ESCC | Spliceosome | 128/4205 | 217/8465 | 3.31e-03 | 8.79e-03 | 4.50e-03 | 128 |
| hsa0304022 | Liver | HCC | Spliceosome | 122/4020 | 217/8465 | 5.55e-03 | 1.60e-02 | 8.91e-03 | 122 |
| hsa0304032 | Liver | HCC | Spliceosome | 122/4020 | 217/8465 | 5.55e-03 | 1.60e-02 | 8.91e-03 | 122 |
| hsa0304016 | Oral cavity | OSCC | Spliceosome | 123/3704 | 217/8465 | 7.21e-05 | 2.74e-04 | 1.40e-04 | 123 |
| hsa0304017 | Oral cavity | OSCC | Spliceosome | 123/3704 | 217/8465 | 7.21e-05 | 2.74e-04 | 1.40e-04 | 123 |
| hsa0304026 | Oral cavity | LP | Spliceosome | 106/2418 | 217/8465 | 1.30e-10 | 2.40e-09 | 1.55e-09 | 106 |
| hsa0304036 | Oral cavity | LP | Spliceosome | 106/2418 | 217/8465 | 1.30e-10 | 2.40e-09 | 1.55e-09 | 106 |
| Page: 1 |
Top |
Cell-cell communication analysis |
| Identification of potential cell-cell interactions between two cell types and their ligand-receptor pairs for different disease states |
| Ligand | Receptor | LRpair | Pathway | Tissue | Disease Stage |
| Page: 1 |
Top |
Single-cell gene regulatory network inference analysis |
| Find out the significant the regulons (TFs) and the target genes of each regulon across cell types for different disease states |
| TF | Cell Type | Tissue | Disease Stage | Target Gene | RSS | Regulon Activity |
| ∗The dot plots of a searched regulon are shown for all cell subpopulations in each disease state of each tissue based on the regulon specific score inferred using pySCENIC and by calculating the average expression. |
| Page: 1 |
Top |
Somatic mutation of malignant transformation related genes |
| Annotation of somatic variants for genes involved in malignant transformation |
| Hugo Symbol | Variant Class | Variant Classification | dbSNP RS | HGVSc | HGVSp | HGVSp Short | SWISSPROT | BIOTYPE | SIFT | PolyPhen | Tumor Sample Barcode | Tissue | Histology | Sex | Age | Stage | Therapy Types | Drugs | Outcome |
| DHX16 | SNV | Missense_Mutation | c.2207N>T | p.Arg736Leu | p.R736L | O60231 | protein_coding | deleterious(0) | probably_damaging(0.995) | TCGA-A8-A09G-01 | Breast | breast invasive carcinoma | Female | >=65 | III/IV | Unknown | Unknown | SD | |
| DHX16 | insertion | Nonsense_Mutation | novel | c.2123_2124insATAGCAGCATTTATTTATAAT | p.Ser708_Leu709insTer | p.S708_L709ins* | O60231 | protein_coding | TCGA-A7-A0CJ-01 | Breast | breast invasive carcinoma | Female | <65 | I/II | Chemotherapy | cytoxan | SD | ||
| DHX16 | insertion | Frame_Shift_Ins | novel | c.2122_2123insGTATGAAGAAATCCCGTTTCCAACGAAGG | p.Ser708CysfsTer73 | p.S708Cfs*73 | O60231 | protein_coding | TCGA-A7-A0D9-01 | Breast | breast invasive carcinoma | Female | <65 | I/II | Chemotherapy | taxotere | SD | ||
| DHX16 | insertion | Frame_Shift_Ins | novel | c.2028_2029insATCTCTCCTTTCTTTTTAACTGTCTTCCCAGTGG | p.Ala677IlefsTer13 | p.A677Ifs*13 | O60231 | protein_coding | TCGA-A8-A08H-01 | Breast | breast invasive carcinoma | Female | >=65 | I/II | Unknown | Unknown | SD | ||
| DHX16 | insertion | In_Frame_Ins | novel | c.418_419insTATGTCATTGTTTTGGTTGTGCAT | p.Ala140delinsValCysHisCysPheGlyCysAlaSer | p.A140delinsVCHCFGCAS | O60231 | protein_coding | TCGA-A8-A08T-01 | Breast | breast invasive carcinoma | Female | <65 | III/IV | Unknown | Unknown | PD | ||
| DHX16 | deletion | Frame_Shift_Del | c.3097delN | p.Ile1033Ter | p.I1033* | O60231 | protein_coding | TCGA-AN-A0AK-01 | Breast | breast invasive carcinoma | Female | >=65 | I/II | Unknown | Unknown | SD | |||
| DHX16 | insertion | In_Frame_Ins | novel | c.2646_2647insGGGATTACAGGTGTGAGCCACCATGCCCAG | p.Leu882_Asn883insGlyIleThrGlyValSerHisHisAlaGln | p.L882_N883insGITGVSHHAQ | O60231 | protein_coding | TCGA-AN-A0FK-01 | Breast | breast invasive carcinoma | Female | >=65 | III/IV | Unknown | Unknown | SD | ||
| DHX16 | insertion | Nonsense_Mutation | novel | c.373_374insTGACCAATTTATCTCATATCTCTTCCTGAAATTGACTGT | p.Arg125delinsLeuThrAsnLeuSerHisIleSerSerTerAsnTerLeuTrp | p.R125delinsLTNLSHISS*N*LW | O60231 | protein_coding | TCGA-BH-A0B8-01 | Breast | breast invasive carcinoma | Female | <65 | I/II | Hormone Therapy | arimidex | SD | ||
| DHX16 | SNV | Missense_Mutation | novel | c.2114G>A | p.Gly705Asp | p.G705D | O60231 | protein_coding | deleterious(0) | possibly_damaging(0.893) | TCGA-2W-A8YY-01 | Cervix | cervical & endocervical cancer | Female | <65 | I/II | Chemotherapy | cisplatin | CR |
| DHX16 | SNV | Missense_Mutation | novel | c.121N>A | p.Glu41Lys | p.E41K | O60231 | protein_coding | tolerated(0.76) | benign(0.007) | TCGA-C5-A1MH-01 | Cervix | cervical & endocervical cancer | Female | >=65 | III/IV | Chemotherapy | cisplatin | PD |
| Page: 1 2 3 4 5 6 7 8 9 10 11 12 13 14 |
Top |
Related drugs of malignant transformation related genes |
| Identification of chemicals and drugs interact with genes involved in malignant transfromation |
| (DGIdb 4.0) |
| Entrez ID | Symbol | Category | Interaction Types | Drug Claim Name | Drug Name | PMIDs |
| Page: 1 |

Copyright 2023-Present -The University of Texas Health Science Center at Houston |