
|
|||||
|
 | |
| |
| |
| |
| |
| |
|
Gene: DHX15 |
Gene summary for DHX15 |
| Gene information | Species | Human | Gene symbol | DHX15 | Gene ID | 1665 |
| Gene name | DEAH-box helicase 15 | |
| Gene Alias | DBP1 | |
| Cytomap | 4p15.2 | |
| Gene Type | protein-coding | GO ID | GO:0006139 | UniProtAcc | O43143 |
Top |
Malignant transformation analysis |
| Identification of the aberrant gene expression in precancerous and cancerous lesions by comparing the gene expression of stem-like cells in diseased tissues with normal stem cells |
| Entrez ID | Symbol | Replicates | Species | Organ | Tissue | Adj P-value | Log2FC | Malignancy |
| 1665 | DHX15 | HTA11_3410_2000001011 | Human | Colorectum | AD | 2.82e-16 | -6.33e-01 | 0.0155 |
| 1665 | DHX15 | HTA11_2487_2000001011 | Human | Colorectum | SER | 4.33e-03 | -4.36e-01 | -0.1808 |
| 1665 | DHX15 | HTA11_3361_2000001011 | Human | Colorectum | AD | 6.34e-03 | -5.30e-01 | -0.1207 |
| 1665 | DHX15 | HTA11_696_2000001011 | Human | Colorectum | AD | 3.39e-09 | -4.29e-01 | -0.1464 |
| 1665 | DHX15 | HTA11_866_2000001011 | Human | Colorectum | AD | 1.02e-04 | -3.48e-01 | -0.1001 |
| 1665 | DHX15 | HTA11_866_3004761011 | Human | Colorectum | AD | 6.86e-03 | -3.91e-01 | 0.096 |
| 1665 | DHX15 | HTA11_10711_2000001011 | Human | Colorectum | AD | 1.19e-03 | -4.92e-01 | 0.0338 |
| 1665 | DHX15 | HTA11_7696_3000711011 | Human | Colorectum | AD | 1.54e-11 | -4.61e-01 | 0.0674 |
| 1665 | DHX15 | HTA11_99999974143_84620 | Human | Colorectum | MSS | 2.06e-10 | -4.47e-01 | 0.3005 |
| 1665 | DHX15 | F007 | Human | Colorectum | FAP | 2.16e-02 | -2.08e-01 | 0.1176 |
| 1665 | DHX15 | A002-C-010 | Human | Colorectum | FAP | 7.51e-03 | -1.40e-01 | 0.242 |
| 1665 | DHX15 | A001-C-207 | Human | Colorectum | FAP | 7.31e-03 | -2.27e-01 | 0.1278 |
| 1665 | DHX15 | A015-C-203 | Human | Colorectum | FAP | 5.09e-35 | -4.22e-01 | -0.1294 |
| 1665 | DHX15 | A015-C-204 | Human | Colorectum | FAP | 1.36e-04 | -3.13e-01 | -0.0228 |
| 1665 | DHX15 | A014-C-040 | Human | Colorectum | FAP | 3.02e-04 | -3.60e-01 | -0.1184 |
| 1665 | DHX15 | A002-C-201 | Human | Colorectum | FAP | 4.23e-14 | -3.28e-01 | 0.0324 |
| 1665 | DHX15 | A002-C-203 | Human | Colorectum | FAP | 1.92e-05 | -1.44e-01 | 0.2786 |
| 1665 | DHX15 | A001-C-119 | Human | Colorectum | FAP | 3.90e-05 | -4.18e-01 | -0.1557 |
| 1665 | DHX15 | A001-C-108 | Human | Colorectum | FAP | 6.18e-18 | -2.52e-01 | -0.0272 |
| 1665 | DHX15 | A002-C-205 | Human | Colorectum | FAP | 9.26e-21 | -4.20e-01 | -0.1236 |
| Page: 1 2 3 4 5 6 7 8 9 |
| Tissue | Expression Dynamics | Abbreviation |
| Colorectum (GSE201348) |  | FAP: Familial adenomatous polyposis |
| CRC: Colorectal cancer | ||
| Colorectum (HTA11) |  | AD: Adenomas |
| SER: Sessile serrated lesions | ||
| MSI-H: Microsatellite-high colorectal cancer | ||
| MSS: Microsatellite stable colorectal cancer | ||
| Esophagus |  | ESCC: Esophageal squamous cell carcinoma |
| HGIN: High-grade intraepithelial neoplasias | ||
| LGIN: Low-grade intraepithelial neoplasias | ||
| Liver | 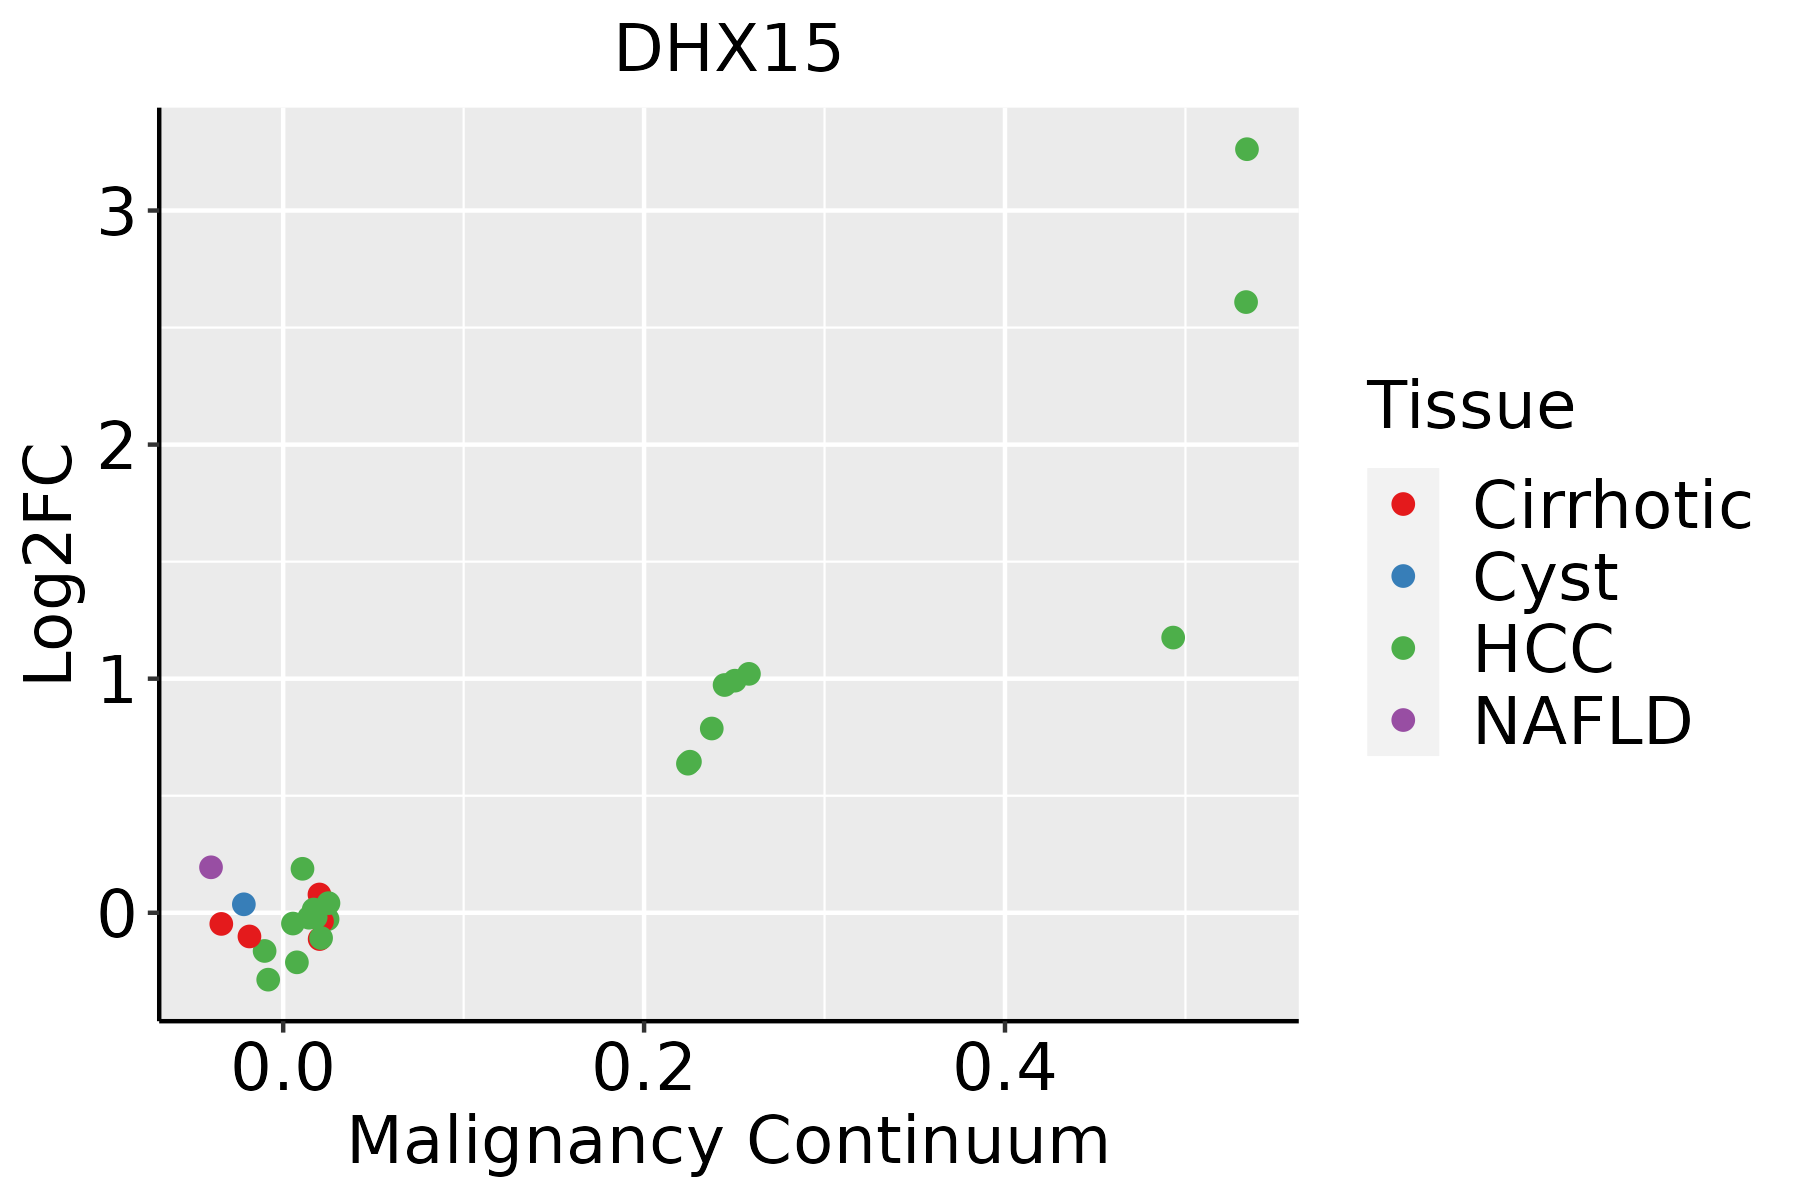 | HCC: Hepatocellular carcinoma |
| NAFLD: Non-alcoholic fatty liver disease | ||
| Lung | 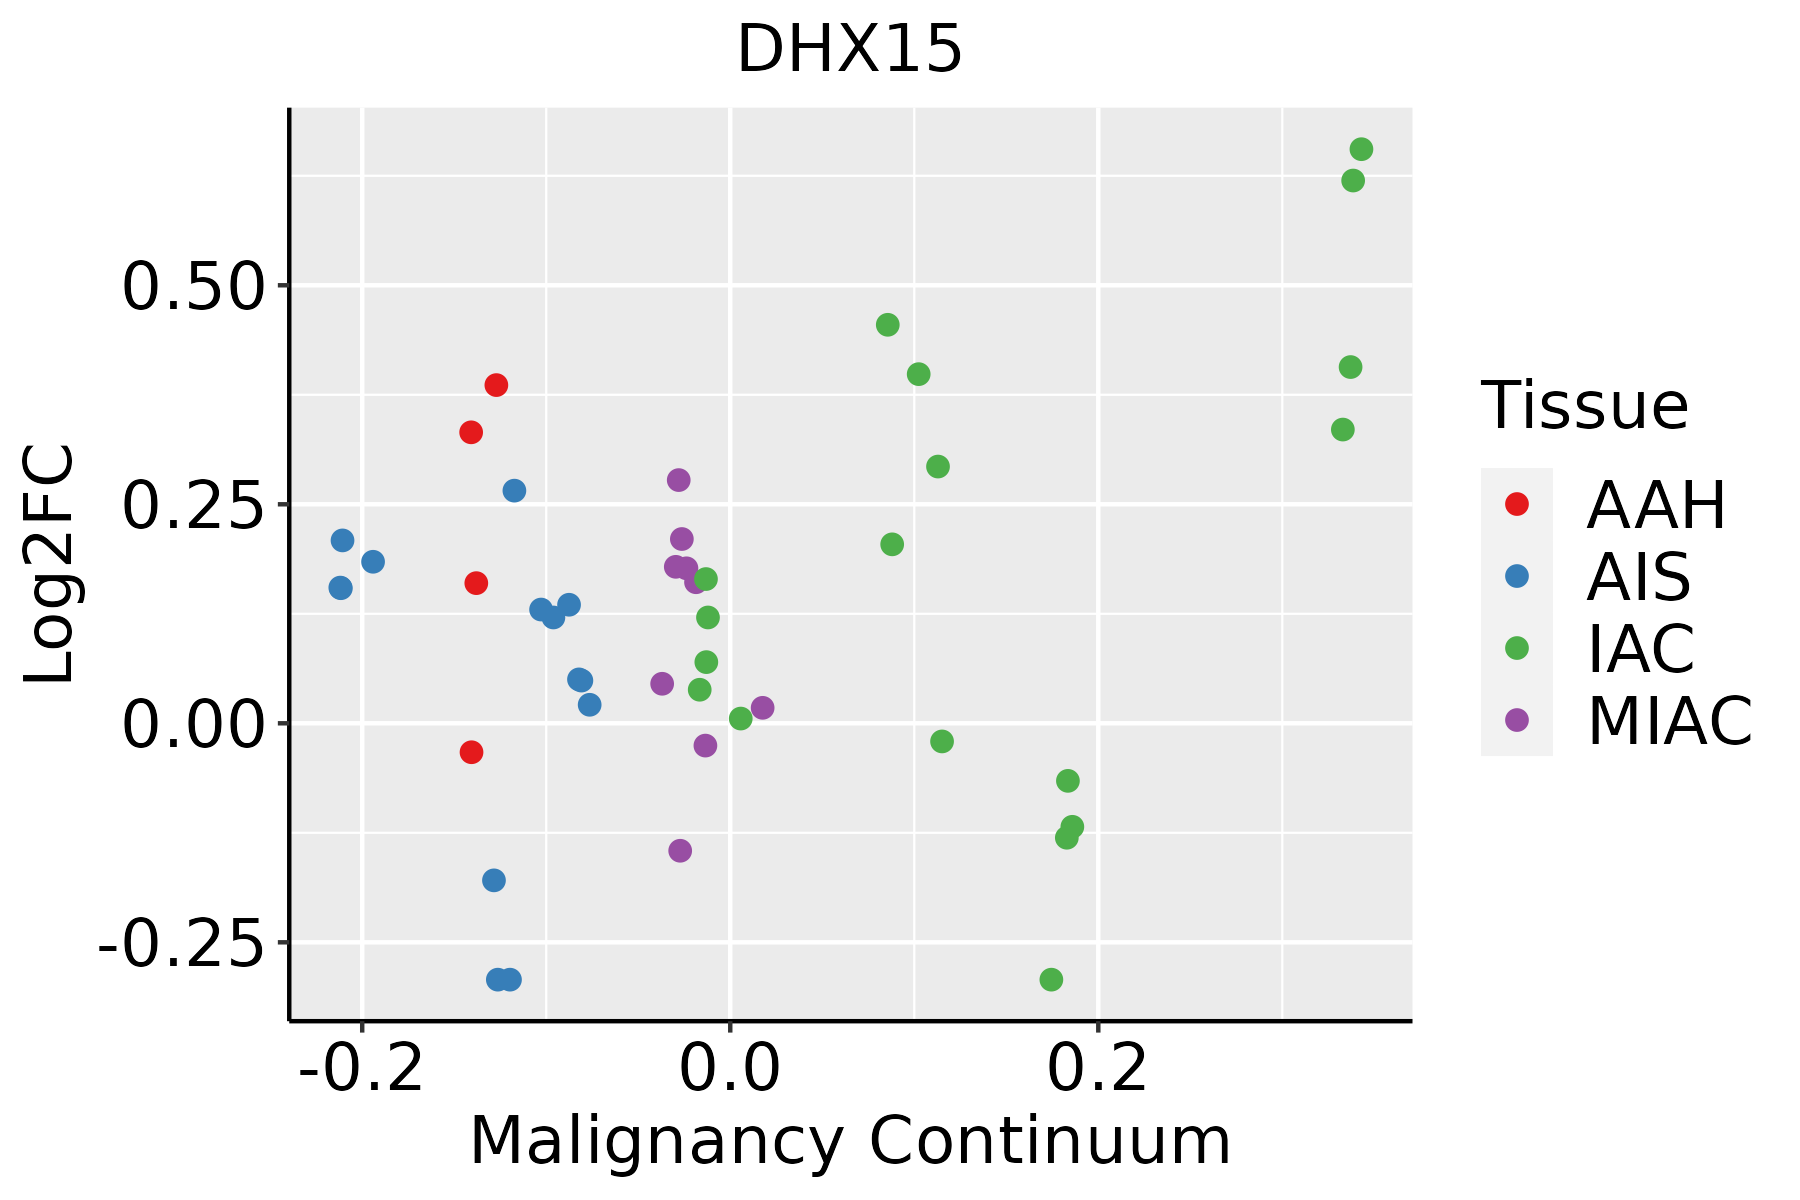 | AAH: Atypical adenomatous hyperplasia |
| AIS: Adenocarcinoma in situ | ||
| IAC: Invasive lung adenocarcinoma | ||
| MIA: Minimally invasive adenocarcinoma | ||
| Oral Cavity | 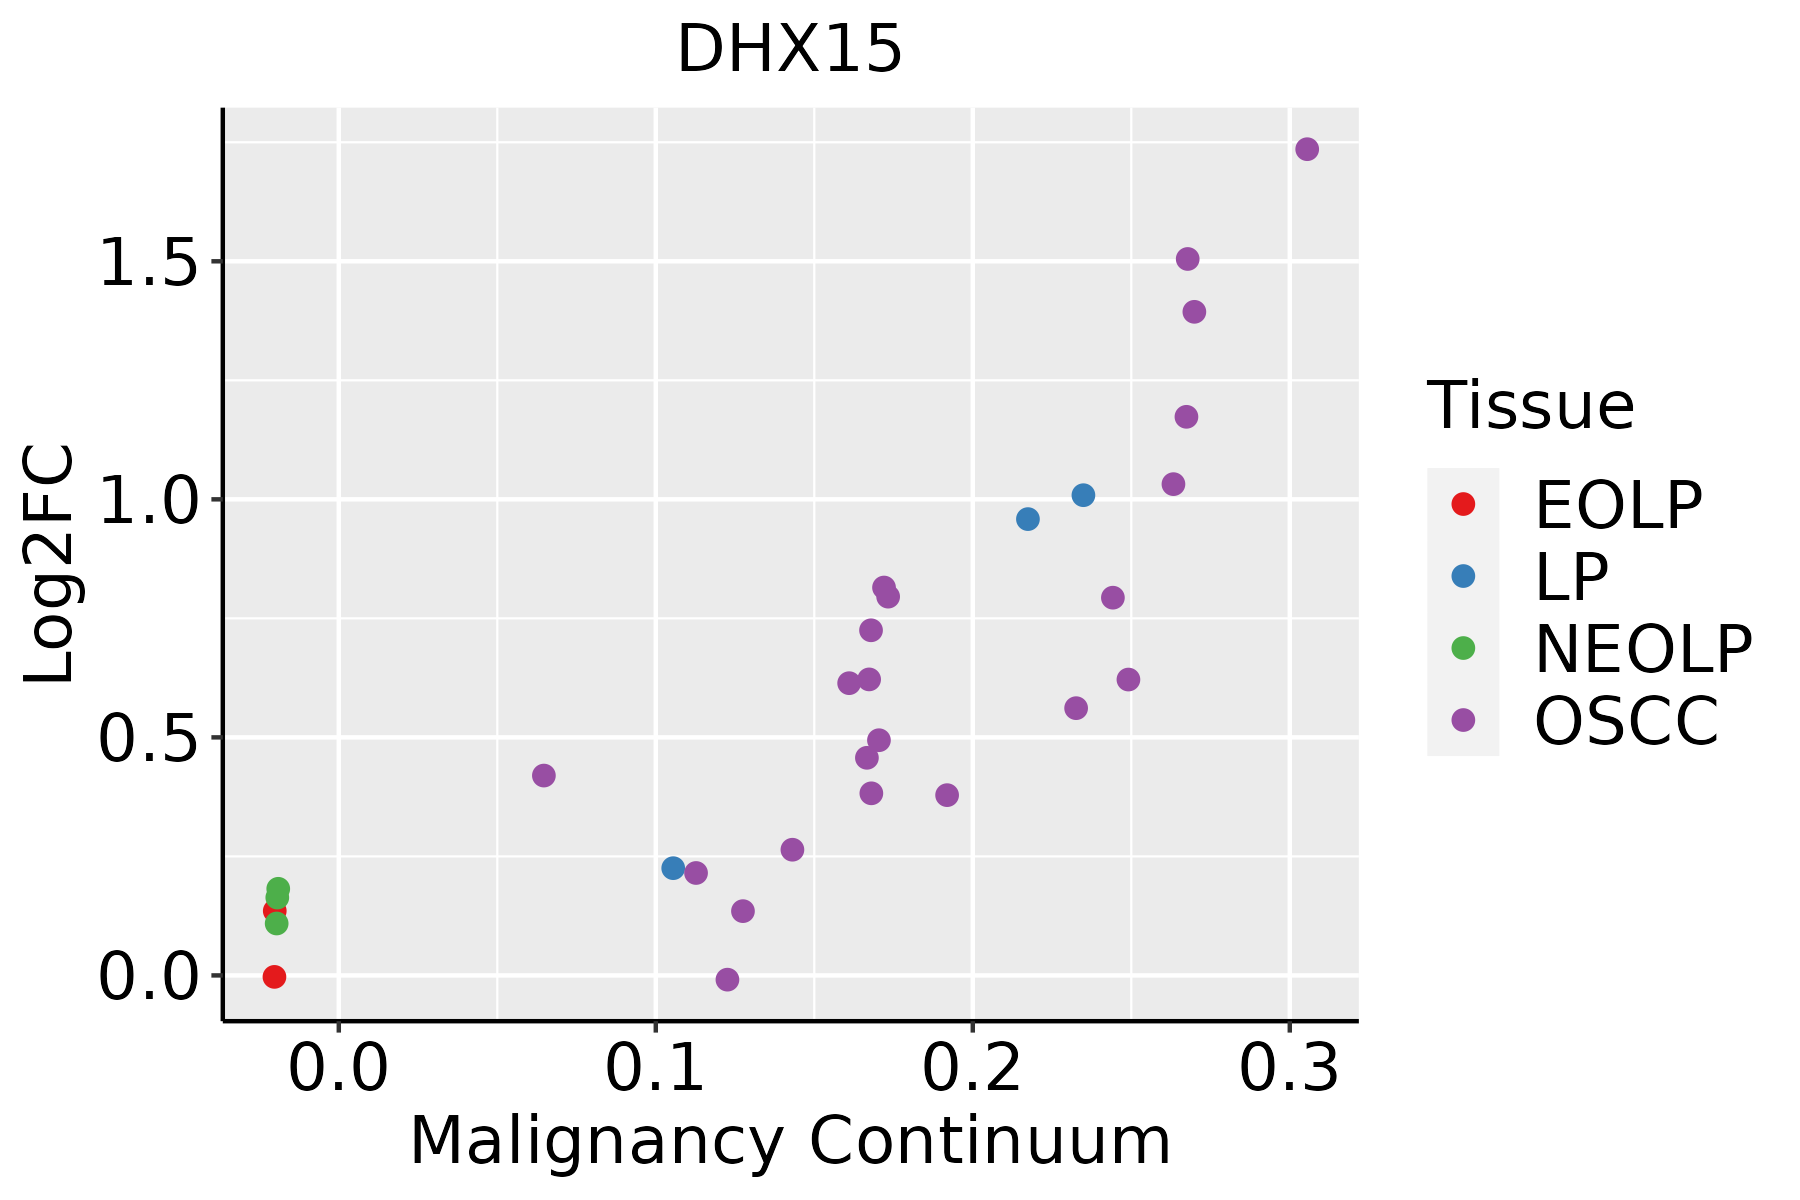 | EOLP: Erosive Oral lichen planus |
| LP: leukoplakia | ||
| NEOLP: Non-erosive oral lichen planus | ||
| OSCC: Oral squamous cell carcinoma | ||
| Skin |  | AK: Actinic keratosis |
| cSCC: Cutaneous squamous cell carcinoma | ||
| SCCIS:squamous cell carcinoma in situ | ||
| Thyroid | 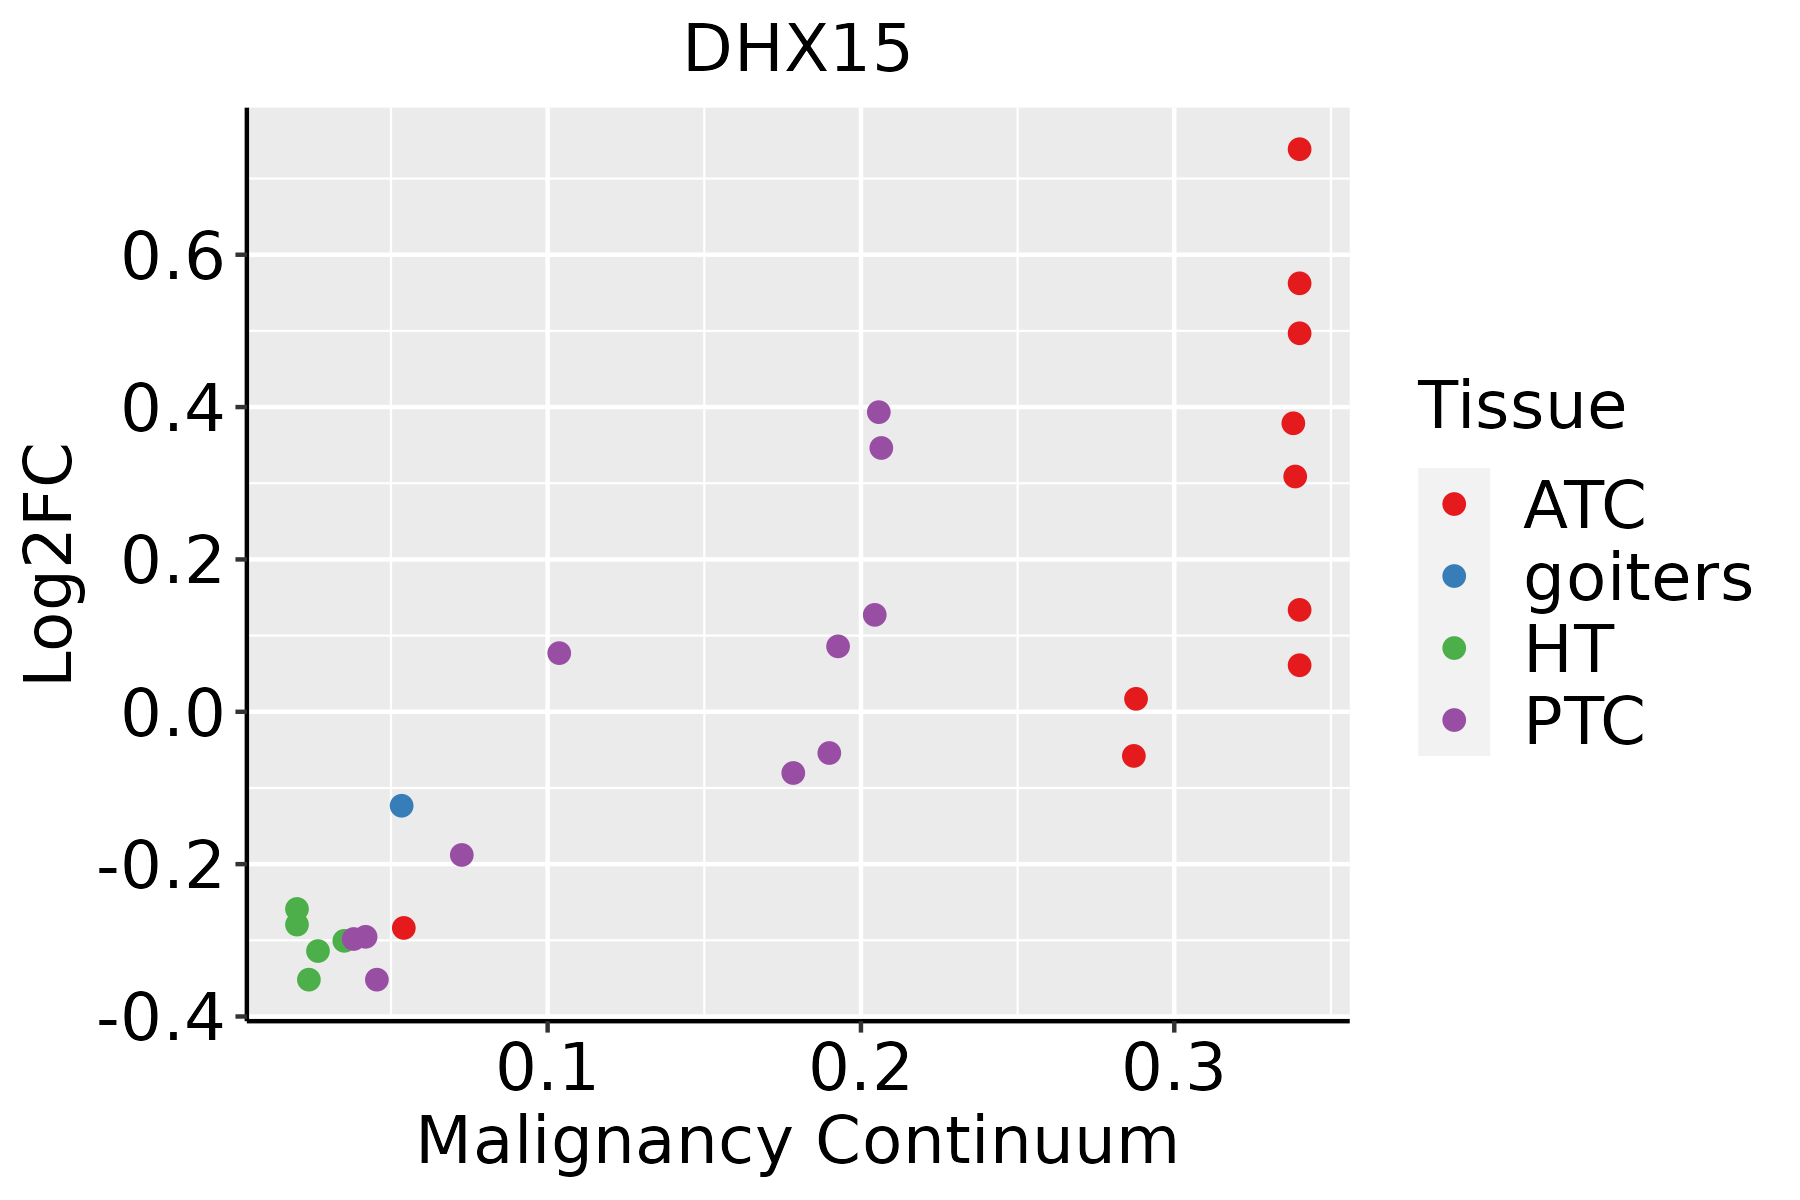 | ATC: Anaplastic thyroid cancer |
| HT: Hashimoto's thyroiditis | ||
| PTC: Papillary thyroid cancer |
| ∗log2FC in expression of this searched gene in stem-like cells from each diseased tissue sample relative to stem-like cells in normal samples in each tissue plotted against the malignancy continuum. Samples are colored based on if they are from different disease stage. |
Top |
Malignant transformation related pathway analysis |
| Find out the enriched GO biological processes and KEGG pathways involved in transition from healthy to precancer to cancer |
| Tissue | Disease Stage | Enriched GO biological Processes |
| Colorectum | AD |  |
| Colorectum | SER |  |
| Colorectum | MSS |  |
| Colorectum | MSI-H |  |
| Colorectum | FAP |  |
| ∗Top 15 enriched GO BP terms are showed in the bar plot of each disease state in each tissue. Each row represents a significant GO biological process which is colored according to the -log10(p.adjust). |
| Page: 1 2 3 4 5 6 7 8 9 |
| GO ID | Tissue | Disease Stage | Description | Gene Ratio | Bg Ratio | pvalue | p.adjust | Count |
| GO:0008380 | Colorectum | AD | RNA splicing | 169/3918 | 434/18723 | 3.59e-18 | 2.04e-15 | 169 |
| GO:0009636 | Colorectum | AD | response to toxic substance | 88/3918 | 262/18723 | 1.12e-06 | 3.72e-05 | 88 |
| GO:00083801 | Colorectum | SER | RNA splicing | 123/2897 | 434/18723 | 3.84e-12 | 8.41e-10 | 123 |
| GO:00096361 | Colorectum | SER | response to toxic substance | 71/2897 | 262/18723 | 8.63e-07 | 4.07e-05 | 71 |
| GO:00083802 | Colorectum | MSS | RNA splicing | 159/3467 | 434/18723 | 1.75e-19 | 1.22e-16 | 159 |
| GO:00096362 | Colorectum | MSS | response to toxic substance | 73/3467 | 262/18723 | 1.26e-04 | 1.94e-03 | 73 |
| GO:00083804 | Colorectum | FAP | RNA splicing | 108/2622 | 434/18723 | 7.90e-10 | 1.86e-07 | 108 |
| GO:00096363 | Colorectum | FAP | response to toxic substance | 53/2622 | 262/18723 | 3.35e-03 | 2.46e-02 | 53 |
| GO:00083805 | Colorectum | CRC | RNA splicing | 90/2078 | 434/18723 | 2.80e-09 | 7.97e-07 | 90 |
| GO:000838026 | Esophagus | HGIN | RNA splicing | 160/2587 | 434/18723 | 3.74e-34 | 1.12e-30 | 160 |
| GO:0008380111 | Esophagus | ESCC | RNA splicing | 336/8552 | 434/18723 | 1.74e-42 | 3.67e-39 | 336 |
| GO:000963620 | Esophagus | ESCC | response to toxic substance | 150/8552 | 262/18723 | 1.00e-04 | 7.12e-04 | 150 |
| GO:000838012 | Liver | Cirrhotic | RNA splicing | 229/4634 | 434/18723 | 9.13e-37 | 2.86e-33 | 229 |
| GO:000963612 | Liver | Cirrhotic | response to toxic substance | 104/4634 | 262/18723 | 5.63e-08 | 1.74e-06 | 104 |
| GO:000838022 | Liver | HCC | RNA splicing | 313/7958 | 434/18723 | 1.36e-36 | 1.73e-33 | 313 |
| GO:000963622 | Liver | HCC | response to toxic substance | 153/7958 | 262/18723 | 1.37e-07 | 2.58e-06 | 153 |
| GO:00432791 | Liver | HCC | response to alkaloid | 62/7958 | 115/18723 | 8.79e-03 | 3.42e-02 | 62 |
| GO:00083808 | Lung | IAC | RNA splicing | 75/2061 | 434/18723 | 4.89e-05 | 1.12e-03 | 75 |
| GO:000838013 | Lung | AIS | RNA splicing | 68/1849 | 434/18723 | 8.50e-05 | 2.11e-03 | 68 |
| GO:000838020 | Oral cavity | OSCC | RNA splicing | 308/7305 | 434/18723 | 2.43e-42 | 7.70e-39 | 308 |
| Page: 1 2 |
| Pathway ID | Tissue | Disease Stage | Description | Gene Ratio | Bg Ratio | pvalue | p.adjust | qvalue | Count |
| hsa03040 | Colorectum | AD | Spliceosome | 73/2092 | 217/8465 | 1.73e-03 | 9.68e-03 | 6.18e-03 | 73 |
| hsa030401 | Colorectum | AD | Spliceosome | 73/2092 | 217/8465 | 1.73e-03 | 9.68e-03 | 6.18e-03 | 73 |
| hsa030402 | Colorectum | MSS | Spliceosome | 66/1875 | 217/8465 | 2.58e-03 | 1.27e-02 | 7.81e-03 | 66 |
| hsa030403 | Colorectum | MSS | Spliceosome | 66/1875 | 217/8465 | 2.58e-03 | 1.27e-02 | 7.81e-03 | 66 |
| hsa0304018 | Esophagus | HGIN | Spliceosome | 79/1383 | 217/8465 | 3.22e-13 | 7.00e-12 | 5.56e-12 | 79 |
| hsa0304019 | Esophagus | HGIN | Spliceosome | 79/1383 | 217/8465 | 3.22e-13 | 7.00e-12 | 5.56e-12 | 79 |
| hsa0304027 | Esophagus | ESCC | Spliceosome | 128/4205 | 217/8465 | 3.31e-03 | 8.79e-03 | 4.50e-03 | 128 |
| hsa0304037 | Esophagus | ESCC | Spliceosome | 128/4205 | 217/8465 | 3.31e-03 | 8.79e-03 | 4.50e-03 | 128 |
| hsa030407 | Liver | Cirrhotic | Spliceosome | 102/2530 | 217/8465 | 5.69e-08 | 9.47e-07 | 5.84e-07 | 102 |
| hsa0304012 | Liver | Cirrhotic | Spliceosome | 102/2530 | 217/8465 | 5.69e-08 | 9.47e-07 | 5.84e-07 | 102 |
| hsa0304022 | Liver | HCC | Spliceosome | 122/4020 | 217/8465 | 5.55e-03 | 1.60e-02 | 8.91e-03 | 122 |
| hsa0304032 | Liver | HCC | Spliceosome | 122/4020 | 217/8465 | 5.55e-03 | 1.60e-02 | 8.91e-03 | 122 |
| hsa0304016 | Oral cavity | OSCC | Spliceosome | 123/3704 | 217/8465 | 7.21e-05 | 2.74e-04 | 1.40e-04 | 123 |
| hsa0304017 | Oral cavity | OSCC | Spliceosome | 123/3704 | 217/8465 | 7.21e-05 | 2.74e-04 | 1.40e-04 | 123 |
| hsa0304026 | Oral cavity | LP | Spliceosome | 106/2418 | 217/8465 | 1.30e-10 | 2.40e-09 | 1.55e-09 | 106 |
| hsa0304036 | Oral cavity | LP | Spliceosome | 106/2418 | 217/8465 | 1.30e-10 | 2.40e-09 | 1.55e-09 | 106 |
| Page: 1 |
Top |
Cell-cell communication analysis |
| Identification of potential cell-cell interactions between two cell types and their ligand-receptor pairs for different disease states |
| Ligand | Receptor | LRpair | Pathway | Tissue | Disease Stage |
| Page: 1 |
Top |
Single-cell gene regulatory network inference analysis |
| Find out the significant the regulons (TFs) and the target genes of each regulon across cell types for different disease states |
| TF | Cell Type | Tissue | Disease Stage | Target Gene | RSS | Regulon Activity |
| ∗The dot plots of a searched regulon are shown for all cell subpopulations in each disease state of each tissue based on the regulon specific score inferred using pySCENIC and by calculating the average expression. |
| Page: 1 |
Top |
Somatic mutation of malignant transformation related genes |
| Annotation of somatic variants for genes involved in malignant transformation |
| Hugo Symbol | Variant Class | Variant Classification | dbSNP RS | HGVSc | HGVSp | HGVSp Short | SWISSPROT | BIOTYPE | SIFT | PolyPhen | Tumor Sample Barcode | Tissue | Histology | Sex | Age | Stage | Therapy Types | Drugs | Outcome |
| DHX15 | SNV | Missense_Mutation | c.1861G>A | p.Asp621Asn | p.D621N | O43143 | protein_coding | tolerated(0.07) | probably_damaging(0.984) | TCGA-AN-A046-01 | Breast | breast invasive carcinoma | Female | >=65 | I/II | Unknown | Unknown | SD | |
| DHX15 | SNV | Missense_Mutation | novel | c.1714G>A | p.Ala572Thr | p.A572T | O43143 | protein_coding | deleterious(0) | probably_damaging(0.919) | TCGA-AN-A046-01 | Breast | breast invasive carcinoma | Female | >=65 | I/II | Unknown | Unknown | SD |
| DHX15 | SNV | Missense_Mutation | novel | c.1083A>C | p.Glu361Asp | p.E361D | O43143 | protein_coding | deleterious(0) | possibly_damaging(0.865) | TCGA-AN-A046-01 | Breast | breast invasive carcinoma | Female | >=65 | I/II | Unknown | Unknown | SD |
| DHX15 | SNV | Missense_Mutation | c.1495N>A | p.Tyr499Asn | p.Y499N | O43143 | protein_coding | deleterious(0) | probably_damaging(0.985) | TCGA-AN-A0XV-01 | Breast | breast invasive carcinoma | Female | >=65 | III/IV | Unknown | Unknown | SD | |
| DHX15 | SNV | Missense_Mutation | c.2021N>T | p.Pro674Leu | p.P674L | O43143 | protein_coding | tolerated(0.1) | benign(0.012) | TCGA-BH-A0HF-01 | Breast | breast invasive carcinoma | Female | >=65 | I/II | Hormone Therapy | arimidex | SD | |
| DHX15 | SNV | Missense_Mutation | c.1568T>C | p.Val523Ala | p.V523A | O43143 | protein_coding | deleterious(0.02) | possibly_damaging(0.697) | TCGA-BH-A18G-01 | Breast | breast invasive carcinoma | Female | >=65 | I/II | Unknown | Unknown | SD | |
| DHX15 | SNV | Missense_Mutation | novel | c.1511N>A | p.Arg504His | p.R504H | O43143 | protein_coding | deleterious(0) | probably_damaging(0.981) | TCGA-E9-A54X-01 | Breast | breast invasive carcinoma | Female | >=65 | I/II | Unknown | Unknown | SD |
| DHX15 | SNV | Missense_Mutation | novel | c.2221C>G | p.Leu741Val | p.L741V | O43143 | protein_coding | deleterious(0.02) | possibly_damaging(0.794) | TCGA-E9-A5FL-01 | Breast | breast invasive carcinoma | Female | >=65 | I/II | Unknown | Unknown | SD |
| DHX15 | insertion | Nonsense_Mutation | novel | c.1230_1231insATTCCTTTGCTAGTTGTCAGTCTTTTCAACTGACAAAAGGAA | p.Asn410_Gly411insIleProLeuLeuValValSerLeuPheAsnTerGlnLysGlu | p.N410_G411insIPLLVVSLFN*QKE | O43143 | protein_coding | TCGA-AR-A0TY-01 | Breast | breast invasive carcinoma | Female | <65 | I/II | Unspecific | Paclitaxel | PD | ||
| DHX15 | SNV | Missense_Mutation | c.178N>C | p.Glu60Gln | p.E60Q | O43143 | protein_coding | tolerated_low_confidence(0.46) | benign(0.031) | TCGA-JW-A5VL-01 | Cervix | cervical & endocervical cancer | Female | <65 | I/II | Unknown | Unknown | SD |
| Page: 1 2 3 4 5 6 7 8 9 10 11 |
Top |
Related drugs of malignant transformation related genes |
| Identification of chemicals and drugs interact with genes involved in malignant transfromation |
| (DGIdb 4.0) |
| Entrez ID | Symbol | Category | Interaction Types | Drug Claim Name | Drug Name | PMIDs |
| Page: 1 |

Copyright 2023-Present -The University of Texas Health Science Center at Houston |