
|
|||||
|
 | |
| |
| |
| |
| |
| |
|
Gene: DHTKD1 |
Gene summary for DHTKD1 |
| Gene information | Species | Human | Gene symbol | DHTKD1 | Gene ID | 55526 |
| Gene name | dehydrogenase E1 and transketolase domain containing 1 | |
| Gene Alias | AAKAD | |
| Cytomap | 10p14 | |
| Gene Type | protein-coding | GO ID | GO:0002244 | UniProtAcc | Q96HY7 |
Top |
Malignant transformation analysis |
| Identification of the aberrant gene expression in precancerous and cancerous lesions by comparing the gene expression of stem-like cells in diseased tissues with normal stem cells |
| Entrez ID | Symbol | Replicates | Species | Organ | Tissue | Adj P-value | Log2FC | Malignancy |
| 55526 | DHTKD1 | HTA11_347_2000001011 | Human | Colorectum | AD | 4.56e-05 | 3.64e-01 | -0.1954 |
| 55526 | DHTKD1 | HTA11_696_2000001011 | Human | Colorectum | AD | 1.17e-04 | 3.15e-01 | -0.1464 |
| 55526 | DHTKD1 | HTA11_1391_2000001011 | Human | Colorectum | AD | 9.93e-04 | 4.14e-01 | -0.059 |
| 55526 | DHTKD1 | HTA11_7696_3000711011 | Human | Colorectum | AD | 1.48e-07 | 4.75e-01 | 0.0674 |
| 55526 | DHTKD1 | HTA11_99999971662_82457 | Human | Colorectum | MSS | 1.42e-02 | 3.88e-01 | 0.3859 |
| 55526 | DHTKD1 | F007 | Human | Colorectum | FAP | 3.28e-02 | -2.20e-01 | 0.1176 |
| 55526 | DHTKD1 | A015-C-203 | Human | Colorectum | FAP | 1.09e-02 | -2.30e-02 | -0.1294 |
| 55526 | DHTKD1 | A002-C-201 | Human | Colorectum | FAP | 3.65e-02 | -1.19e-01 | 0.0324 |
| 55526 | DHTKD1 | A002-C-205 | Human | Colorectum | FAP | 1.50e-03 | -1.00e-01 | -0.1236 |
| 55526 | DHTKD1 | A015-C-104 | Human | Colorectum | FAP | 2.75e-04 | -4.12e-02 | -0.1899 |
| 55526 | DHTKD1 | A002-C-016 | Human | Colorectum | FAP | 2.86e-03 | -1.04e-01 | 0.0521 |
| 55526 | DHTKD1 | A002-C-116 | Human | Colorectum | FAP | 2.17e-05 | -9.99e-02 | -0.0452 |
| 55526 | DHTKD1 | A018-E-020 | Human | Colorectum | FAP | 2.39e-02 | -6.71e-02 | -0.2034 |
| 55526 | DHTKD1 | F034 | Human | Colorectum | FAP | 4.13e-02 | -9.58e-02 | -0.0665 |
| 55526 | DHTKD1 | LZE2T | Human | Esophagus | ESCC | 1.33e-03 | 4.75e-01 | 0.082 |
| 55526 | DHTKD1 | LZE5T | Human | Esophagus | ESCC | 6.66e-03 | 2.21e-01 | 0.0514 |
| 55526 | DHTKD1 | LZE8T | Human | Esophagus | ESCC | 1.45e-02 | 4.55e-02 | 0.067 |
| 55526 | DHTKD1 | LZE24T | Human | Esophagus | ESCC | 3.97e-10 | 2.61e-01 | 0.0596 |
| 55526 | DHTKD1 | P2T-E | Human | Esophagus | ESCC | 5.72e-23 | 4.94e-01 | 0.1177 |
| 55526 | DHTKD1 | P4T-E | Human | Esophagus | ESCC | 1.20e-12 | 2.76e-01 | 0.1323 |
| Page: 1 2 3 4 5 |
| Tissue | Expression Dynamics | Abbreviation |
| Colorectum (GSE201348) |  | FAP: Familial adenomatous polyposis |
| CRC: Colorectal cancer | ||
| Colorectum (HTA11) |  | AD: Adenomas |
| SER: Sessile serrated lesions | ||
| MSI-H: Microsatellite-high colorectal cancer | ||
| MSS: Microsatellite stable colorectal cancer | ||
| Esophagus | 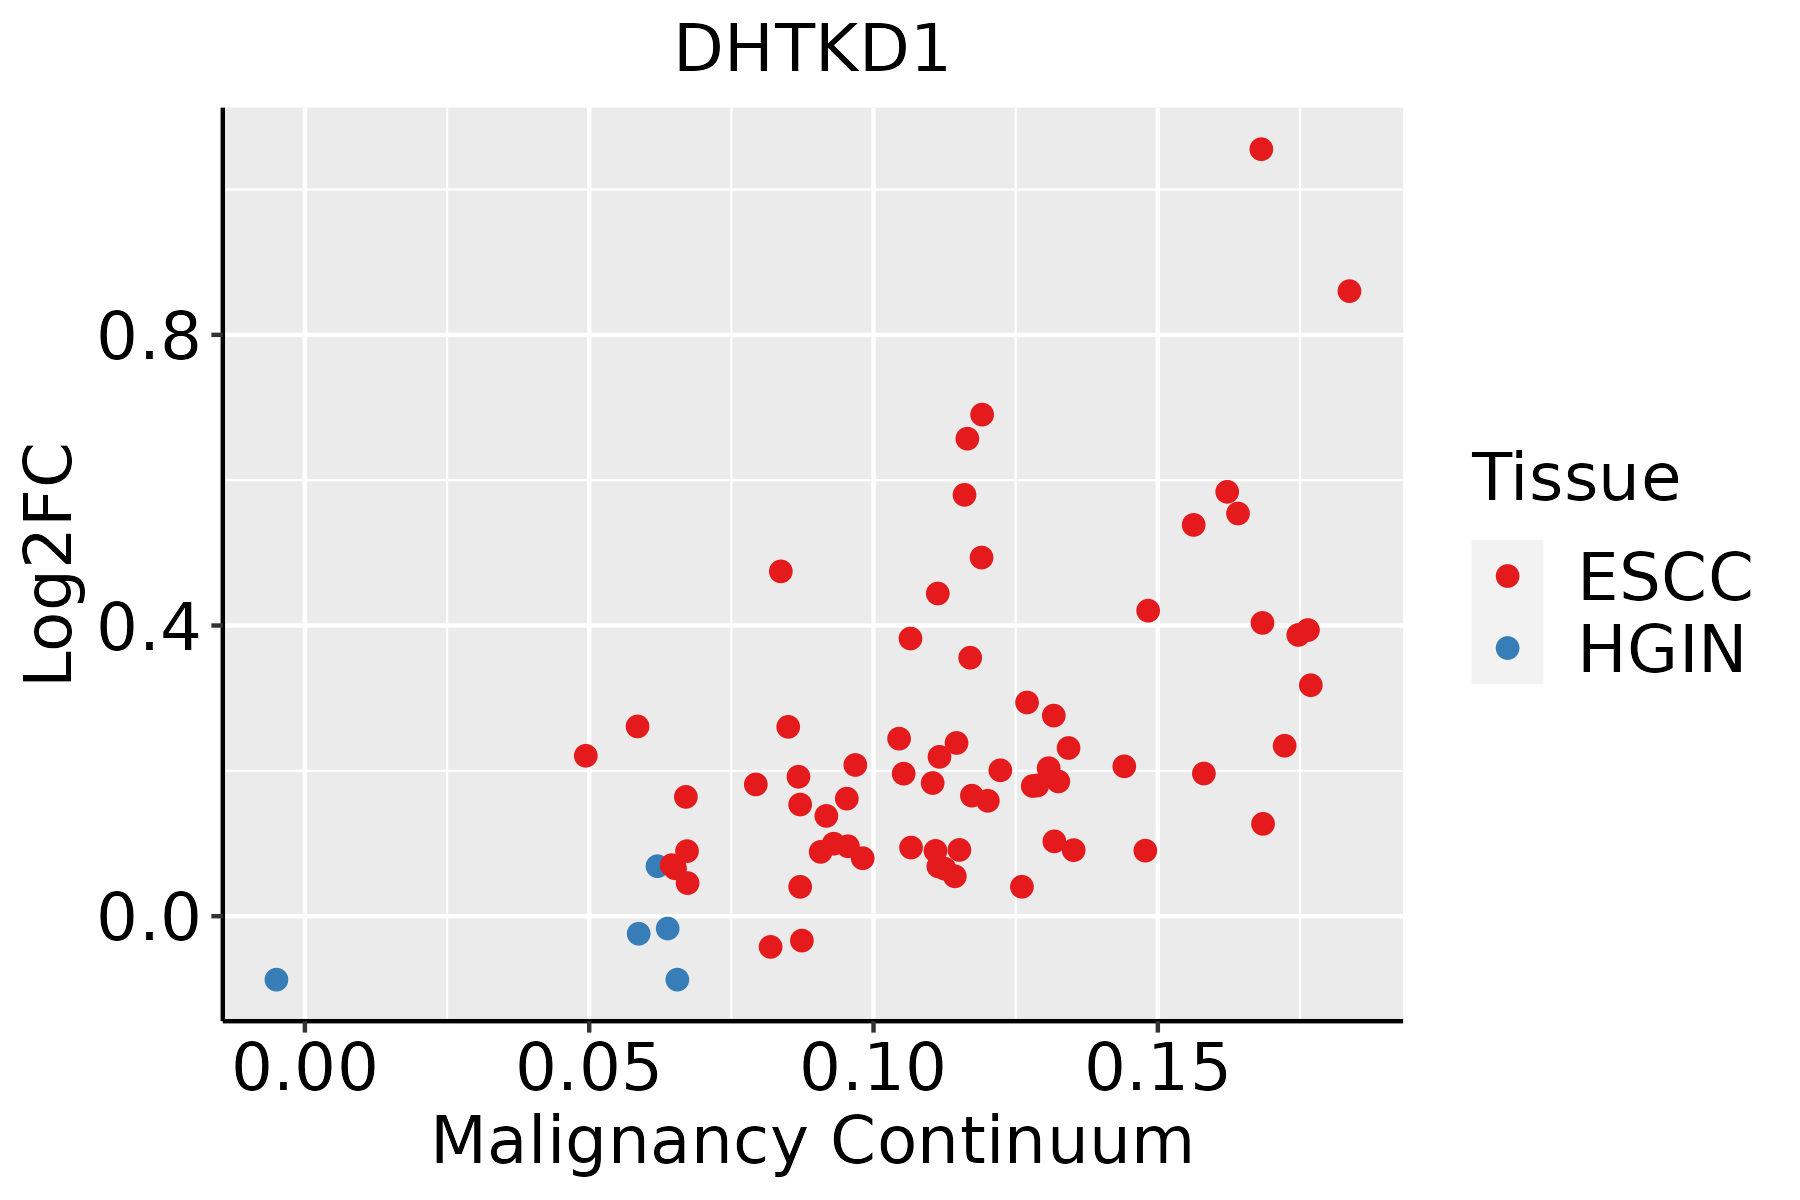 | ESCC: Esophageal squamous cell carcinoma |
| HGIN: High-grade intraepithelial neoplasias | ||
| LGIN: Low-grade intraepithelial neoplasias | ||
| Liver |  | HCC: Hepatocellular carcinoma |
| NAFLD: Non-alcoholic fatty liver disease | ||
| Oral Cavity | 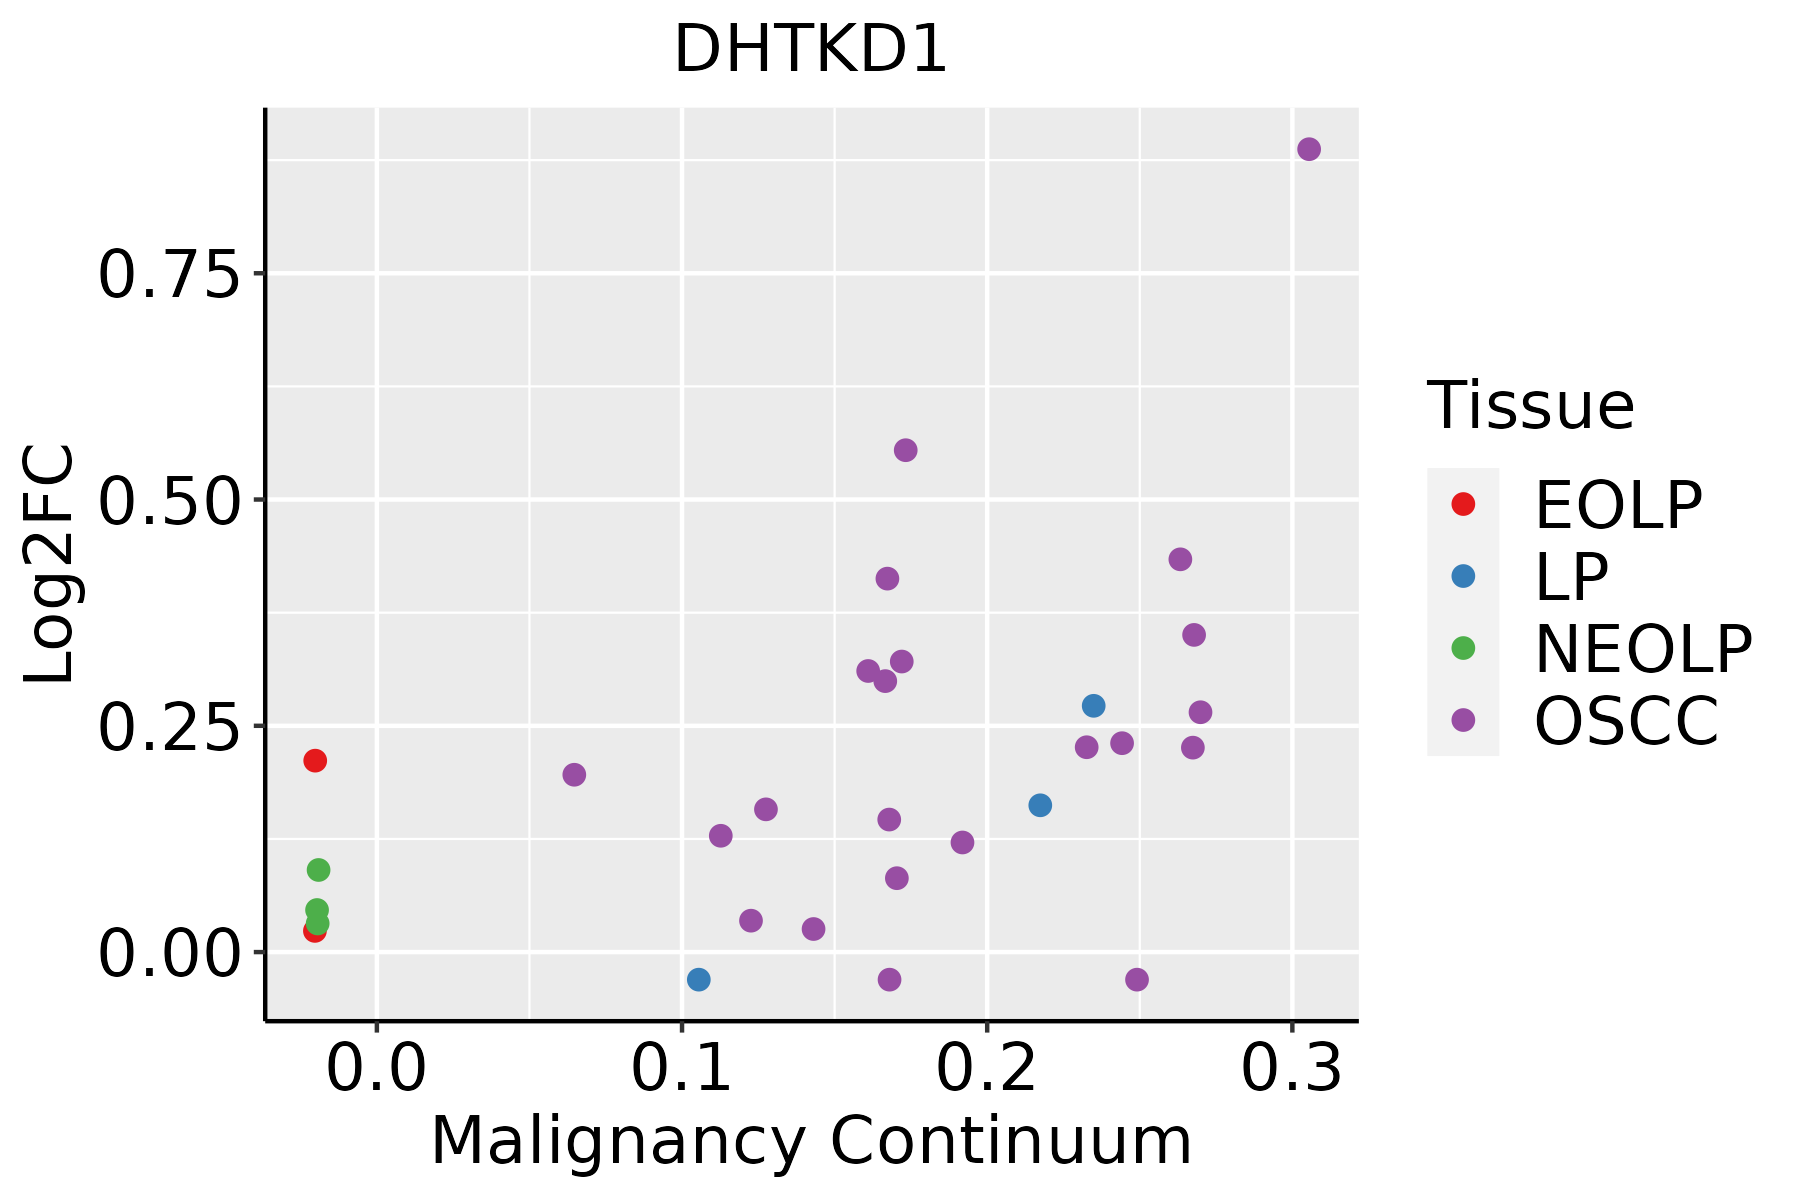 | EOLP: Erosive Oral lichen planus |
| LP: leukoplakia | ||
| NEOLP: Non-erosive oral lichen planus | ||
| OSCC: Oral squamous cell carcinoma | ||
| Prostate |  | BPH: Benign Prostatic Hyperplasia |
| ∗log2FC in expression of this searched gene in stem-like cells from each diseased tissue sample relative to stem-like cells in normal samples in each tissue plotted against the malignancy continuum. Samples are colored based on if they are from different disease stage. |
Top |
Malignant transformation related pathway analysis |
| Find out the enriched GO biological processes and KEGG pathways involved in transition from healthy to precancer to cancer |
| Tissue | Disease Stage | Enriched GO biological Processes |
| Colorectum | AD |  |
| Colorectum | SER |  |
| Colorectum | MSS |  |
| Colorectum | MSI-H |  |
| Colorectum | FAP |  |
| ∗Top 15 enriched GO BP terms are showed in the bar plot of each disease state in each tissue. Each row represents a significant GO biological process which is colored according to the -log10(p.adjust). |
| Page: 1 2 3 4 5 6 7 8 9 |
| GO ID | Tissue | Disease Stage | Description | Gene Ratio | Bg Ratio | pvalue | p.adjust | Count |
| GO:0046034 | Colorectum | AD | ATP metabolic process | 142/3918 | 277/18723 | 2.64e-29 | 8.26e-26 | 142 |
| GO:0006091 | Colorectum | AD | generation of precursor metabolites and energy | 209/3918 | 490/18723 | 3.17e-28 | 6.61e-25 | 209 |
| GO:0009060 | Colorectum | AD | aerobic respiration | 108/3918 | 189/18723 | 9.14e-28 | 1.43e-24 | 108 |
| GO:0045333 | Colorectum | AD | cellular respiration | 119/3918 | 230/18723 | 3.21e-25 | 4.02e-22 | 119 |
| GO:0015980 | Colorectum | AD | energy derivation by oxidation of organic compounds | 143/3918 | 318/18723 | 2.78e-22 | 2.49e-19 | 143 |
| GO:0009150 | Colorectum | AD | purine ribonucleotide metabolic process | 142/3918 | 368/18723 | 4.29e-15 | 1.17e-12 | 142 |
| GO:0006163 | Colorectum | AD | purine nucleotide metabolic process | 149/3918 | 396/18723 | 1.08e-14 | 2.80e-12 | 149 |
| GO:0072521 | Colorectum | AD | purine-containing compound metabolic process | 153/3918 | 416/18723 | 4.34e-14 | 1.01e-11 | 153 |
| GO:0009259 | Colorectum | AD | ribonucleotide metabolic process | 144/3918 | 385/18723 | 5.25e-14 | 1.13e-11 | 144 |
| GO:0019693 | Colorectum | AD | ribose phosphate metabolic process | 145/3918 | 396/18723 | 3.01e-13 | 5.71e-11 | 145 |
| GO:0009117 | Colorectum | AD | nucleotide metabolic process | 168/3918 | 489/18723 | 2.20e-12 | 3.36e-10 | 168 |
| GO:0006753 | Colorectum | AD | nucleoside phosphate metabolic process | 169/3918 | 497/18723 | 4.99e-12 | 6.98e-10 | 169 |
| GO:0009135 | Colorectum | AD | purine nucleoside diphosphate metabolic process | 47/3918 | 103/18723 | 1.61e-08 | 9.22e-07 | 47 |
| GO:0009179 | Colorectum | AD | purine ribonucleoside diphosphate metabolic process | 47/3918 | 103/18723 | 1.61e-08 | 9.22e-07 | 47 |
| GO:0006090 | Colorectum | AD | pyruvate metabolic process | 47/3918 | 106/18723 | 4.85e-08 | 2.55e-06 | 47 |
| GO:0009185 | Colorectum | AD | ribonucleoside diphosphate metabolic process | 47/3918 | 106/18723 | 4.85e-08 | 2.55e-06 | 47 |
| GO:0046031 | Colorectum | AD | ADP metabolic process | 41/3918 | 90/18723 | 1.37e-07 | 6.42e-06 | 41 |
| GO:0006096 | Colorectum | AD | glycolytic process | 38/3918 | 81/18723 | 1.52e-07 | 6.78e-06 | 38 |
| GO:0006757 | Colorectum | AD | ATP generation from ADP | 38/3918 | 82/18723 | 2.26e-07 | 9.37e-06 | 38 |
| GO:0006099 | Colorectum | AD | tricarboxylic acid cycle | 19/3918 | 30/18723 | 5.82e-07 | 2.09e-05 | 19 |
| Page: 1 2 3 4 5 6 7 8 9 10 11 12 |
| Pathway ID | Tissue | Disease Stage | Description | Gene Ratio | Bg Ratio | pvalue | p.adjust | qvalue | Count |
| hsa00310 | Colorectum | AD | Lysine degradation | 27/2092 | 63/8465 | 1.17e-03 | 7.75e-03 | 4.94e-03 | 27 |
| hsa003101 | Colorectum | AD | Lysine degradation | 27/2092 | 63/8465 | 1.17e-03 | 7.75e-03 | 4.94e-03 | 27 |
| hsa003102 | Colorectum | MSS | Lysine degradation | 24/1875 | 63/8465 | 2.94e-03 | 1.39e-02 | 8.50e-03 | 24 |
| hsa003103 | Colorectum | MSS | Lysine degradation | 24/1875 | 63/8465 | 2.94e-03 | 1.39e-02 | 8.50e-03 | 24 |
| hsa003104 | Colorectum | FAP | Lysine degradation | 23/1404 | 63/8465 | 1.04e-04 | 9.46e-04 | 5.76e-04 | 23 |
| hsa003105 | Colorectum | FAP | Lysine degradation | 23/1404 | 63/8465 | 1.04e-04 | 9.46e-04 | 5.76e-04 | 23 |
| hsa0031010 | Esophagus | ESCC | Lysine degradation | 41/4205 | 63/8465 | 9.63e-03 | 2.27e-02 | 1.16e-02 | 41 |
| hsa0031013 | Esophagus | ESCC | Lysine degradation | 41/4205 | 63/8465 | 9.63e-03 | 2.27e-02 | 1.16e-02 | 41 |
| hsa003108 | Liver | NAFLD | Lysine degradation | 21/1043 | 63/8465 | 1.09e-05 | 3.58e-04 | 2.89e-04 | 21 |
| hsa0031011 | Liver | NAFLD | Lysine degradation | 21/1043 | 63/8465 | 1.09e-05 | 3.58e-04 | 2.89e-04 | 21 |
| hsa003802 | Liver | Cirrhotic | Tryptophan metabolism | 22/2530 | 42/8465 | 1.85e-03 | 8.37e-03 | 5.16e-03 | 22 |
| hsa0031021 | Liver | Cirrhotic | Lysine degradation | 29/2530 | 63/8465 | 4.81e-03 | 1.74e-02 | 1.07e-02 | 29 |
| hsa0038011 | Liver | Cirrhotic | Tryptophan metabolism | 22/2530 | 42/8465 | 1.85e-03 | 8.37e-03 | 5.16e-03 | 22 |
| hsa0031031 | Liver | Cirrhotic | Lysine degradation | 29/2530 | 63/8465 | 4.81e-03 | 1.74e-02 | 1.07e-02 | 29 |
| hsa0031041 | Liver | HCC | Lysine degradation | 47/4020 | 63/8465 | 1.02e-05 | 7.58e-05 | 4.22e-05 | 47 |
| hsa00785 | Liver | HCC | Lipoic acid metabolism | 14/4020 | 19/8465 | 1.89e-02 | 4.40e-02 | 2.45e-02 | 14 |
| hsa0031051 | Liver | HCC | Lysine degradation | 47/4020 | 63/8465 | 1.02e-05 | 7.58e-05 | 4.22e-05 | 47 |
| hsa007851 | Liver | HCC | Lipoic acid metabolism | 14/4020 | 19/8465 | 1.89e-02 | 4.40e-02 | 2.45e-02 | 14 |
| Page: 1 |
Top |
Cell-cell communication analysis |
| Identification of potential cell-cell interactions between two cell types and their ligand-receptor pairs for different disease states |
| Ligand | Receptor | LRpair | Pathway | Tissue | Disease Stage |
| Page: 1 |
Top |
Single-cell gene regulatory network inference analysis |
| Find out the significant the regulons (TFs) and the target genes of each regulon across cell types for different disease states |
| TF | Cell Type | Tissue | Disease Stage | Target Gene | RSS | Regulon Activity |
| ∗The dot plots of a searched regulon are shown for all cell subpopulations in each disease state of each tissue based on the regulon specific score inferred using pySCENIC and by calculating the average expression. |
| Page: 1 |
Top |
Somatic mutation of malignant transformation related genes |
| Annotation of somatic variants for genes involved in malignant transformation |
| Hugo Symbol | Variant Class | Variant Classification | dbSNP RS | HGVSc | HGVSp | HGVSp Short | SWISSPROT | BIOTYPE | SIFT | PolyPhen | Tumor Sample Barcode | Tissue | Histology | Sex | Age | Stage | Therapy Types | Drugs | Outcome |
| DHTKD1 | SNV | Missense_Mutation | novel | c.1499N>T | p.Pro500Leu | p.P500L | Q96HY7 | protein_coding | deleterious(0) | probably_damaging(0.993) | TCGA-A7-A6VW-01 | Breast | breast invasive carcinoma | Female | <65 | I/II | Chemotherapy | doxorubicin | CR |
| DHTKD1 | SNV | Missense_Mutation | rs759869851 | c.1249C>T | p.Arg417Cys | p.R417C | Q96HY7 | protein_coding | deleterious(0) | probably_damaging(0.985) | TCGA-A8-A06R-01 | Breast | breast invasive carcinoma | Female | >=65 | I/II | Chemotherapy | 5-fluorouracil | CR |
| DHTKD1 | SNV | Missense_Mutation | c.624N>A | p.Met208Ile | p.M208I | Q96HY7 | protein_coding | tolerated(0.44) | benign(0.003) | TCGA-BH-A0AY-01 | Breast | breast invasive carcinoma | Female | <65 | I/II | Chemotherapy | SD | ||
| DHTKD1 | SNV | Missense_Mutation | c.1849N>C | p.Tyr617His | p.Y617H | Q96HY7 | protein_coding | tolerated(0.43) | benign(0.012) | TCGA-D8-A1XQ-01 | Breast | breast invasive carcinoma | Female | >=65 | I/II | Unknown | Unknown | SD | |
| DHTKD1 | insertion | Nonsense_Mutation | novel | c.1346_1347insATTGTTTGTGCATTCACTCATCGAACCTTTG | p.Tyr449Ter | p.Y449* | Q96HY7 | protein_coding | TCGA-A8-A07U-01 | Breast | breast invasive carcinoma | Female | >=65 | III/IV | Chemotherapy | 5-fluorouracil | SD | ||
| DHTKD1 | insertion | Frame_Shift_Ins | novel | c.2572_2572+1insAT | p.His859IlefsTer43 | p.H859Ifs*43 | Q96HY7 | protein_coding | TCGA-A8-A0A4-01 | Breast | breast invasive carcinoma | Female | >=65 | I/II | Hormone Therapy | tamoxiphen | CR | ||
| DHTKD1 | insertion | Frame_Shift_Ins | novel | c.1998_1999insCCAACTTTTCTCATCT | p.Asp667ProfsTer6 | p.D667Pfs*6 | Q96HY7 | protein_coding | TCGA-BH-A0E2-01 | Breast | breast invasive carcinoma | Female | <65 | III/IV | Chemotherapy | doxorubicin | SD | ||
| DHTKD1 | deletion | Frame_Shift_Del | novel | c.360delC | p.Tyr121IlefsTer49 | p.Y121Ifs*49 | Q96HY7 | protein_coding | TCGA-D8-A27V-01 | Breast | breast invasive carcinoma | Female | <65 | I/II | Hormone Therapy | tamoxiphen | SD | ||
| DHTKD1 | deletion | Frame_Shift_Del | novel | c.504delA | p.Lys168AsnfsTer2 | p.K168Nfs*2 | Q96HY7 | protein_coding | TCGA-D8-A27V-01 | Breast | breast invasive carcinoma | Female | <65 | I/II | Hormone Therapy | tamoxiphen | SD | ||
| DHTKD1 | SNV | Missense_Mutation | novel | c.331G>A | p.Glu111Lys | p.E111K | Q96HY7 | protein_coding | tolerated(0.48) | benign(0.003) | TCGA-2W-A8YY-01 | Cervix | cervical & endocervical cancer | Female | <65 | I/II | Chemotherapy | cisplatin | CR |
| Page: 1 2 3 4 5 6 7 8 9 |
Top |
Related drugs of malignant transformation related genes |
| Identification of chemicals and drugs interact with genes involved in malignant transfromation |
| (DGIdb 4.0) |
| Entrez ID | Symbol | Category | Interaction Types | Drug Claim Name | Drug Name | PMIDs |
| Page: 1 |

Copyright 2023-Present -The University of Texas Health Science Center at Houston |