
|
|||||
|
 | |
| |
| |
| |
| |
| |
|
Gene: DHRSX |
Gene summary for DHRSX |
| Gene information | Species | Human | Gene symbol | DHRSX | Gene ID | 207063 |
| Gene name | dehydrogenase/reductase X-linked | |
| Gene Alias | CXorf11 | |
| Cytomap | Xp22.33 | |
| Gene Type | protein-coding | GO ID | GO:0006914 | UniProtAcc | Q8N5I4 |
Top |
Malignant transformation analysis |
| Identification of the aberrant gene expression in precancerous and cancerous lesions by comparing the gene expression of stem-like cells in diseased tissues with normal stem cells |
| Entrez ID | Symbol | Replicates | Species | Organ | Tissue | Adj P-value | Log2FC | Malignancy |
| 207063 | DHRSX | HTA11_3410_2000001011 | Human | Colorectum | AD | 5.61e-05 | -3.41e-01 | 0.0155 |
| 207063 | DHRSX | HTA11_347_2000001011 | Human | Colorectum | AD | 2.86e-04 | 4.98e-01 | -0.1954 |
| 207063 | DHRSX | HTA11_99999971662_82457 | Human | Colorectum | MSS | 5.48e-09 | 9.17e-01 | 0.3859 |
| 207063 | DHRSX | A015-C-203 | Human | Colorectum | FAP | 1.24e-21 | -2.35e-01 | -0.1294 |
| 207063 | DHRSX | A015-C-204 | Human | Colorectum | FAP | 7.41e-06 | -2.35e-01 | -0.0228 |
| 207063 | DHRSX | A014-C-040 | Human | Colorectum | FAP | 3.60e-06 | -3.79e-01 | -0.1184 |
| 207063 | DHRSX | A002-C-201 | Human | Colorectum | FAP | 7.07e-14 | -1.39e-01 | 0.0324 |
| 207063 | DHRSX | A001-C-119 | Human | Colorectum | FAP | 2.59e-11 | 2.54e-01 | -0.1557 |
| 207063 | DHRSX | A001-C-108 | Human | Colorectum | FAP | 1.19e-10 | -6.84e-02 | -0.0272 |
| 207063 | DHRSX | A002-C-205 | Human | Colorectum | FAP | 1.50e-23 | -7.91e-02 | -0.1236 |
| 207063 | DHRSX | A015-C-006 | Human | Colorectum | FAP | 2.67e-17 | -2.74e-01 | -0.0994 |
| 207063 | DHRSX | A015-C-106 | Human | Colorectum | FAP | 3.60e-06 | -9.28e-02 | -0.0511 |
| 207063 | DHRSX | A002-C-114 | Human | Colorectum | FAP | 3.49e-21 | -1.64e-01 | -0.1561 |
| 207063 | DHRSX | A015-C-104 | Human | Colorectum | FAP | 3.41e-21 | -2.93e-01 | -0.1899 |
| 207063 | DHRSX | A001-C-014 | Human | Colorectum | FAP | 7.28e-07 | -8.58e-02 | 0.0135 |
| 207063 | DHRSX | A002-C-016 | Human | Colorectum | FAP | 1.74e-15 | -2.70e-01 | 0.0521 |
| 207063 | DHRSX | A015-C-002 | Human | Colorectum | FAP | 1.32e-13 | -2.86e-01 | -0.0763 |
| 207063 | DHRSX | A001-C-203 | Human | Colorectum | FAP | 2.28e-05 | 9.99e-03 | -0.0481 |
| 207063 | DHRSX | A002-C-116 | Human | Colorectum | FAP | 1.70e-29 | -1.67e-01 | -0.0452 |
| 207063 | DHRSX | A014-C-008 | Human | Colorectum | FAP | 6.05e-16 | -2.45e-01 | -0.191 |
| Page: 1 2 3 4 5 6 7 8 9 |
| Tissue | Expression Dynamics | Abbreviation |
| Colorectum (GSE201348) |  | FAP: Familial adenomatous polyposis |
| CRC: Colorectal cancer | ||
| Colorectum (HTA11) |  | AD: Adenomas |
| SER: Sessile serrated lesions | ||
| MSI-H: Microsatellite-high colorectal cancer | ||
| MSS: Microsatellite stable colorectal cancer | ||
| Endometrium | 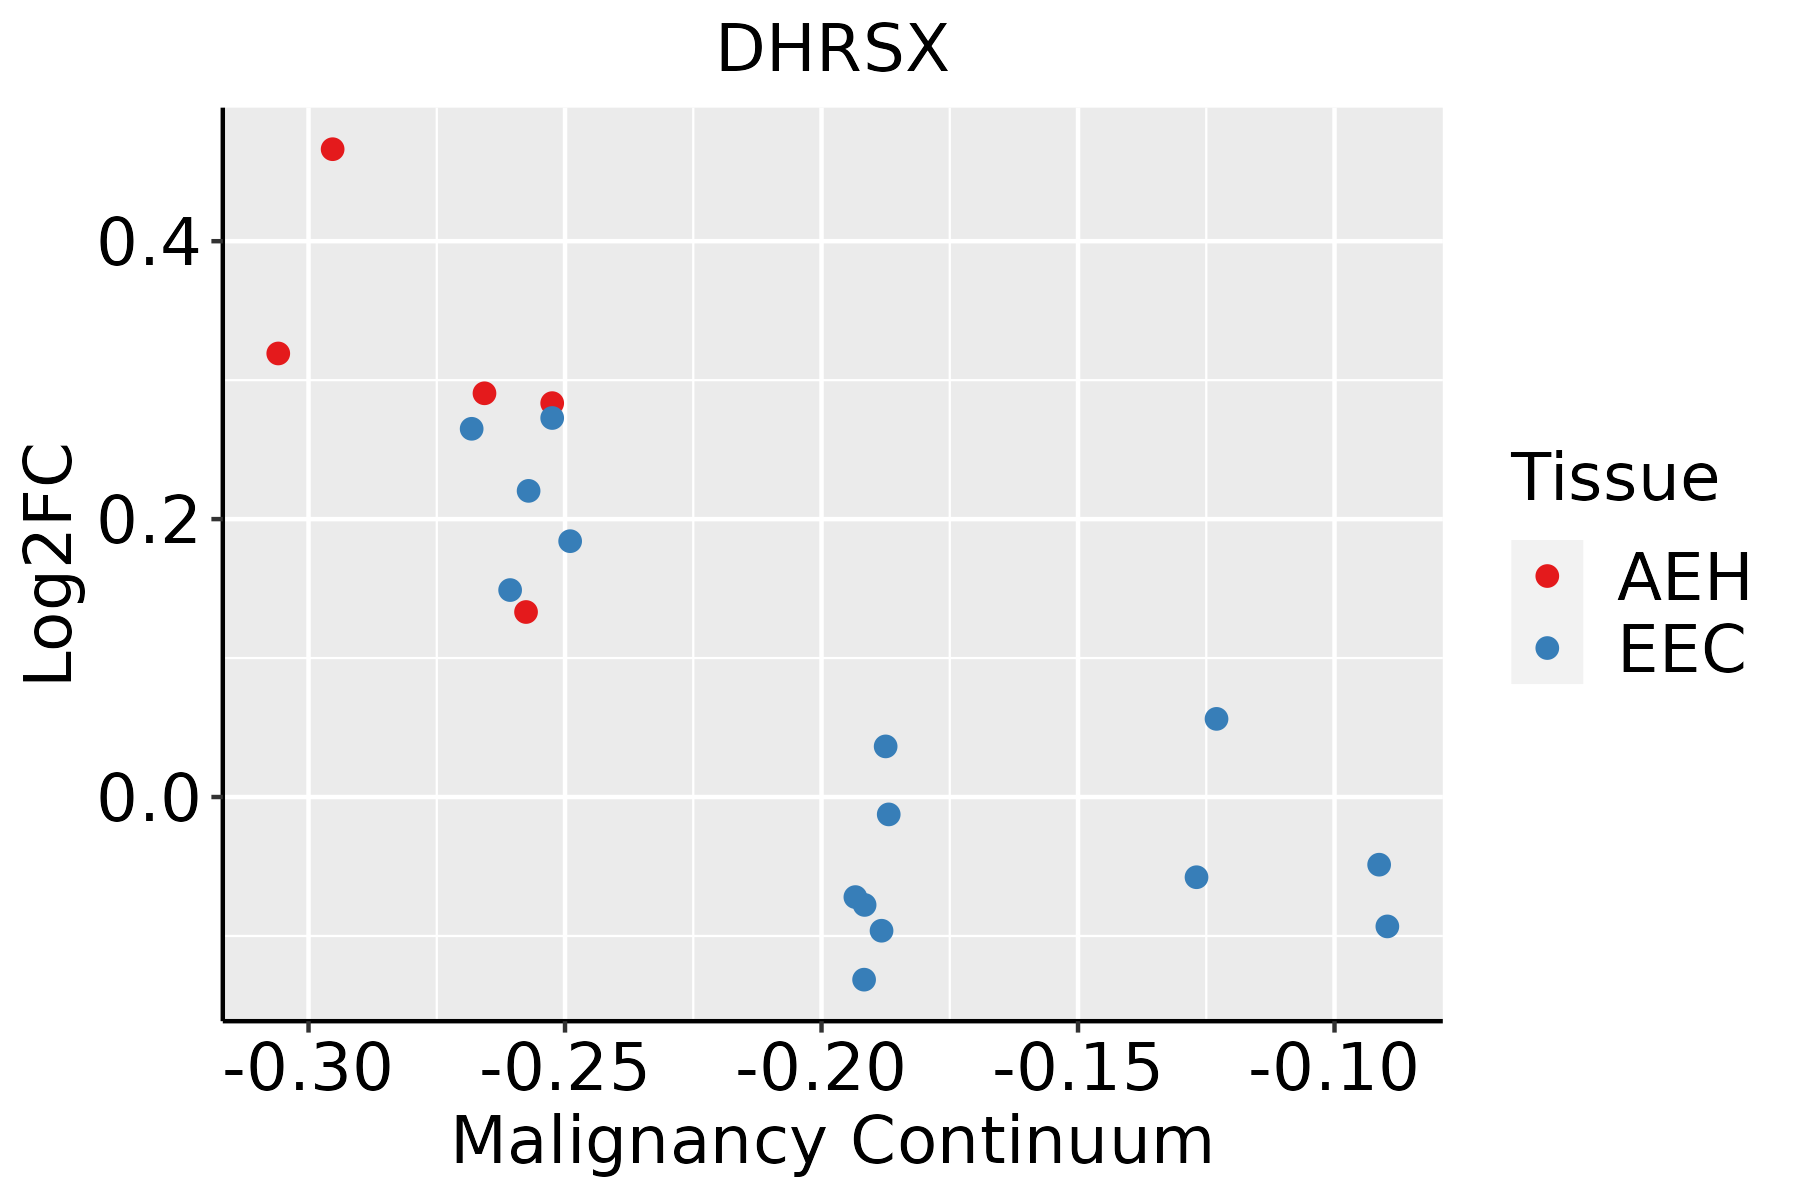 | AEH: Atypical endometrial hyperplasia |
| EEC: Endometrioid Cancer | ||
| Esophagus | 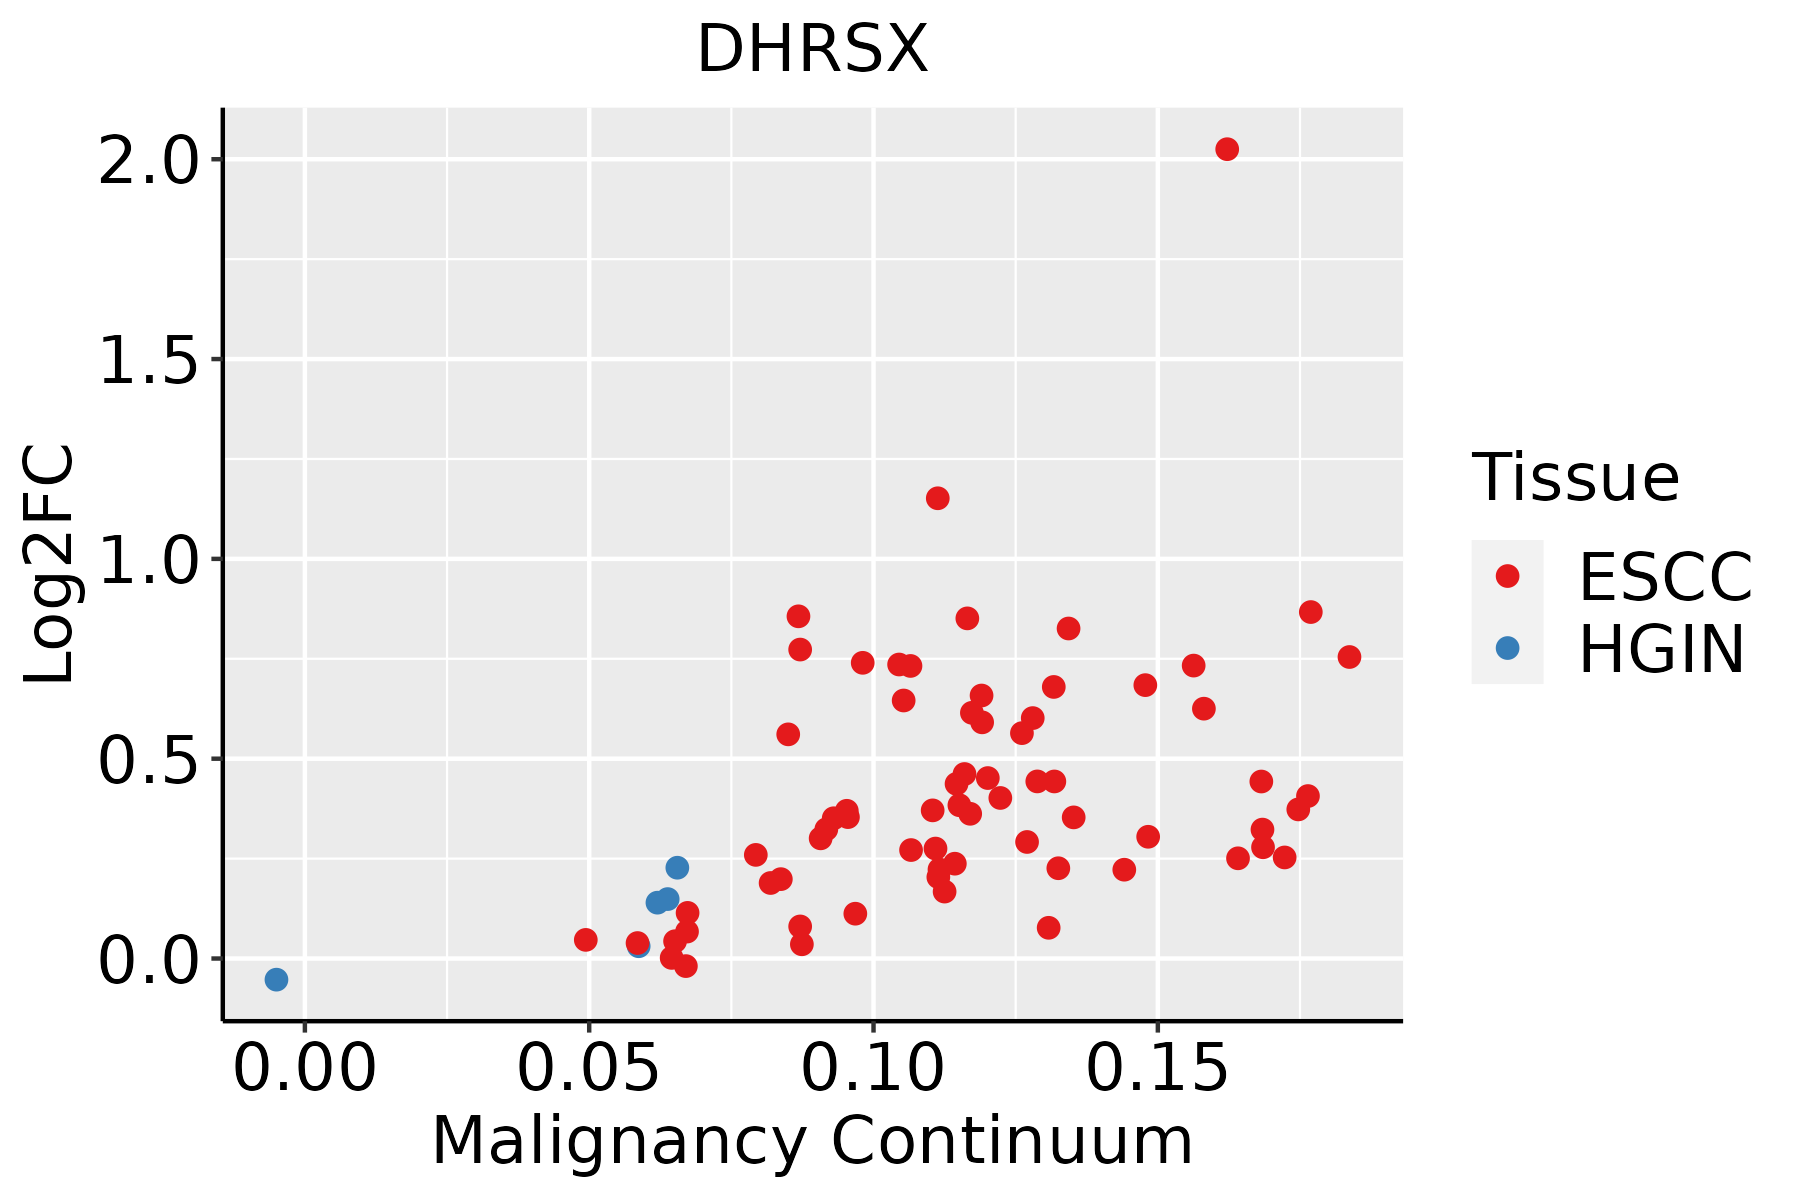 | ESCC: Esophageal squamous cell carcinoma |
| HGIN: High-grade intraepithelial neoplasias | ||
| LGIN: Low-grade intraepithelial neoplasias | ||
| Liver |  | HCC: Hepatocellular carcinoma |
| NAFLD: Non-alcoholic fatty liver disease | ||
| Lung |  | AAH: Atypical adenomatous hyperplasia |
| AIS: Adenocarcinoma in situ | ||
| IAC: Invasive lung adenocarcinoma | ||
| MIA: Minimally invasive adenocarcinoma | ||
| Oral Cavity |  | EOLP: Erosive Oral lichen planus |
| LP: leukoplakia | ||
| NEOLP: Non-erosive oral lichen planus | ||
| OSCC: Oral squamous cell carcinoma | ||
| Prostate |  | BPH: Benign Prostatic Hyperplasia |
| Thyroid | 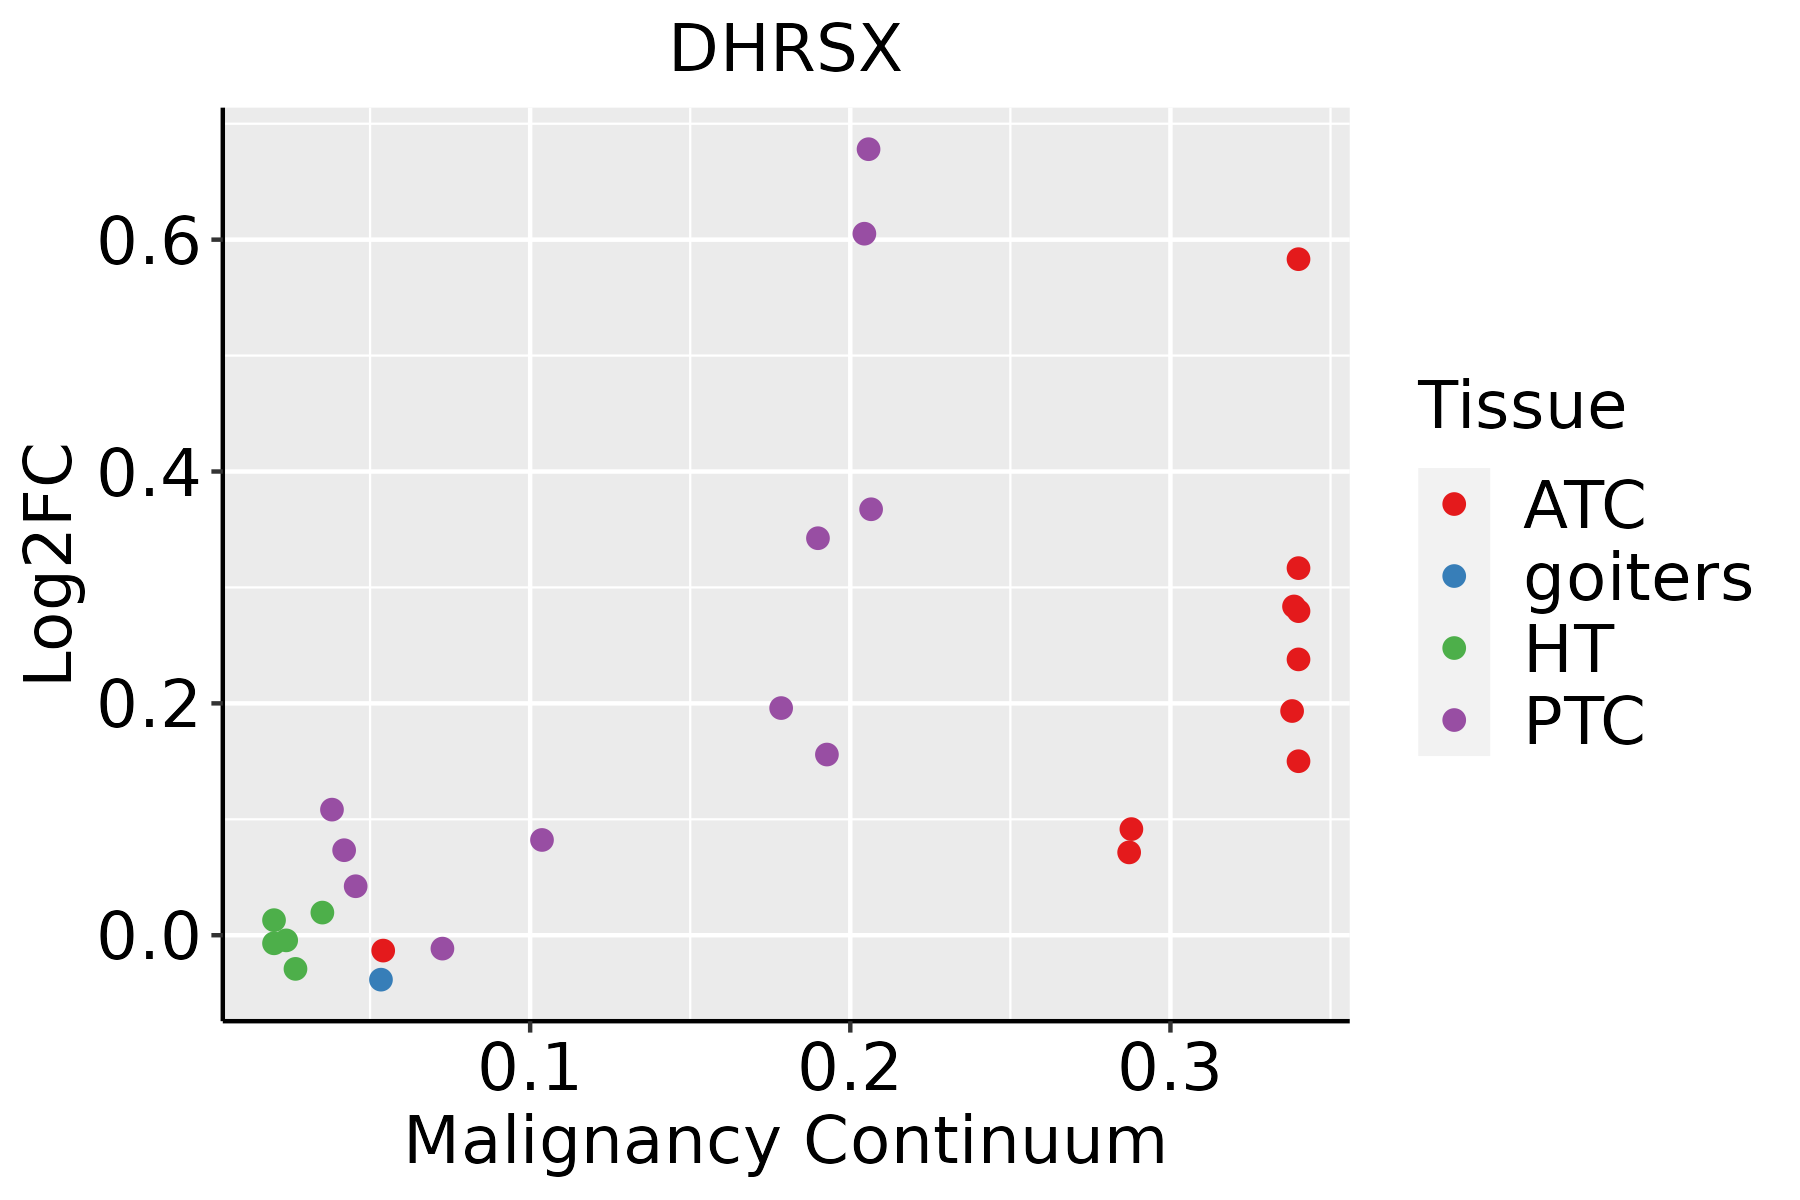 | ATC: Anaplastic thyroid cancer |
| HT: Hashimoto's thyroiditis | ||
| PTC: Papillary thyroid cancer |
| ∗log2FC in expression of this searched gene in stem-like cells from each diseased tissue sample relative to stem-like cells in normal samples in each tissue plotted against the malignancy continuum. Samples are colored based on if they are from different disease stage. |
Top |
Malignant transformation related pathway analysis |
| Find out the enriched GO biological processes and KEGG pathways involved in transition from healthy to precancer to cancer |
| Tissue | Disease Stage | Enriched GO biological Processes |
| Colorectum | AD |  |
| Colorectum | SER |  |
| Colorectum | MSS |  |
| Colorectum | MSI-H |  |
| Colorectum | FAP |  |
| ∗Top 15 enriched GO BP terms are showed in the bar plot of each disease state in each tissue. Each row represents a significant GO biological process which is colored according to the -log10(p.adjust). |
| Page: 1 2 3 4 5 6 7 8 9 |
| GO ID | Tissue | Disease Stage | Description | Gene Ratio | Bg Ratio | pvalue | p.adjust | Count |
| GO:0009896 | Colorectum | AD | positive regulation of catabolic process | 180/3918 | 492/18723 | 4.33e-16 | 1.94e-13 | 180 |
| GO:0031331 | Colorectum | AD | positive regulation of cellular catabolic process | 156/3918 | 427/18723 | 4.68e-14 | 1.05e-11 | 156 |
| GO:0010506 | Colorectum | AD | regulation of autophagy | 111/3918 | 317/18723 | 3.57e-09 | 2.35e-07 | 111 |
| GO:0010508 | Colorectum | AD | positive regulation of autophagy | 43/3918 | 124/18723 | 2.64e-04 | 3.27e-03 | 43 |
| GO:00098962 | Colorectum | MSS | positive regulation of catabolic process | 163/3467 | 492/18723 | 3.10e-15 | 9.22e-13 | 163 |
| GO:00313312 | Colorectum | MSS | positive regulation of cellular catabolic process | 140/3467 | 427/18723 | 7.02e-13 | 1.33e-10 | 140 |
| GO:00105062 | Colorectum | MSS | regulation of autophagy | 95/3467 | 317/18723 | 4.36e-07 | 1.71e-05 | 95 |
| GO:00098964 | Colorectum | FAP | positive regulation of catabolic process | 126/2622 | 492/18723 | 3.76e-12 | 2.56e-09 | 126 |
| GO:00313314 | Colorectum | FAP | positive regulation of cellular catabolic process | 110/2622 | 427/18723 | 6.09e-11 | 2.19e-08 | 110 |
| GO:00105063 | Colorectum | FAP | regulation of autophagy | 80/2622 | 317/18723 | 6.43e-08 | 4.54e-06 | 80 |
| GO:00105081 | Colorectum | FAP | positive regulation of autophagy | 29/2622 | 124/18723 | 3.30e-03 | 2.43e-02 | 29 |
| GO:00098965 | Colorectum | CRC | positive regulation of catabolic process | 102/2078 | 492/18723 | 2.48e-10 | 1.06e-07 | 102 |
| GO:00313315 | Colorectum | CRC | positive regulation of cellular catabolic process | 90/2078 | 427/18723 | 1.19e-09 | 4.20e-07 | 90 |
| GO:00105064 | Colorectum | CRC | regulation of autophagy | 62/2078 | 317/18723 | 6.04e-06 | 2.35e-04 | 62 |
| GO:000989616 | Endometrium | AEH | positive regulation of catabolic process | 104/2100 | 492/18723 | 9.38e-11 | 1.10e-08 | 104 |
| GO:003133116 | Endometrium | AEH | positive regulation of cellular catabolic process | 91/2100 | 427/18723 | 9.15e-10 | 8.31e-08 | 91 |
| GO:00105068 | Endometrium | AEH | regulation of autophagy | 54/2100 | 317/18723 | 1.15e-03 | 9.97e-03 | 54 |
| GO:00105085 | Endometrium | AEH | positive regulation of autophagy | 26/2100 | 124/18723 | 1.17e-03 | 1.01e-02 | 26 |
| GO:000989617 | Endometrium | EEC | positive regulation of catabolic process | 108/2168 | 492/18723 | 2.55e-11 | 3.64e-09 | 108 |
| GO:003133117 | Endometrium | EEC | positive regulation of cellular catabolic process | 94/2168 | 427/18723 | 4.30e-10 | 4.45e-08 | 94 |
| Page: 1 2 3 4 |
| Pathway ID | Tissue | Disease Stage | Description | Gene Ratio | Bg Ratio | pvalue | p.adjust | qvalue | Count |
| Page: 1 |
Top |
Cell-cell communication analysis |
| Identification of potential cell-cell interactions between two cell types and their ligand-receptor pairs for different disease states |
| Ligand | Receptor | LRpair | Pathway | Tissue | Disease Stage |
| Page: 1 |
Top |
Single-cell gene regulatory network inference analysis |
| Find out the significant the regulons (TFs) and the target genes of each regulon across cell types for different disease states |
| TF | Cell Type | Tissue | Disease Stage | Target Gene | RSS | Regulon Activity |
| ∗The dot plots of a searched regulon are shown for all cell subpopulations in each disease state of each tissue based on the regulon specific score inferred using pySCENIC and by calculating the average expression. |
| Page: 1 |
Top |
Somatic mutation of malignant transformation related genes |
| Annotation of somatic variants for genes involved in malignant transformation |
| Hugo Symbol | Variant Class | Variant Classification | dbSNP RS | HGVSc | HGVSp | HGVSp Short | SWISSPROT | BIOTYPE | SIFT | PolyPhen | Tumor Sample Barcode | Tissue | Histology | Sex | Age | Stage | Therapy Types | Drugs | Outcome |
| DHRSX | SNV | Missense_Mutation | c.734N>T | p.Thr245Met | p.T245M | Q8N5I4 | protein_coding | deleterious(0) | probably_damaging(0.991) | TCGA-C5-A7UE-01 | Cervix | cervical & endocervical cancer | Female | <65 | I/II | Chemotherapy | cisplatin | SD | |
| DHRSX | SNV | Missense_Mutation | rs773647562 | c.506N>T | p.Ser169Phe | p.S169F | Q8N5I4 | protein_coding | deleterious(0) | probably_damaging(0.99) | TCGA-EA-A3Y4-01 | Cervix | cervical & endocervical cancer | Female | <65 | I/II | Unknown | Unknown | SD |
| DHRSX | SNV | Missense_Mutation | c.685N>A | p.Glu229Lys | p.E229K | Q8N5I4 | protein_coding | tolerated(0.53) | benign(0.031) | TCGA-EK-A2GZ-01 | Cervix | cervical & endocervical cancer | Female | <65 | III/IV | Unknown | Unknown | SD | |
| DHRSX | SNV | Missense_Mutation | c.458T>A | p.Leu153Gln | p.L153Q | Q8N5I4 | protein_coding | deleterious(0) | probably_damaging(0.994) | TCGA-LP-A4AW-01 | Cervix | cervical & endocervical cancer | Female | <65 | I/II | Unknown | Unknown | SD | |
| DHRSX | SNV | Missense_Mutation | c.641N>T | p.Ala214Val | p.A214V | Q8N5I4 | protein_coding | deleterious(0) | probably_damaging(1) | TCGA-AD-6964-01 | Colorectum | colon adenocarcinoma | Male | <65 | III/IV | Chemotherapy | folfox | PD | |
| DHRSX | SNV | Missense_Mutation | rs149133886 | c.541N>A | p.Val181Ile | p.V181I | Q8N5I4 | protein_coding | deleterious(0.03) | possibly_damaging(0.903) | TCGA-CM-4748-01 | Colorectum | colon adenocarcinoma | Male | <65 | III/IV | Chemotherapy | fluorouracil | SD |
| DHRSX | SNV | Missense_Mutation | c.897G>T | p.Glu299Asp | p.E299D | Q8N5I4 | protein_coding | tolerated(0.13) | benign(0.062) | TCGA-AG-A002-01 | Colorectum | rectum adenocarcinoma | Male | <65 | I/II | Unknown | Unknown | SD | |
| DHRSX | SNV | Missense_Mutation | rs369921411 | c.136N>A | p.Ala46Thr | p.A46T | Q8N5I4 | protein_coding | deleterious(0.01) | probably_damaging(0.994) | TCGA-A5-A0G2-01 | Endometrium | uterine corpus endometrioid carcinoma | Female | <65 | III/IV | Unknown | Unknown | SD |
| DHRSX | SNV | Missense_Mutation | novel | c.593N>A | p.Ser198Asn | p.S198N | Q8N5I4 | protein_coding | tolerated(0.09) | benign(0.037) | TCGA-AJ-A3EL-01 | Endometrium | uterine corpus endometrioid carcinoma | Female | <65 | I/II | Unknown | Unknown | SD |
| DHRSX | SNV | Missense_Mutation | rs771945253 | c.736N>A | p.Asp246Asn | p.D246N | Q8N5I4 | protein_coding | tolerated(0.21) | benign(0.003) | TCGA-AP-A059-01 | Endometrium | uterine corpus endometrioid carcinoma | Female | >=65 | I/II | Unknown | Unknown | SD |
| Page: 1 2 3 4 |
Top |
Related drugs of malignant transformation related genes |
| Identification of chemicals and drugs interact with genes involved in malignant transfromation |
| (DGIdb 4.0) |
| Entrez ID | Symbol | Category | Interaction Types | Drug Claim Name | Drug Name | PMIDs |
| Page: 1 |

Copyright 2023-Present -The University of Texas Health Science Center at Houston |