
|
|||||
|
 | |
| |
| |
| |
| |
| |
|
Gene: DHRS9 |
Gene summary for DHRS9 |
| Gene information | Species | Human | Gene symbol | DHRS9 | Gene ID | 10170 |
| Gene name | dehydrogenase/reductase 9 | |
| Gene Alias | 3-alpha-HSD | |
| Cytomap | 2q31.1 | |
| Gene Type | protein-coding | GO ID | GO:0001523 | UniProtAcc | Q9BPW9 |
Top |
Malignant transformation analysis |
| Identification of the aberrant gene expression in precancerous and cancerous lesions by comparing the gene expression of stem-like cells in diseased tissues with normal stem cells |
| Entrez ID | Symbol | Replicates | Species | Organ | Tissue | Adj P-value | Log2FC | Malignancy |
| 10170 | DHRS9 | HTA11_2487_2000001011 | Human | Colorectum | SER | 5.58e-17 | 1.07e+00 | -0.1808 |
| 10170 | DHRS9 | HTA11_347_2000001011 | Human | Colorectum | AD | 5.38e-06 | 4.95e-01 | -0.1954 |
| 10170 | DHRS9 | HTA11_411_2000001011 | Human | Colorectum | SER | 1.08e-11 | 2.17e+00 | -0.2602 |
| 10170 | DHRS9 | HTA11_2112_2000001011 | Human | Colorectum | SER | 3.15e-08 | 1.16e+00 | -0.2196 |
| 10170 | DHRS9 | HTA11_3361_2000001011 | Human | Colorectum | AD | 2.35e-02 | 3.42e-01 | -0.1207 |
| 10170 | DHRS9 | HTA11_83_2000001011 | Human | Colorectum | SER | 3.99e-03 | 5.33e-01 | -0.1526 |
| 10170 | DHRS9 | HTA11_696_2000001011 | Human | Colorectum | AD | 3.91e-04 | 2.58e-01 | -0.1464 |
| 10170 | DHRS9 | LZE5T | Human | Esophagus | ESCC | 1.28e-07 | 5.60e-01 | 0.0514 |
| 10170 | DHRS9 | LZE7T | Human | Esophagus | ESCC | 2.56e-05 | 5.19e-01 | 0.0667 |
| 10170 | DHRS9 | LZE20T | Human | Esophagus | ESCC | 3.61e-13 | 5.84e-01 | 0.0662 |
| 10170 | DHRS9 | LZE24T | Human | Esophagus | ESCC | 1.89e-10 | 6.68e-01 | 0.0596 |
| 10170 | DHRS9 | P8T-E | Human | Esophagus | ESCC | 3.28e-14 | 5.42e-01 | 0.0889 |
| 10170 | DHRS9 | P10T-E | Human | Esophagus | ESCC | 5.17e-27 | 8.43e-01 | 0.116 |
| 10170 | DHRS9 | P12T-E | Human | Esophagus | ESCC | 9.74e-22 | 6.72e-01 | 0.1122 |
| 10170 | DHRS9 | P15T-E | Human | Esophagus | ESCC | 1.53e-11 | 4.56e-01 | 0.1149 |
| 10170 | DHRS9 | P22T-E | Human | Esophagus | ESCC | 3.28e-14 | 3.88e-01 | 0.1236 |
| 10170 | DHRS9 | P23T-E | Human | Esophagus | ESCC | 5.94e-18 | 1.67e+00 | 0.108 |
| 10170 | DHRS9 | P27T-E | Human | Esophagus | ESCC | 1.78e-03 | 1.08e-01 | 0.1055 |
| 10170 | DHRS9 | P31T-E | Human | Esophagus | ESCC | 3.75e-03 | 1.77e-01 | 0.1251 |
| 10170 | DHRS9 | P39T-E | Human | Esophagus | ESCC | 1.25e-26 | 1.06e+00 | 0.0894 |
| Page: 1 2 |
| Tissue | Expression Dynamics | Abbreviation |
| Colorectum (GSE201348) | 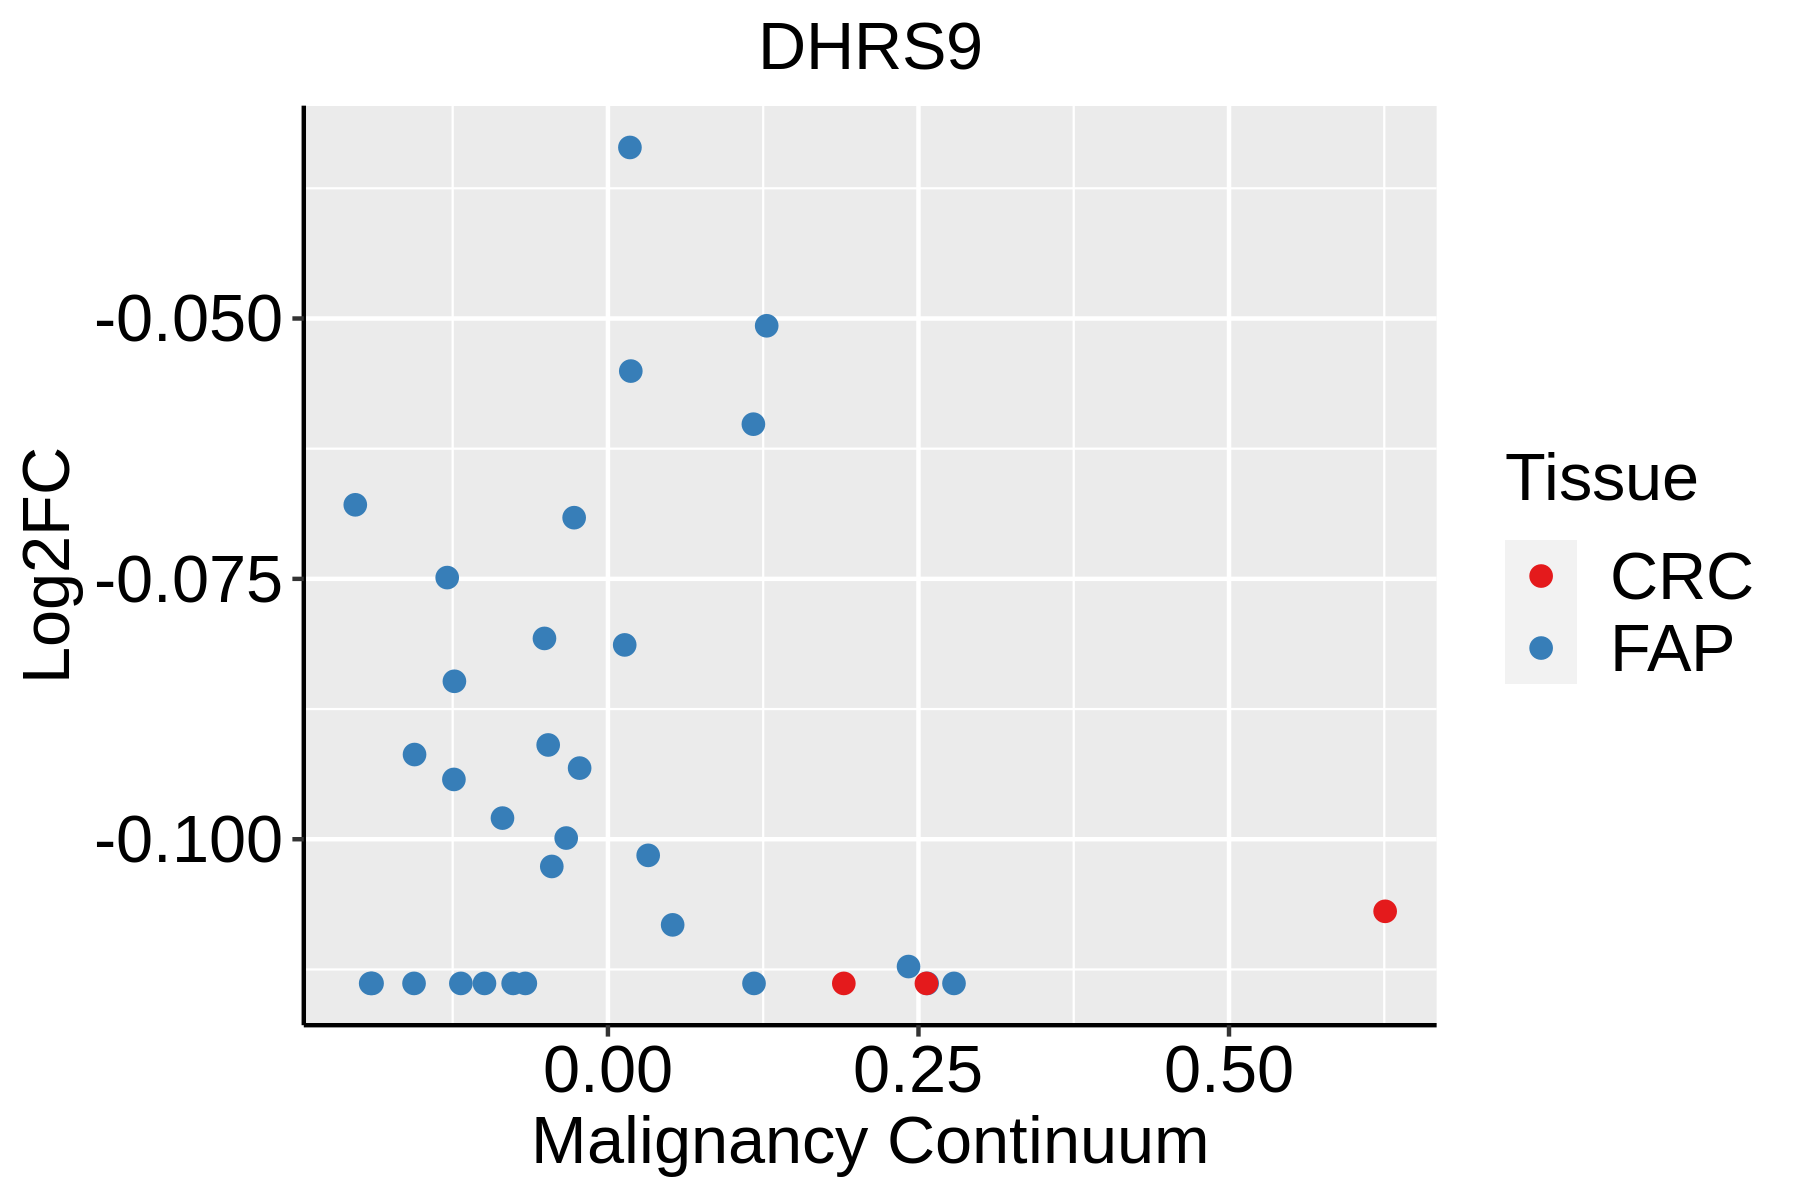 | FAP: Familial adenomatous polyposis |
| CRC: Colorectal cancer | ||
| Colorectum (HTA11) |  | AD: Adenomas |
| SER: Sessile serrated lesions | ||
| MSI-H: Microsatellite-high colorectal cancer | ||
| MSS: Microsatellite stable colorectal cancer | ||
| Esophagus | 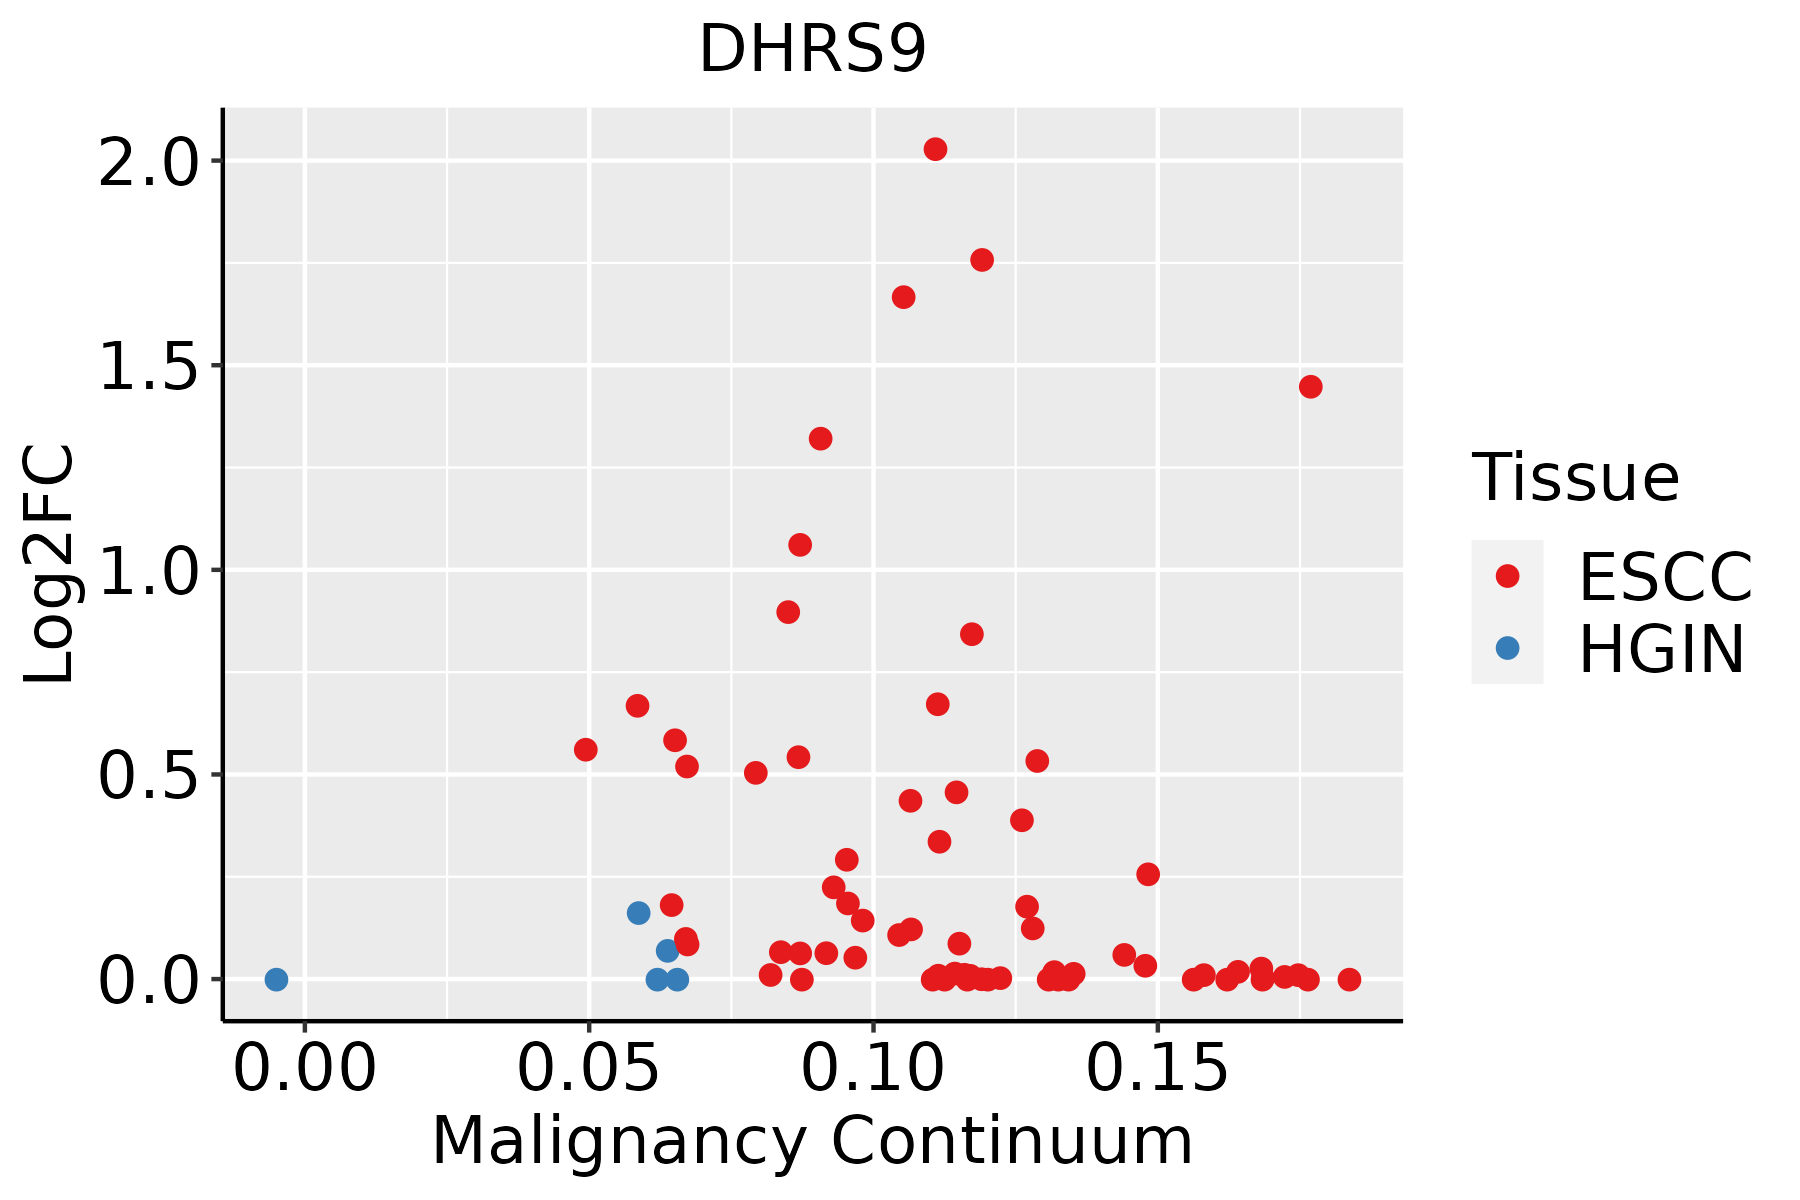 | ESCC: Esophageal squamous cell carcinoma |
| HGIN: High-grade intraepithelial neoplasias | ||
| LGIN: Low-grade intraepithelial neoplasias | ||
| Oral Cavity |  | EOLP: Erosive Oral lichen planus |
| LP: leukoplakia | ||
| NEOLP: Non-erosive oral lichen planus | ||
| OSCC: Oral squamous cell carcinoma |
| ∗log2FC in expression of this searched gene in stem-like cells from each diseased tissue sample relative to stem-like cells in normal samples in each tissue plotted against the malignancy continuum. Samples are colored based on if they are from different disease stage. |
Top |
Malignant transformation related pathway analysis |
| Find out the enriched GO biological processes and KEGG pathways involved in transition from healthy to precancer to cancer |
| Tissue | Disease Stage | Enriched GO biological Processes |
| Colorectum | AD |  |
| Colorectum | SER |  |
| Colorectum | MSS |  |
| Colorectum | MSI-H |  |
| Colorectum | FAP |  |
| ∗Top 15 enriched GO BP terms are showed in the bar plot of each disease state in each tissue. Each row represents a significant GO biological process which is colored according to the -log10(p.adjust). |
| Page: 1 2 3 4 5 6 7 8 9 |
| GO ID | Tissue | Disease Stage | Description | Gene Ratio | Bg Ratio | pvalue | p.adjust | Count |
| GO:0006066 | Colorectum | AD | alcohol metabolic process | 106/3918 | 353/18723 | 3.02e-05 | 5.57e-04 | 106 |
| GO:0034308 | Colorectum | AD | primary alcohol metabolic process | 35/3918 | 102/18723 | 1.16e-03 | 1.05e-02 | 35 |
| GO:0008202 | Colorectum | AD | steroid metabolic process | 85/3918 | 319/18723 | 8.07e-03 | 4.75e-02 | 85 |
| GO:00060661 | Colorectum | SER | alcohol metabolic process | 79/2897 | 353/18723 | 3.50e-04 | 5.50e-03 | 79 |
| GO:00343081 | Colorectum | SER | primary alcohol metabolic process | 26/2897 | 102/18723 | 5.87e-03 | 4.29e-02 | 26 |
| GO:00060668 | Esophagus | ESCC | alcohol metabolic process | 202/8552 | 353/18723 | 7.32e-06 | 7.26e-05 | 202 |
| GO:00463948 | Esophagus | ESCC | carboxylic acid biosynthetic process | 175/8552 | 314/18723 | 1.98e-04 | 1.26e-03 | 175 |
| GO:00160538 | Esophagus | ESCC | organic acid biosynthetic process | 175/8552 | 316/18723 | 3.04e-04 | 1.82e-03 | 175 |
| GO:00421805 | Esophagus | ESCC | cellular ketone metabolic process | 120/8552 | 211/18723 | 6.70e-04 | 3.55e-03 | 120 |
| GO:00082991 | Esophagus | ESCC | isoprenoid biosynthetic process | 21/8552 | 28/18723 | 1.57e-03 | 7.33e-03 | 21 |
| GO:00060667 | Oral cavity | OSCC | alcohol metabolic process | 179/7305 | 353/18723 | 4.54e-06 | 5.21e-05 | 179 |
| GO:00421804 | Oral cavity | OSCC | cellular ketone metabolic process | 111/7305 | 211/18723 | 3.94e-05 | 3.45e-04 | 111 |
| GO:00160537 | Oral cavity | OSCC | organic acid biosynthetic process | 155/7305 | 316/18723 | 1.64e-04 | 1.13e-03 | 155 |
| GO:00463947 | Oral cavity | OSCC | carboxylic acid biosynthetic process | 154/7305 | 314/18723 | 1.73e-04 | 1.19e-03 | 154 |
| GO:0008299 | Oral cavity | OSCC | isoprenoid biosynthetic process | 20/7305 | 28/18723 | 5.13e-04 | 2.99e-03 | 20 |
| GO:00067203 | Oral cavity | OSCC | isoprenoid metabolic process | 59/7305 | 116/18723 | 6.18e-03 | 2.33e-02 | 59 |
| GO:00082024 | Oral cavity | OSCC | steroid metabolic process | 146/7305 | 319/18723 | 7.78e-03 | 2.85e-02 | 146 |
| Page: 1 |
| Pathway ID | Tissue | Disease Stage | Description | Gene Ratio | Bg Ratio | pvalue | p.adjust | qvalue | Count |
| Page: 1 |
Top |
Cell-cell communication analysis |
| Identification of potential cell-cell interactions between two cell types and their ligand-receptor pairs for different disease states |
| Ligand | Receptor | LRpair | Pathway | Tissue | Disease Stage |
| Page: 1 |
Top |
Single-cell gene regulatory network inference analysis |
| Find out the significant the regulons (TFs) and the target genes of each regulon across cell types for different disease states |
| TF | Cell Type | Tissue | Disease Stage | Target Gene | RSS | Regulon Activity |
| ∗The dot plots of a searched regulon are shown for all cell subpopulations in each disease state of each tissue based on the regulon specific score inferred using pySCENIC and by calculating the average expression. |
| Page: 1 |
Top |
Somatic mutation of malignant transformation related genes |
| Annotation of somatic variants for genes involved in malignant transformation |
| Hugo Symbol | Variant Class | Variant Classification | dbSNP RS | HGVSc | HGVSp | HGVSp Short | SWISSPROT | BIOTYPE | SIFT | PolyPhen | Tumor Sample Barcode | Tissue | Histology | Sex | Age | Stage | Therapy Types | Drugs | Outcome |
| DHRS9 | SNV | Missense_Mutation | c.361C>G | p.Leu121Val | p.L121V | Q9BPW9 | protein_coding | deleterious(0) | probably_damaging(0.992) | TCGA-A2-A0EQ-01 | Breast | breast invasive carcinoma | Female | <65 | I/II | Chemotherapy | adriamycin | SD | |
| DHRS9 | SNV | Missense_Mutation | c.485N>A | p.Gly162Glu | p.G162E | Q9BPW9 | protein_coding | deleterious(0.02) | possibly_damaging(0.838) | TCGA-A8-A08G-01 | Breast | breast invasive carcinoma | Female | <65 | I/II | Chemotherapy | 5-fluorouracil | CR | |
| DHRS9 | SNV | Missense_Mutation | c.1010C>G | p.Pro337Arg | p.P337R | Q9BPW9 | protein_coding | deleterious(0) | probably_damaging(0.998) | TCGA-IR-A3LA-01 | Cervix | cervical & endocervical cancer | Female | <65 | I/II | Chemotherapy | cisplatin | CR | |
| DHRS9 | SNV | Missense_Mutation | rs774290765 | c.781N>A | p.Val261Ile | p.V261I | Q9BPW9 | protein_coding | tolerated(0.07) | possibly_damaging(0.84) | TCGA-VS-A8EC-01 | Cervix | cervical & endocervical cancer | Female | <65 | III/IV | Chemotherapy | carboplatin | CR |
| DHRS9 | SNV | Missense_Mutation | rs766893376 | c.826N>T | p.Pro276Ser | p.P276S | Q9BPW9 | protein_coding | tolerated(0.83) | benign(0.001) | TCGA-VS-A8Q8-01 | Cervix | cervical & endocervical cancer | Female | <65 | I/II | Unknown | Unknown | PD |
| DHRS9 | deletion | Frame_Shift_Del | rs778336118 | c.842delN | p.Lys283AsnfsTer25 | p.K283Nfs*25 | Q9BPW9 | protein_coding | TCGA-EA-A3HU-01 | Cervix | cervical & endocervical cancer | Female | <65 | I/II | Unknown | Unknown | SD | ||
| DHRS9 | SNV | Missense_Mutation | c.605T>C | p.Ile202Thr | p.I202T | Q9BPW9 | protein_coding | deleterious(0.01) | possibly_damaging(0.596) | TCGA-AA-3864-01 | Colorectum | colon adenocarcinoma | Male | >=65 | I/II | Unknown | Unknown | SD | |
| DHRS9 | SNV | Missense_Mutation | novel | c.1108A>G | p.Lys370Glu | p.K370E | Q9BPW9 | protein_coding | deleterious(0.04) | benign(0.001) | TCGA-AZ-6605-01 | Colorectum | colon adenocarcinoma | Male | >=65 | III/IV | Chemotherapy | folfox | SD |
| DHRS9 | SNV | Missense_Mutation | novel | c.941N>C | p.Lys314Thr | p.K314T | Q9BPW9 | protein_coding | tolerated(0.43) | benign(0) | TCGA-F5-6814-01 | Colorectum | rectum adenocarcinoma | Male | <65 | I/II | Unknown | Unknown | SD |
| DHRS9 | deletion | Frame_Shift_Del | rs778336118 | c.842delN | p.Lys283AsnfsTer25 | p.K283Nfs*25 | Q9BPW9 | protein_coding | TCGA-5M-AAT6-01 | Colorectum | colon adenocarcinoma | Female | <65 | III/IV | Unknown | Unknown | PD |
| Page: 1 2 3 4 5 6 7 |
Top |
Related drugs of malignant transformation related genes |
| Identification of chemicals and drugs interact with genes involved in malignant transfromation |
| (DGIdb 4.0) |
| Entrez ID | Symbol | Category | Interaction Types | Drug Claim Name | Drug Name | PMIDs |
| 10170 | DHRS9 | DRUGGABLE GENOME, SHORT CHAIN DEHYDROGENASE REDUCTASE | (+)-ISOZONARONE | CHEMBL459574 | 19188072 | |
| 10170 | DHRS9 | DRUGGABLE GENOME, SHORT CHAIN DEHYDROGENASE REDUCTASE | SESQUITERPENE O-BENZOQUINONE | CHEMBL517425 | 19188072 | |
| 10170 | DHRS9 | DRUGGABLE GENOME, SHORT CHAIN DEHYDROGENASE REDUCTASE | PROTECTED SIPHONODICTYAL C | PROTECTED SIPHONODICTYAL C | 19188072 | |
| 10170 | DHRS9 | DRUGGABLE GENOME, SHORT CHAIN DEHYDROGENASE REDUCTASE | (+/-)-SPONGIAQUINONE | CHEMBL514876 | 19188072 | |
| 10170 | DHRS9 | DRUGGABLE GENOME, SHORT CHAIN DEHYDROGENASE REDUCTASE | (+/-)-HYATELLAQUINONE | CHEMBL456414 | 19188072 | |
| 10170 | DHRS9 | DRUGGABLE GENOME, SHORT CHAIN DEHYDROGENASE REDUCTASE | (+/-)-WIEDENDIOL B | (+/-)-WIEDENDIOL B | 19188072 | |
| 10170 | DHRS9 | DRUGGABLE GENOME, SHORT CHAIN DEHYDROGENASE REDUCTASE | (+)-ZONAROL | CHEMBL461471 | 19188072 |
| Page: 1 |

Copyright 2023-Present -The University of Texas Health Science Center at Houston |