
|
|||||
|
 | |
| |
| |
| |
| |
| |
|
Gene: DHRS7 |
Gene summary for DHRS7 |
| Gene information | Species | Human | Gene symbol | DHRS7 | Gene ID | 51635 |
| Gene name | dehydrogenase/reductase 7 | |
| Gene Alias | CGI-86 | |
| Cytomap | 14q23.1 | |
| Gene Type | protein-coding | GO ID | GO:0005575 | UniProtAcc | Q9Y394 |
Top |
Malignant transformation analysis |
| Identification of the aberrant gene expression in precancerous and cancerous lesions by comparing the gene expression of stem-like cells in diseased tissues with normal stem cells |
| Entrez ID | Symbol | Replicates | Species | Organ | Tissue | Adj P-value | Log2FC | Malignancy |
| 51635 | DHRS7 | CA_HPV_1 | Human | Cervix | CC | 1.98e-06 | -1.31e-01 | 0.0264 |
| 51635 | DHRS7 | CCI_1 | Human | Cervix | CC | 3.71e-06 | -5.57e-01 | 0.528 |
| 51635 | DHRS7 | CCI_2 | Human | Cervix | CC | 3.48e-02 | -4.70e-01 | 0.5249 |
| 51635 | DHRS7 | CCI_3 | Human | Cervix | CC | 5.77e-04 | -4.70e-01 | 0.516 |
| 51635 | DHRS7 | CCII_1 | Human | Cervix | CC | 1.79e-16 | -5.77e-01 | 0.3249 |
| 51635 | DHRS7 | H2 | Human | Cervix | HSIL_HPV | 1.12e-02 | -2.27e-01 | 0.0632 |
| 51635 | DHRS7 | L1 | Human | Cervix | CC | 2.30e-10 | -4.45e-01 | 0.0802 |
| 51635 | DHRS7 | T1 | Human | Cervix | CC | 8.12e-12 | -4.65e-01 | 0.0918 |
| 51635 | DHRS7 | LZE4T | Human | Esophagus | ESCC | 4.02e-32 | 1.22e+00 | 0.0811 |
| 51635 | DHRS7 | LZE5T | Human | Esophagus | ESCC | 6.46e-04 | 9.43e-01 | 0.0514 |
| 51635 | DHRS7 | LZE7T | Human | Esophagus | ESCC | 5.70e-06 | 1.83e-01 | 0.0667 |
| 51635 | DHRS7 | LZE8T | Human | Esophagus | ESCC | 7.21e-06 | 1.71e-01 | 0.067 |
| 51635 | DHRS7 | LZE20T | Human | Esophagus | ESCC | 3.42e-09 | 5.88e-01 | 0.0662 |
| 51635 | DHRS7 | LZE22D1 | Human | Esophagus | HGIN | 1.21e-03 | 1.33e-01 | 0.0595 |
| 51635 | DHRS7 | LZE22T | Human | Esophagus | ESCC | 6.63e-06 | 7.58e-01 | 0.068 |
| 51635 | DHRS7 | LZE24T | Human | Esophagus | ESCC | 4.58e-17 | 7.45e-01 | 0.0596 |
| 51635 | DHRS7 | LZE21T | Human | Esophagus | ESCC | 1.78e-05 | 2.00e-01 | 0.0655 |
| 51635 | DHRS7 | LZE6T | Human | Esophagus | ESCC | 5.19e-12 | 6.91e-01 | 0.0845 |
| 51635 | DHRS7 | P2T-E | Human | Esophagus | ESCC | 2.14e-51 | 6.94e-01 | 0.1177 |
| 51635 | DHRS7 | P4T-E | Human | Esophagus | ESCC | 1.72e-47 | 1.21e+00 | 0.1323 |
| Page: 1 2 3 4 5 6 7 |
| Tissue | Expression Dynamics | Abbreviation |
| Cervix |  | CC: Cervix cancer |
| HSIL_HPV: HPV-infected high-grade squamous intraepithelial lesions | ||
| N_HPV: HPV-infected normal cervix | ||
| Esophagus |  | ESCC: Esophageal squamous cell carcinoma |
| HGIN: High-grade intraepithelial neoplasias | ||
| LGIN: Low-grade intraepithelial neoplasias | ||
| Liver | 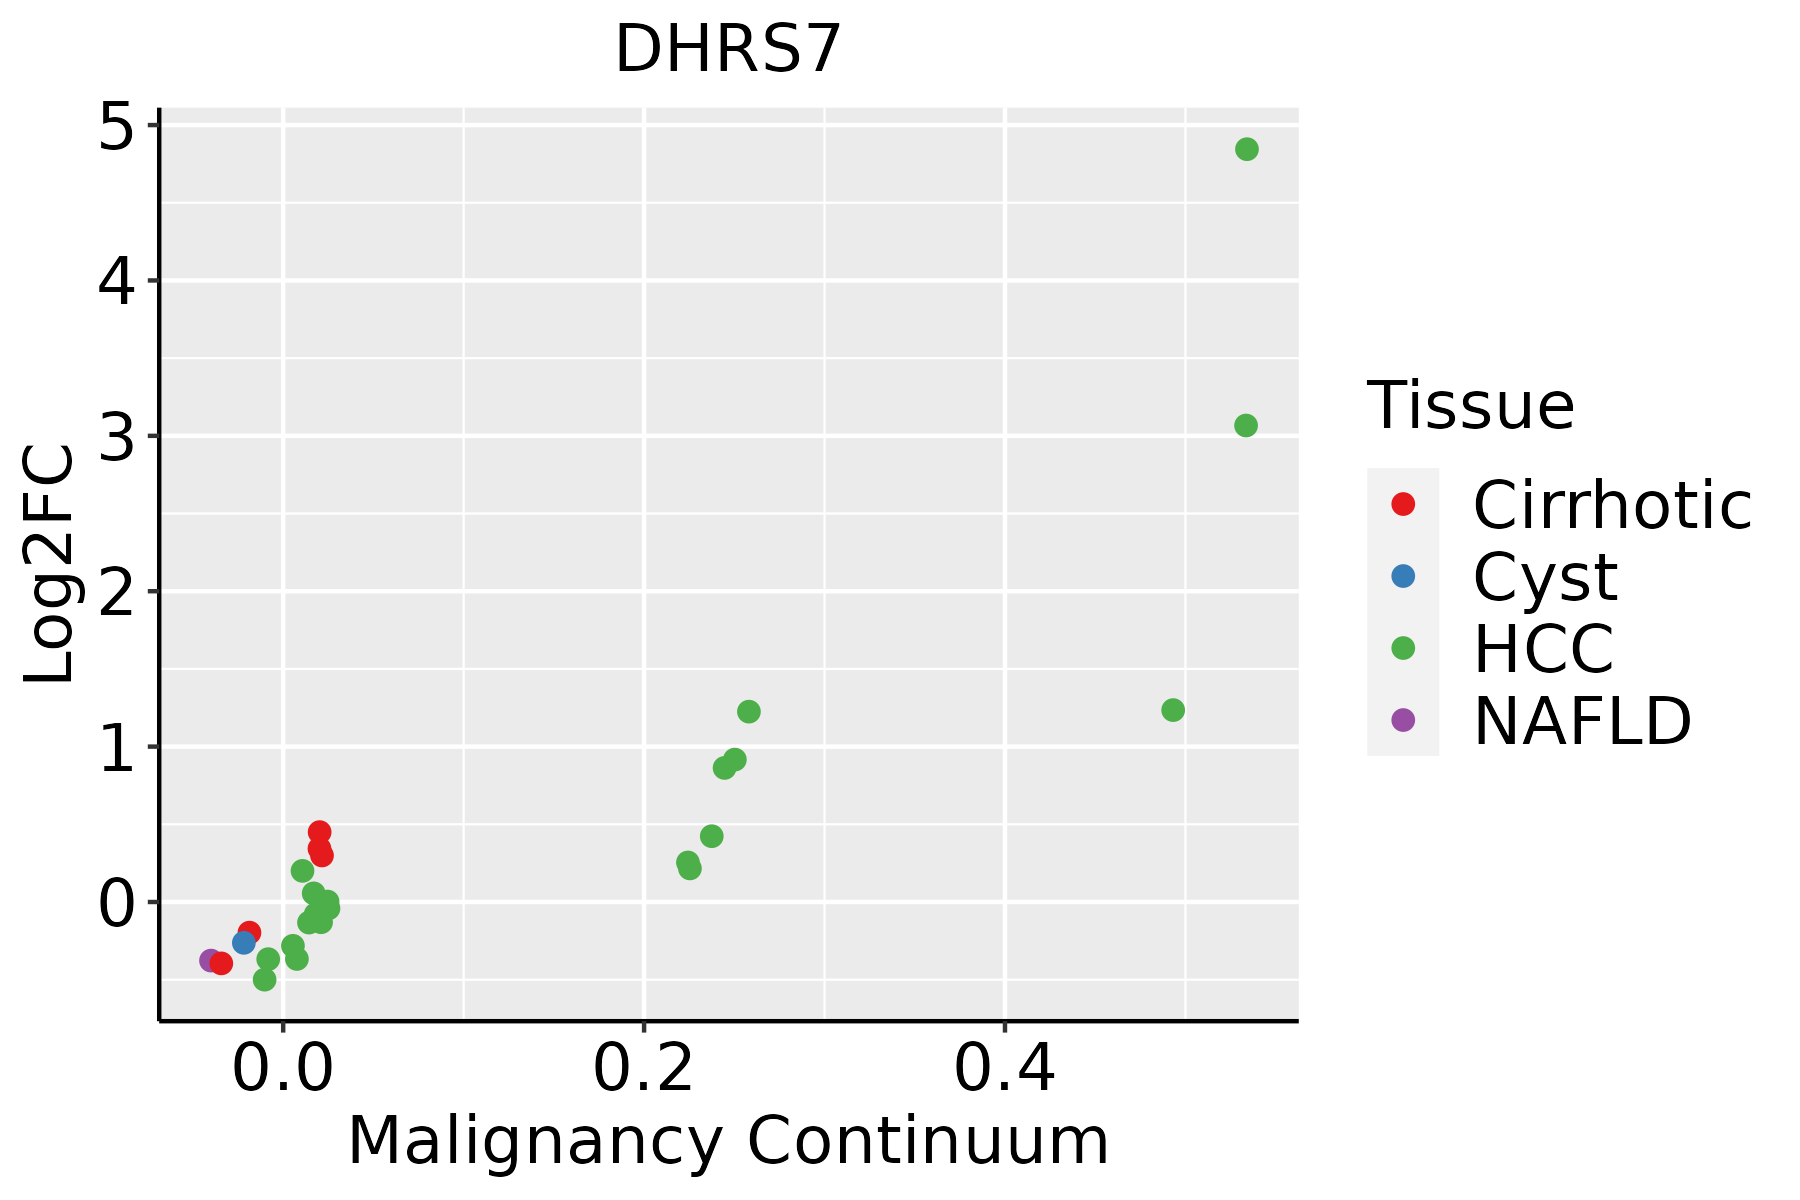 | HCC: Hepatocellular carcinoma |
| NAFLD: Non-alcoholic fatty liver disease | ||
| Oral Cavity | 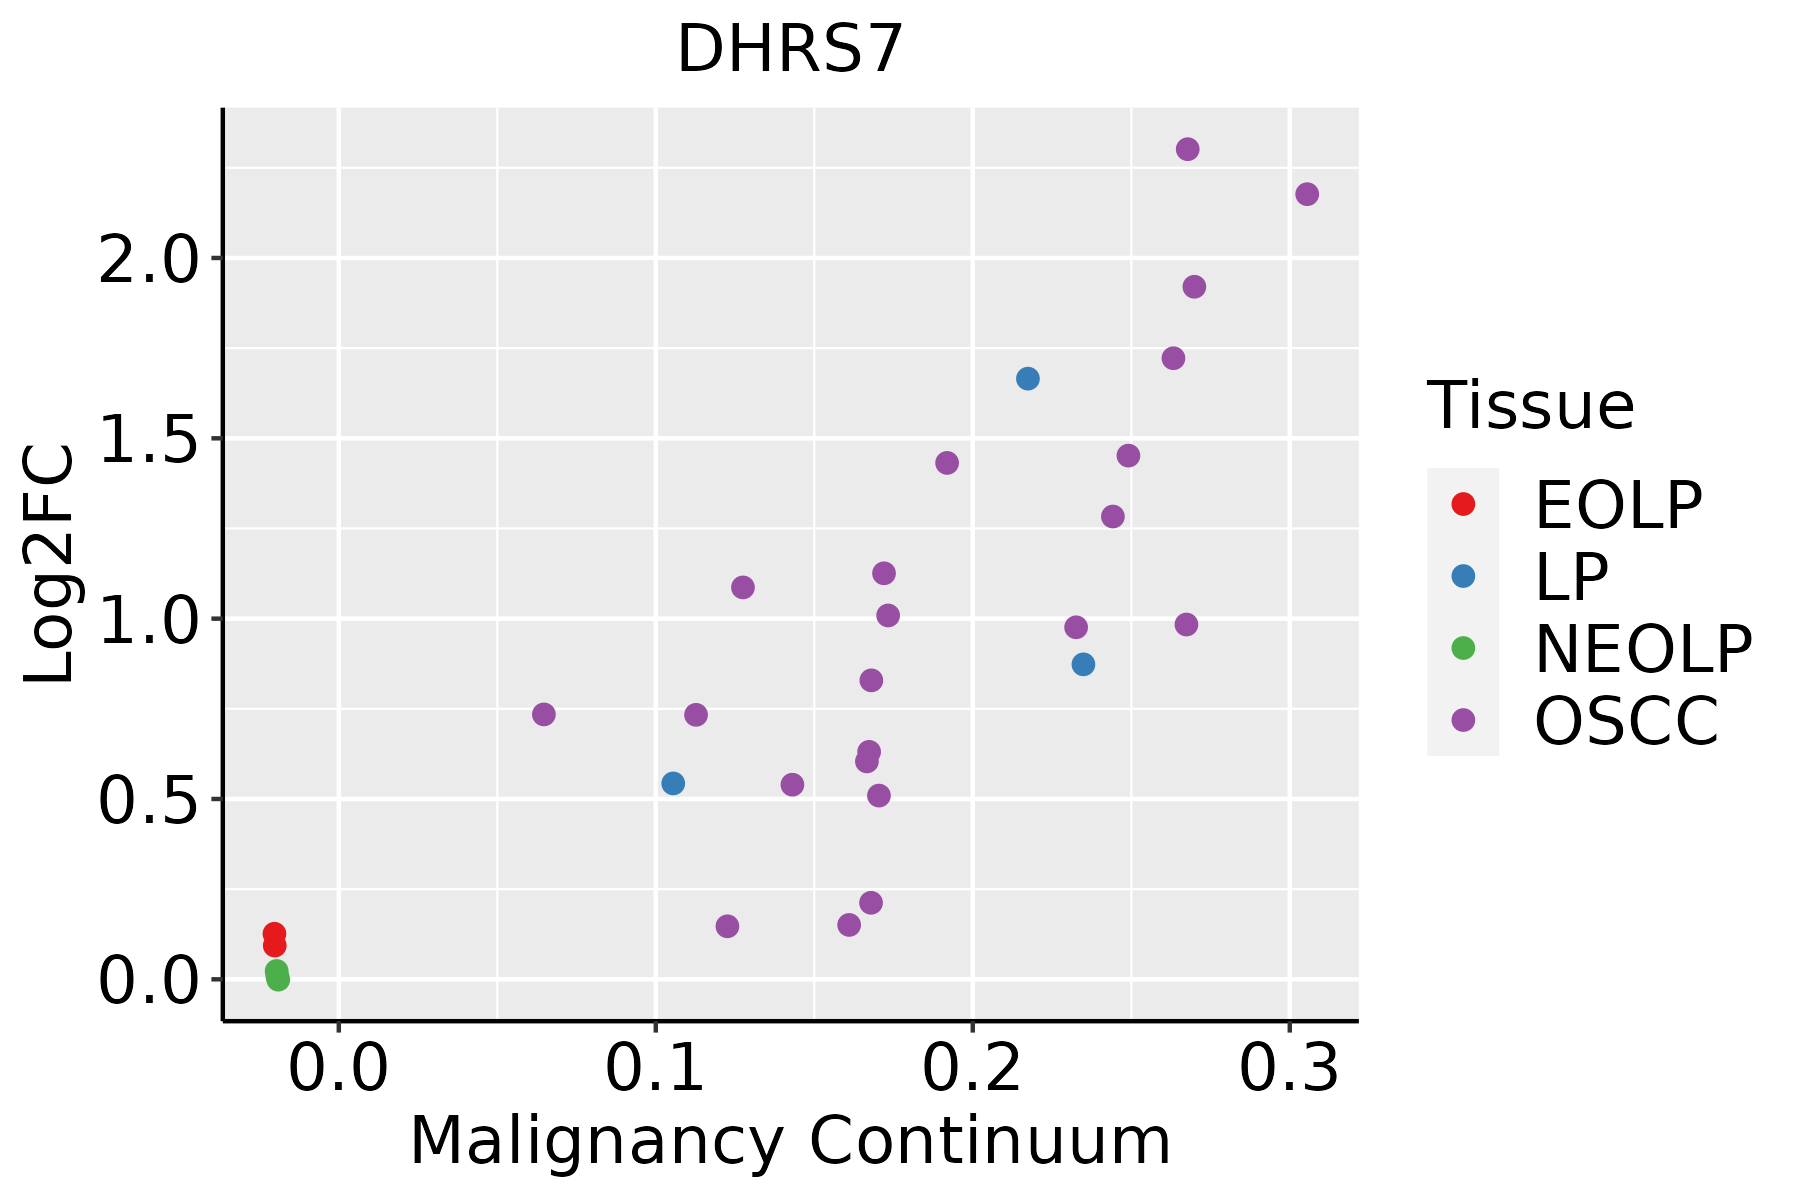 | EOLP: Erosive Oral lichen planus |
| LP: leukoplakia | ||
| NEOLP: Non-erosive oral lichen planus | ||
| OSCC: Oral squamous cell carcinoma | ||
| Prostate |  | BPH: Benign Prostatic Hyperplasia |
| Skin |  | AK: Actinic keratosis |
| cSCC: Cutaneous squamous cell carcinoma | ||
| SCCIS:squamous cell carcinoma in situ | ||
| Thyroid | 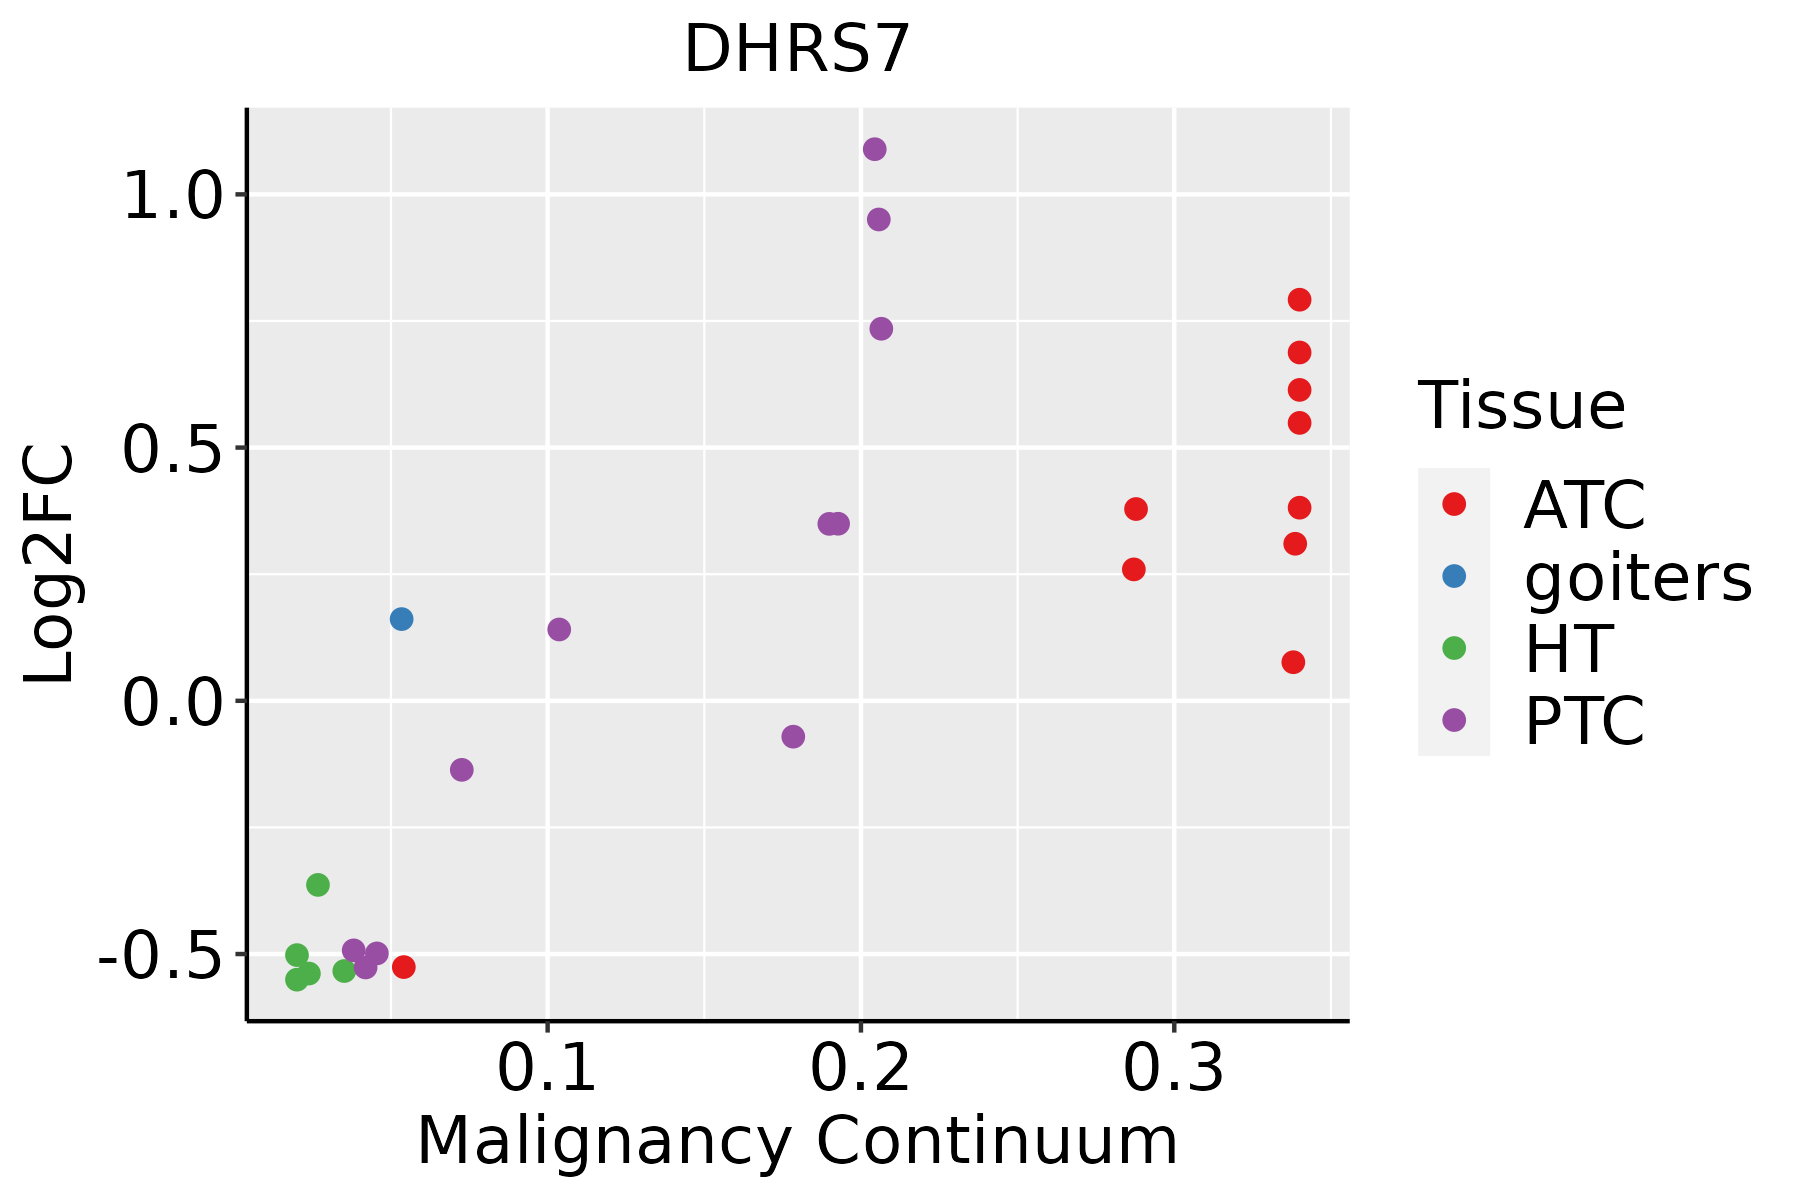 | ATC: Anaplastic thyroid cancer |
| HT: Hashimoto's thyroiditis | ||
| PTC: Papillary thyroid cancer |
| ∗log2FC in expression of this searched gene in stem-like cells from each diseased tissue sample relative to stem-like cells in normal samples in each tissue plotted against the malignancy continuum. Samples are colored based on if they are from different disease stage. |
Top |
Malignant transformation related pathway analysis |
| Find out the enriched GO biological processes and KEGG pathways involved in transition from healthy to precancer to cancer |
| Tissue | Disease Stage | Enriched GO biological Processes |
| Colorectum | AD |  |
| Colorectum | SER |  |
| Colorectum | MSS |  |
| Colorectum | MSI-H |  |
| Colorectum | FAP |  |
| ∗Top 15 enriched GO BP terms are showed in the bar plot of each disease state in each tissue. Each row represents a significant GO biological process which is colored according to the -log10(p.adjust). |
| Page: 1 2 3 4 5 6 7 8 9 |
| GO ID | Tissue | Disease Stage | Description | Gene Ratio | Bg Ratio | pvalue | p.adjust | Count |
| GO:0018904 | Colorectum | AD | ether metabolic process | 14/3918 | 27/18723 | 3.72e-04 | 4.29e-03 | 14 |
| GO:0006662 | Colorectum | AD | glycerol ether metabolic process | 12/3918 | 22/18723 | 5.38e-04 | 5.74e-03 | 12 |
| GO:0046485 | Colorectum | AD | ether lipid metabolic process | 10/3918 | 20/18723 | 3.67e-03 | 2.60e-02 | 10 |
| GO:00066621 | Colorectum | SER | glycerol ether metabolic process | 9/2897 | 22/18723 | 3.66e-03 | 3.06e-02 | 9 |
| GO:00189041 | Colorectum | SER | ether metabolic process | 10/2897 | 27/18723 | 5.18e-03 | 3.95e-02 | 10 |
| GO:00189042 | Colorectum | FAP | ether metabolic process | 10/2622 | 27/18723 | 2.46e-03 | 1.95e-02 | 10 |
| GO:00066622 | Colorectum | FAP | glycerol ether metabolic process | 8/2622 | 22/18723 | 7.51e-03 | 4.47e-02 | 8 |
| GO:00464851 | Colorectum | CRC | ether lipid metabolic process | 7/2078 | 20/18723 | 4.30e-03 | 3.47e-02 | 7 |
| GO:00189043 | Colorectum | CRC | ether metabolic process | 8/2078 | 27/18723 | 7.26e-03 | 4.98e-02 | 8 |
| GO:0008611 | Oral cavity | LP | ether lipid biosynthetic process | 7/4623 | 11/18723 | 7.01e-03 | 3.96e-02 | 7 |
| GO:0046504 | Oral cavity | LP | glycerol ether biosynthetic process | 7/4623 | 11/18723 | 7.01e-03 | 3.96e-02 | 7 |
| GO:0097384 | Oral cavity | LP | cellular lipid biosynthetic process | 7/4623 | 11/18723 | 7.01e-03 | 3.96e-02 | 7 |
| Page: 1 |
| Pathway ID | Tissue | Disease Stage | Description | Gene Ratio | Bg Ratio | pvalue | p.adjust | qvalue | Count |
| Page: 1 |
Top |
Cell-cell communication analysis |
| Identification of potential cell-cell interactions between two cell types and their ligand-receptor pairs for different disease states |
| Ligand | Receptor | LRpair | Pathway | Tissue | Disease Stage |
| Page: 1 |
Top |
Single-cell gene regulatory network inference analysis |
| Find out the significant the regulons (TFs) and the target genes of each regulon across cell types for different disease states |
| TF | Cell Type | Tissue | Disease Stage | Target Gene | RSS | Regulon Activity |
| ∗The dot plots of a searched regulon are shown for all cell subpopulations in each disease state of each tissue based on the regulon specific score inferred using pySCENIC and by calculating the average expression. |
| Page: 1 |
Top |
Somatic mutation of malignant transformation related genes |
| Annotation of somatic variants for genes involved in malignant transformation |
| Hugo Symbol | Variant Class | Variant Classification | dbSNP RS | HGVSc | HGVSp | HGVSp Short | SWISSPROT | BIOTYPE | SIFT | PolyPhen | Tumor Sample Barcode | Tissue | Histology | Sex | Age | Stage | Therapy Types | Drugs | Outcome |
| DHRS7 | SNV | Missense_Mutation | rs756832644 | c.526C>T | p.His176Tyr | p.H176Y | Q9Y394 | protein_coding | tolerated(0.08) | benign(0.134) | TCGA-D8-A27G-01 | Breast | breast invasive carcinoma | Female | >=65 | I/II | Unknown | Unknown | SD |
| DHRS7 | insertion | Nonsense_Mutation | novel | c.444_445insAAATTATAAGGCCAATAGGAAAAGAAT | p.Met148_Asp149insLysLeuTerGlyGlnTerGluLysAsn | p.M148_D149insKL*GQ*EKN | Q9Y394 | protein_coding | TCGA-A8-A08H-01 | Breast | breast invasive carcinoma | Female | >=65 | I/II | Unknown | Unknown | SD | ||
| DHRS7 | SNV | Missense_Mutation | rs766188972 | c.397N>A | p.Asp133Asn | p.D133N | Q9Y394 | protein_coding | deleterious(0) | probably_damaging(1) | TCGA-2W-A8YY-01 | Cervix | cervical & endocervical cancer | Female | <65 | I/II | Chemotherapy | cisplatin | CR |
| DHRS7 | SNV | Missense_Mutation | c.942N>T | p.Lys314Asn | p.K314N | Q9Y394 | protein_coding | deleterious(0.03) | benign(0.006) | TCGA-AA-3510-01 | Colorectum | colon adenocarcinoma | Male | >=65 | I/II | Unknown | Unknown | SD | |
| DHRS7 | SNV | Missense_Mutation | rs763203291 | c.238T>A | p.Ser80Thr | p.S80T | Q9Y394 | protein_coding | deleterious(0.04) | probably_damaging(1) | TCGA-AZ-6601-01 | Colorectum | colon adenocarcinoma | Male | >=65 | I/II | Unknown | Unknown | PD |
| DHRS7 | SNV | Missense_Mutation | c.994N>G | p.Lys332Glu | p.K332E | Q9Y394 | protein_coding | tolerated_low_confidence(0.48) | benign(0.024) | TCGA-CA-6718-01 | Colorectum | colon adenocarcinoma | Male | <65 | I/II | Unknown | Unknown | PD | |
| DHRS7 | insertion | Frame_Shift_Ins | novel | c.444_445insATAT | p.Asp149IlefsTer2 | p.D149Ifs*2 | Q9Y394 | protein_coding | TCGA-AM-5820-01 | Colorectum | colon adenocarcinoma | Female | <65 | I/II | Unknown | Unknown | SD | ||
| DHRS7 | SNV | Missense_Mutation | rs768199302 | c.812G>A | p.Arg271Gln | p.R271Q | Q9Y394 | protein_coding | tolerated(0.32) | benign(0.033) | TCGA-A5-A0G2-01 | Endometrium | uterine corpus endometrioid carcinoma | Female | <65 | III/IV | Unknown | Unknown | SD |
| DHRS7 | SNV | Missense_Mutation | novel | c.710T>C | p.Val237Ala | p.V237A | Q9Y394 | protein_coding | deleterious(0) | probably_damaging(0.933) | TCGA-A5-A0G2-01 | Endometrium | uterine corpus endometrioid carcinoma | Female | <65 | III/IV | Unknown | Unknown | SD |
| DHRS7 | SNV | Missense_Mutation | novel | c.569G>T | p.Ser190Ile | p.S190I | Q9Y394 | protein_coding | deleterious(0) | probably_damaging(0.999) | TCGA-A5-A0G2-01 | Endometrium | uterine corpus endometrioid carcinoma | Female | <65 | III/IV | Unknown | Unknown | SD |
| Page: 1 2 3 4 5 |
Top |
Related drugs of malignant transformation related genes |
| Identification of chemicals and drugs interact with genes involved in malignant transfromation |
| (DGIdb 4.0) |
| Entrez ID | Symbol | Category | Interaction Types | Drug Claim Name | Drug Name | PMIDs |
| Page: 1 |

Copyright 2023-Present -The University of Texas Health Science Center at Houston |