
|
|||||
|
 | |
| |
| |
| |
| |
| |
|
Gene: DHRS4L2 |
Gene summary for DHRS4L2 |
| Gene information | Species | Human | Gene symbol | DHRS4L2 | Gene ID | 317749 |
| Gene name | dehydrogenase/reductase 4 like 2 | |
| Gene Alias | SDR25C3 | |
| Cytomap | 14q11.2 | |
| Gene Type | protein-coding | GO ID | GO:0005575 | UniProtAcc | D5KJA1 |
Top |
Malignant transformation analysis |
| Identification of the aberrant gene expression in precancerous and cancerous lesions by comparing the gene expression of stem-like cells in diseased tissues with normal stem cells |
| Entrez ID | Symbol | Replicates | Species | Organ | Tissue | Adj P-value | Log2FC | Malignancy |
| 317749 | DHRS4L2 | HTA11_78_2000001011 | Human | Colorectum | AD | 5.38e-03 | 3.18e-01 | -0.1088 |
| 317749 | DHRS4L2 | HTA11_347_2000001011 | Human | Colorectum | AD | 1.26e-11 | 4.61e-01 | -0.1954 |
| 317749 | DHRS4L2 | HTA11_83_2000001011 | Human | Colorectum | SER | 4.64e-10 | 6.67e-01 | -0.1526 |
| 317749 | DHRS4L2 | HTA11_696_2000001011 | Human | Colorectum | AD | 3.96e-07 | 4.37e-01 | -0.1464 |
| 317749 | DHRS4L2 | HTA11_1391_2000001011 | Human | Colorectum | AD | 5.12e-09 | 5.44e-01 | -0.059 |
| 317749 | DHRS4L2 | HTA11_5216_2000001011 | Human | Colorectum | SER | 4.24e-05 | 5.49e-01 | -0.1462 |
| 317749 | DHRS4L2 | HTA11_7862_2000001011 | Human | Colorectum | AD | 2.31e-09 | 7.68e-01 | -0.0179 |
| 317749 | DHRS4L2 | HTA11_866_3004761011 | Human | Colorectum | AD | 7.21e-10 | 4.65e-01 | 0.096 |
| 317749 | DHRS4L2 | HTA11_7663_2000001011 | Human | Colorectum | SER | 4.38e-02 | 4.18e-01 | 0.0131 |
| 317749 | DHRS4L2 | HTA11_10623_2000001011 | Human | Colorectum | AD | 5.49e-19 | 1.03e+00 | -0.0177 |
| 317749 | DHRS4L2 | HTA11_10711_2000001011 | Human | Colorectum | AD | 2.63e-04 | 3.63e-01 | 0.0338 |
| 317749 | DHRS4L2 | HTA11_7696_3000711011 | Human | Colorectum | AD | 2.45e-03 | 3.33e-01 | 0.0674 |
| 317749 | DHRS4L2 | HTA11_99999970781_79442 | Human | Colorectum | MSS | 6.14e-17 | 6.39e-01 | 0.294 |
| 317749 | DHRS4L2 | HTA11_99999965104_69814 | Human | Colorectum | MSS | 5.53e-05 | 4.72e-01 | 0.281 |
| 317749 | DHRS4L2 | HTA11_99999974143_84620 | Human | Colorectum | MSS | 9.43e-04 | 2.99e-01 | 0.3005 |
| 317749 | DHRS4L2 | A015-C-203 | Human | Colorectum | FAP | 3.24e-02 | -2.19e-02 | -0.1294 |
| 317749 | DHRS4L2 | A015-C-104 | Human | Colorectum | FAP | 1.31e-03 | -5.64e-02 | -0.1899 |
| 317749 | DHRS4L2 | A002-C-116 | Human | Colorectum | FAP | 2.90e-03 | -9.50e-02 | -0.0452 |
| 317749 | DHRS4L2 | LZE4T | Human | Esophagus | ESCC | 8.12e-12 | 6.62e-01 | 0.0811 |
| 317749 | DHRS4L2 | LZE8T | Human | Esophagus | ESCC | 1.48e-03 | 1.02e-01 | 0.067 |
| Page: 1 2 3 4 5 6 7 |
| Tissue | Expression Dynamics | Abbreviation |
| Colorectum (GSE201348) |  | FAP: Familial adenomatous polyposis |
| CRC: Colorectal cancer | ||
| Colorectum (HTA11) |  | AD: Adenomas |
| SER: Sessile serrated lesions | ||
| MSI-H: Microsatellite-high colorectal cancer | ||
| MSS: Microsatellite stable colorectal cancer | ||
| Esophagus | 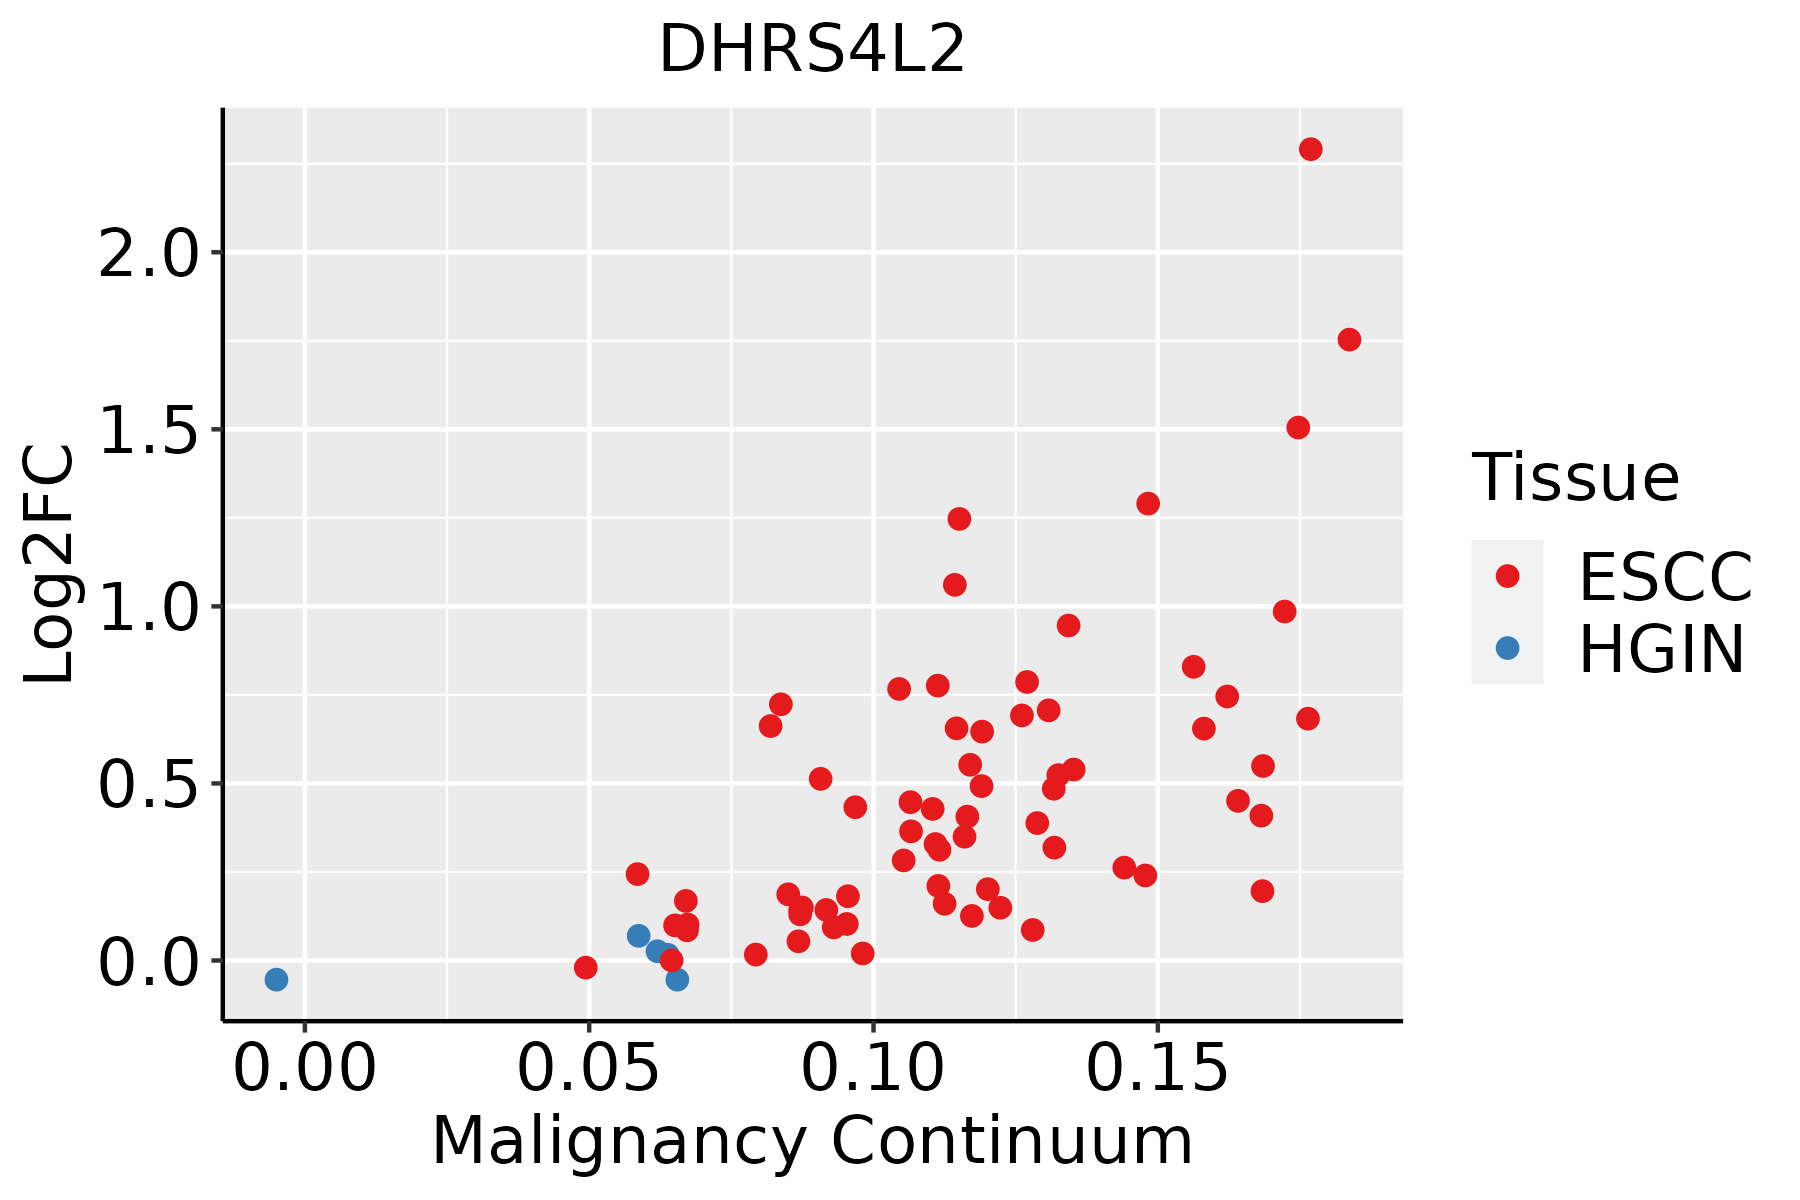 | ESCC: Esophageal squamous cell carcinoma |
| HGIN: High-grade intraepithelial neoplasias | ||
| LGIN: Low-grade intraepithelial neoplasias | ||
| Liver | 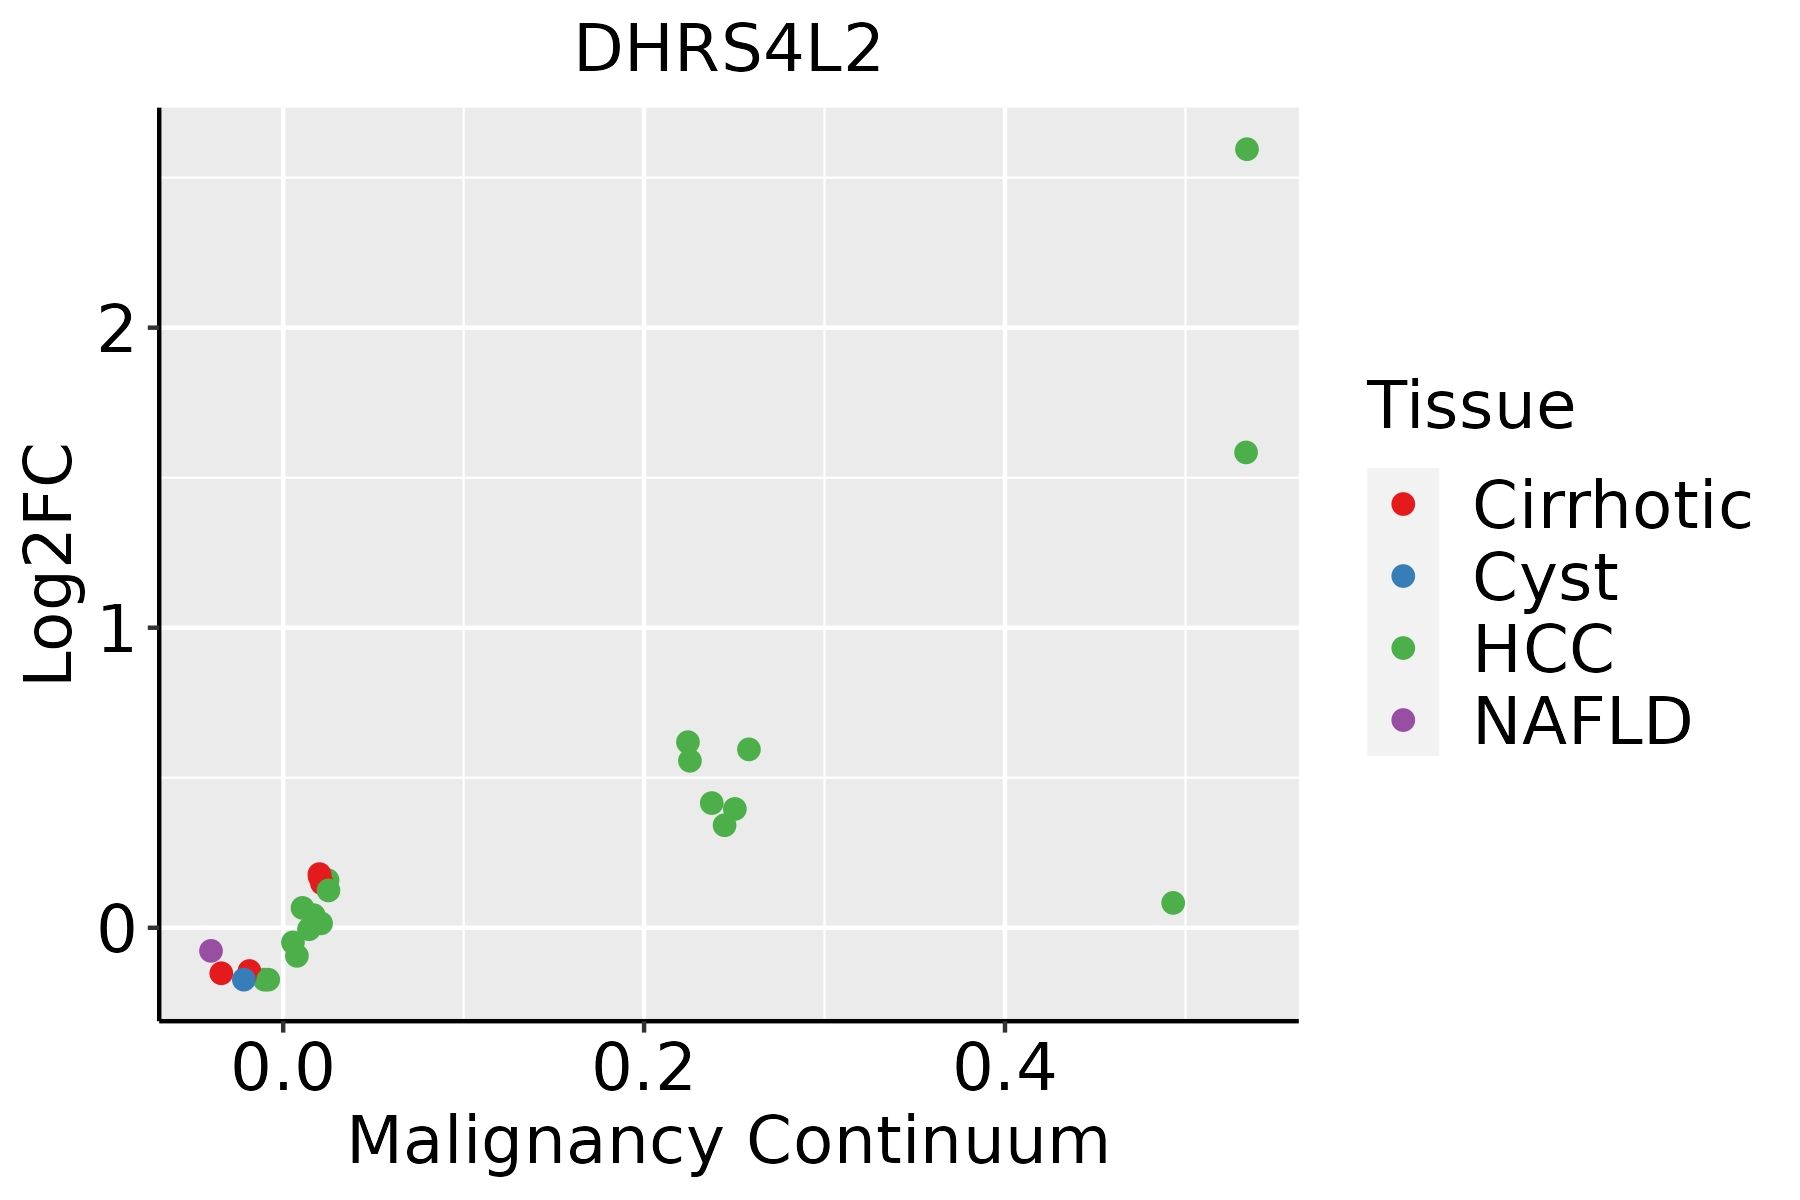 | HCC: Hepatocellular carcinoma |
| NAFLD: Non-alcoholic fatty liver disease | ||
| Oral Cavity | 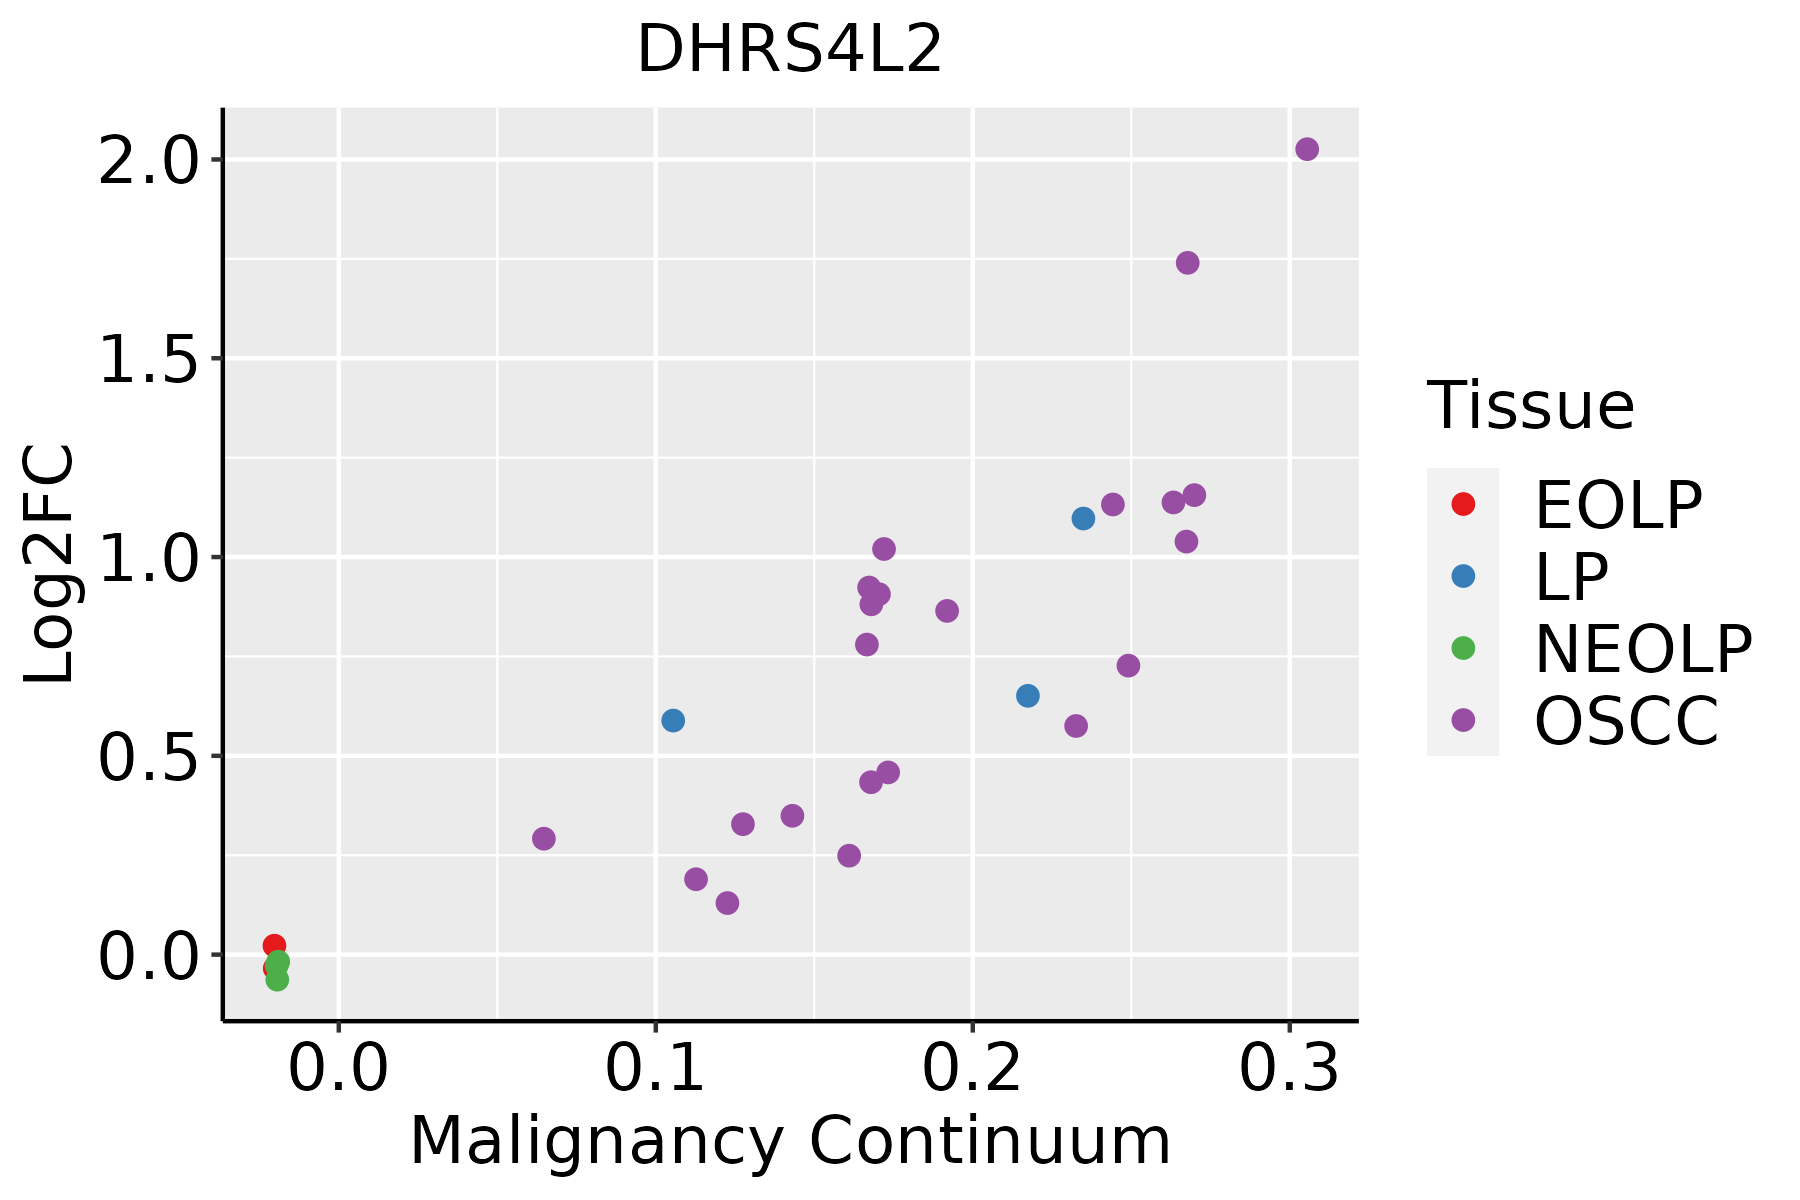 | EOLP: Erosive Oral lichen planus |
| LP: leukoplakia | ||
| NEOLP: Non-erosive oral lichen planus | ||
| OSCC: Oral squamous cell carcinoma | ||
| Skin |  | AK: Actinic keratosis |
| cSCC: Cutaneous squamous cell carcinoma | ||
| SCCIS:squamous cell carcinoma in situ | ||
| Thyroid | 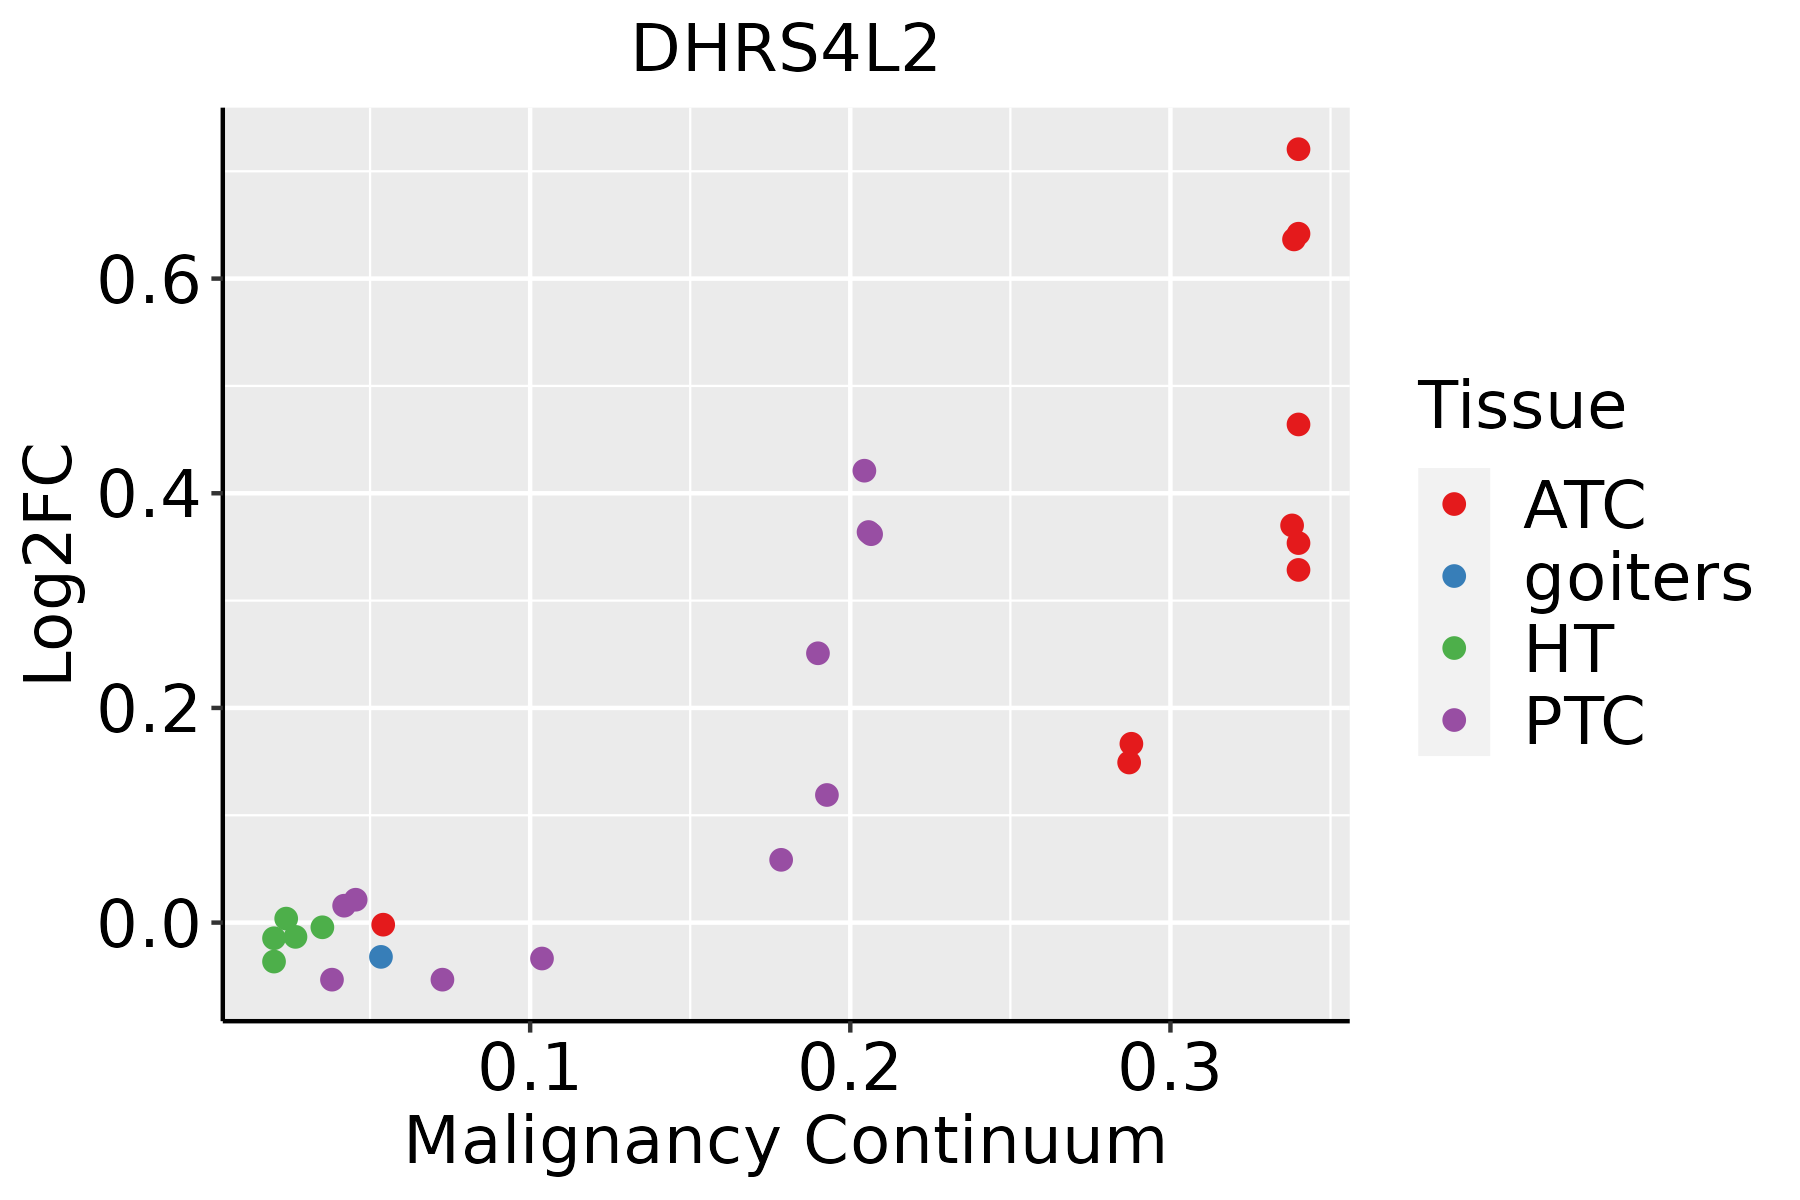 | ATC: Anaplastic thyroid cancer |
| HT: Hashimoto's thyroiditis | ||
| PTC: Papillary thyroid cancer |
| ∗log2FC in expression of this searched gene in stem-like cells from each diseased tissue sample relative to stem-like cells in normal samples in each tissue plotted against the malignancy continuum. Samples are colored based on if they are from different disease stage. |
Top |
Malignant transformation related pathway analysis |
| Find out the enriched GO biological processes and KEGG pathways involved in transition from healthy to precancer to cancer |
| Tissue | Disease Stage | Enriched GO biological Processes |
| Colorectum | AD |  |
| Colorectum | SER |  |
| Colorectum | MSS |  |
| Colorectum | MSI-H |  |
| Colorectum | FAP |  |
| ∗Top 15 enriched GO BP terms are showed in the bar plot of each disease state in each tissue. Each row represents a significant GO biological process which is colored according to the -log10(p.adjust). |
| Page: 1 2 3 4 5 6 7 8 9 |
| GO ID | Tissue | Disease Stage | Description | Gene Ratio | Bg Ratio | pvalue | p.adjust | Count |
| Page: 1 |
| Pathway ID | Tissue | Disease Stage | Description | Gene Ratio | Bg Ratio | pvalue | p.adjust | qvalue | Count |
| Page: 1 |
Top |
Cell-cell communication analysis |
| Identification of potential cell-cell interactions between two cell types and their ligand-receptor pairs for different disease states |
| Ligand | Receptor | LRpair | Pathway | Tissue | Disease Stage |
| Page: 1 |
Top |
Single-cell gene regulatory network inference analysis |
| Find out the significant the regulons (TFs) and the target genes of each regulon across cell types for different disease states |
| TF | Cell Type | Tissue | Disease Stage | Target Gene | RSS | Regulon Activity |
| ∗The dot plots of a searched regulon are shown for all cell subpopulations in each disease state of each tissue based on the regulon specific score inferred using pySCENIC and by calculating the average expression. |
| Page: 1 |
Top |
Somatic mutation of malignant transformation related genes |
| Annotation of somatic variants for genes involved in malignant transformation |
| Hugo Symbol | Variant Class | Variant Classification | dbSNP RS | HGVSc | HGVSp | HGVSp Short | SWISSPROT | BIOTYPE | SIFT | PolyPhen | Tumor Sample Barcode | Tissue | Histology | Sex | Age | Stage | Therapy Types | Drugs | Outcome |
| DHRS4L2 | SNV | Missense_Mutation | c.461N>T | p.Pro154Leu | p.P154L | Q6PKH6 | protein_coding | deleterious(0) | probably_damaging(0.999) | TCGA-AN-A0FV-01 | Breast | breast invasive carcinoma | Female | <65 | I/II | Unknown | Unknown | SD | |
| DHRS4L2 | SNV | Missense_Mutation | c.389N>T | p.Thr130Ile | p.T130I | Q6PKH6 | protein_coding | deleterious(0.01) | benign(0.25) | TCGA-BH-A0HF-01 | Breast | breast invasive carcinoma | Female | >=65 | I/II | Hormone Therapy | arimidex | SD | |
| DHRS4L2 | SNV | Missense_Mutation | c.527C>G | p.Ser176Cys | p.S176C | Q6PKH6 | protein_coding | tolerated(0.14) | possibly_damaging(0.478) | TCGA-GM-A2DD-01 | Breast | breast invasive carcinoma | Female | <65 | I/II | Chemotherapy | fluorouracil | CR | |
| DHRS4L2 | SNV | Missense_Mutation | novel | c.304N>G | p.Met102Val | p.M102V | Q6PKH6 | protein_coding | tolerated(0.17) | benign(0) | TCGA-S3-AA17-01 | Breast | breast invasive carcinoma | Female | <65 | I/II | Hormone Therapy | anastrozole | SD |
| DHRS4L2 | SNV | Missense_Mutation | rs762000184 | c.350N>T | p.Ala117Val | p.A117V | Q6PKH6 | protein_coding | deleterious(0.02) | possibly_damaging(0.739) | TCGA-AZ-4315-01 | Colorectum | colon adenocarcinoma | Male | <65 | I/II | Unknown | Unknown | SD |
| DHRS4L2 | SNV | Missense_Mutation | c.227N>C | p.Leu76Pro | p.L76P | Q6PKH6 | protein_coding | deleterious(0) | probably_damaging(1) | TCGA-CK-5916-01 | Colorectum | colon adenocarcinoma | Female | >=65 | I/II | Unknown | Unknown | PD | |
| DHRS4L2 | SNV | Missense_Mutation | novel | c.104C>T | p.Ala35Val | p.A35V | Q6PKH6 | protein_coding | deleterious(0.01) | probably_damaging(0.986) | TCGA-AP-A1DK-01 | Endometrium | uterine corpus endometrioid carcinoma | Female | <65 | I/II | Unknown | Unknown | SD |
| DHRS4L2 | SNV | Missense_Mutation | novel | c.655N>C | p.Ser219Pro | p.S219P | Q6PKH6 | protein_coding | tolerated(0.22) | benign(0.367) | TCGA-AP-A1E0-01 | Endometrium | uterine corpus endometrioid carcinoma | Female | <65 | III/IV | Chemotherapy | paclitaxel | SD |
| DHRS4L2 | SNV | Missense_Mutation | c.461C>A | p.Pro154Gln | p.P154Q | Q6PKH6 | protein_coding | deleterious(0) | probably_damaging(0.998) | TCGA-AX-A3G6-01 | Endometrium | uterine corpus endometrioid carcinoma | Female | >=65 | I/II | Unknown | Unknown | SD | |
| DHRS4L2 | SNV | Missense_Mutation | c.452N>T | p.Ala151Val | p.A151V | Q6PKH6 | protein_coding | tolerated(0.1) | benign(0.037) | TCGA-BG-A0MT-01 | Endometrium | uterine corpus endometrioid carcinoma | Female | <65 | I/II | Unknown | Unknown | PD |
| Page: 1 2 |
Top |
Related drugs of malignant transformation related genes |
| Identification of chemicals and drugs interact with genes involved in malignant transfromation |
| (DGIdb 4.0) |
| Entrez ID | Symbol | Category | Interaction Types | Drug Claim Name | Drug Name | PMIDs |
| Page: 1 |

Copyright 2023-Present -The University of Texas Health Science Center at Houston |