
|
|||||
|
 | |
| |
| |
| |
| |
| |
|
Gene: DHRS2 |
Gene summary for DHRS2 |
| Gene information | Species | Human | Gene symbol | DHRS2 | Gene ID | 10202 |
| Gene name | dehydrogenase/reductase 2 | |
| Gene Alias | HEP27 | |
| Cytomap | 14q11.2 | |
| Gene Type | protein-coding | GO ID | GO:0001773 | UniProtAcc | Q13268 |
Top |
Malignant transformation analysis |
| Identification of the aberrant gene expression in precancerous and cancerous lesions by comparing the gene expression of stem-like cells in diseased tissues with normal stem cells |
| Entrez ID | Symbol | Replicates | Species | Organ | Tissue | Adj P-value | Log2FC | Malignancy |
| 10202 | DHRS2 | GSM4909289 | Human | Breast | IDC | 3.38e-03 | 2.56e-01 | 0.1064 |
| 10202 | DHRS2 | GSM4909294 | Human | Breast | IDC | 3.28e-22 | 5.76e-01 | 0.2022 |
| 10202 | DHRS2 | GSM4909305 | Human | Breast | IDC | 7.92e-13 | 3.09e-01 | 0.0436 |
| 10202 | DHRS2 | GSM4909306 | Human | Breast | IDC | 7.53e-57 | 9.33e-01 | 0.1564 |
| 10202 | DHRS2 | GSM4909313 | Human | Breast | IDC | 4.64e-15 | 5.33e-01 | 0.0391 |
| 10202 | DHRS2 | GSM4909319 | Human | Breast | IDC | 2.20e-11 | 4.87e-01 | 0.1563 |
| 10202 | DHRS2 | M1 | Human | Breast | IDC | 9.96e-88 | 1.49e+00 | 0.1577 |
| 10202 | DHRS2 | NCCBC2 | Human | Breast | DCIS | 4.93e-02 | 3.49e-01 | 0.1554 |
| 10202 | DHRS2 | NCCBC6 | Human | Breast | DCIS | 8.25e-03 | 3.68e-01 | 0.2095 |
| 10202 | DHRS2 | P1 | Human | Breast | IDC | 8.40e-46 | 1.23e+00 | 0.1527 |
| 10202 | DHRS2 | P3 | Human | Breast | IDC | 9.65e-22 | 1.15e+00 | 0.1542 |
| 10202 | DHRS2 | P5T-E | Human | Esophagus | ESCC | 2.62e-77 | 2.42e+00 | 0.1327 |
| 10202 | DHRS2 | P11T-E | Human | Esophagus | ESCC | 1.23e-16 | 3.53e+00 | 0.1426 |
| 10202 | DHRS2 | P12T-E | Human | Esophagus | ESCC | 9.20e-06 | 3.43e-01 | 0.1122 |
| 10202 | DHRS2 | P23T-E | Human | Esophagus | ESCC | 2.99e-40 | 1.92e+00 | 0.108 |
| 10202 | DHRS2 | P26T-E | Human | Esophagus | ESCC | 1.07e-139 | 4.48e+00 | 0.1276 |
| 10202 | DHRS2 | P128T-E | Human | Esophagus | ESCC | 1.45e-17 | 8.72e-01 | 0.1241 |
| 10202 | DHRS2 | ATC09 | Human | Thyroid | ATC | 2.96e-25 | 1.21e+00 | 0.2871 |
| 10202 | DHRS2 | ATC1 | Human | Thyroid | ATC | 1.78e-27 | 1.35e+00 | 0.2878 |
| Page: 1 |
| Tissue | Expression Dynamics | Abbreviation |
| Breast | 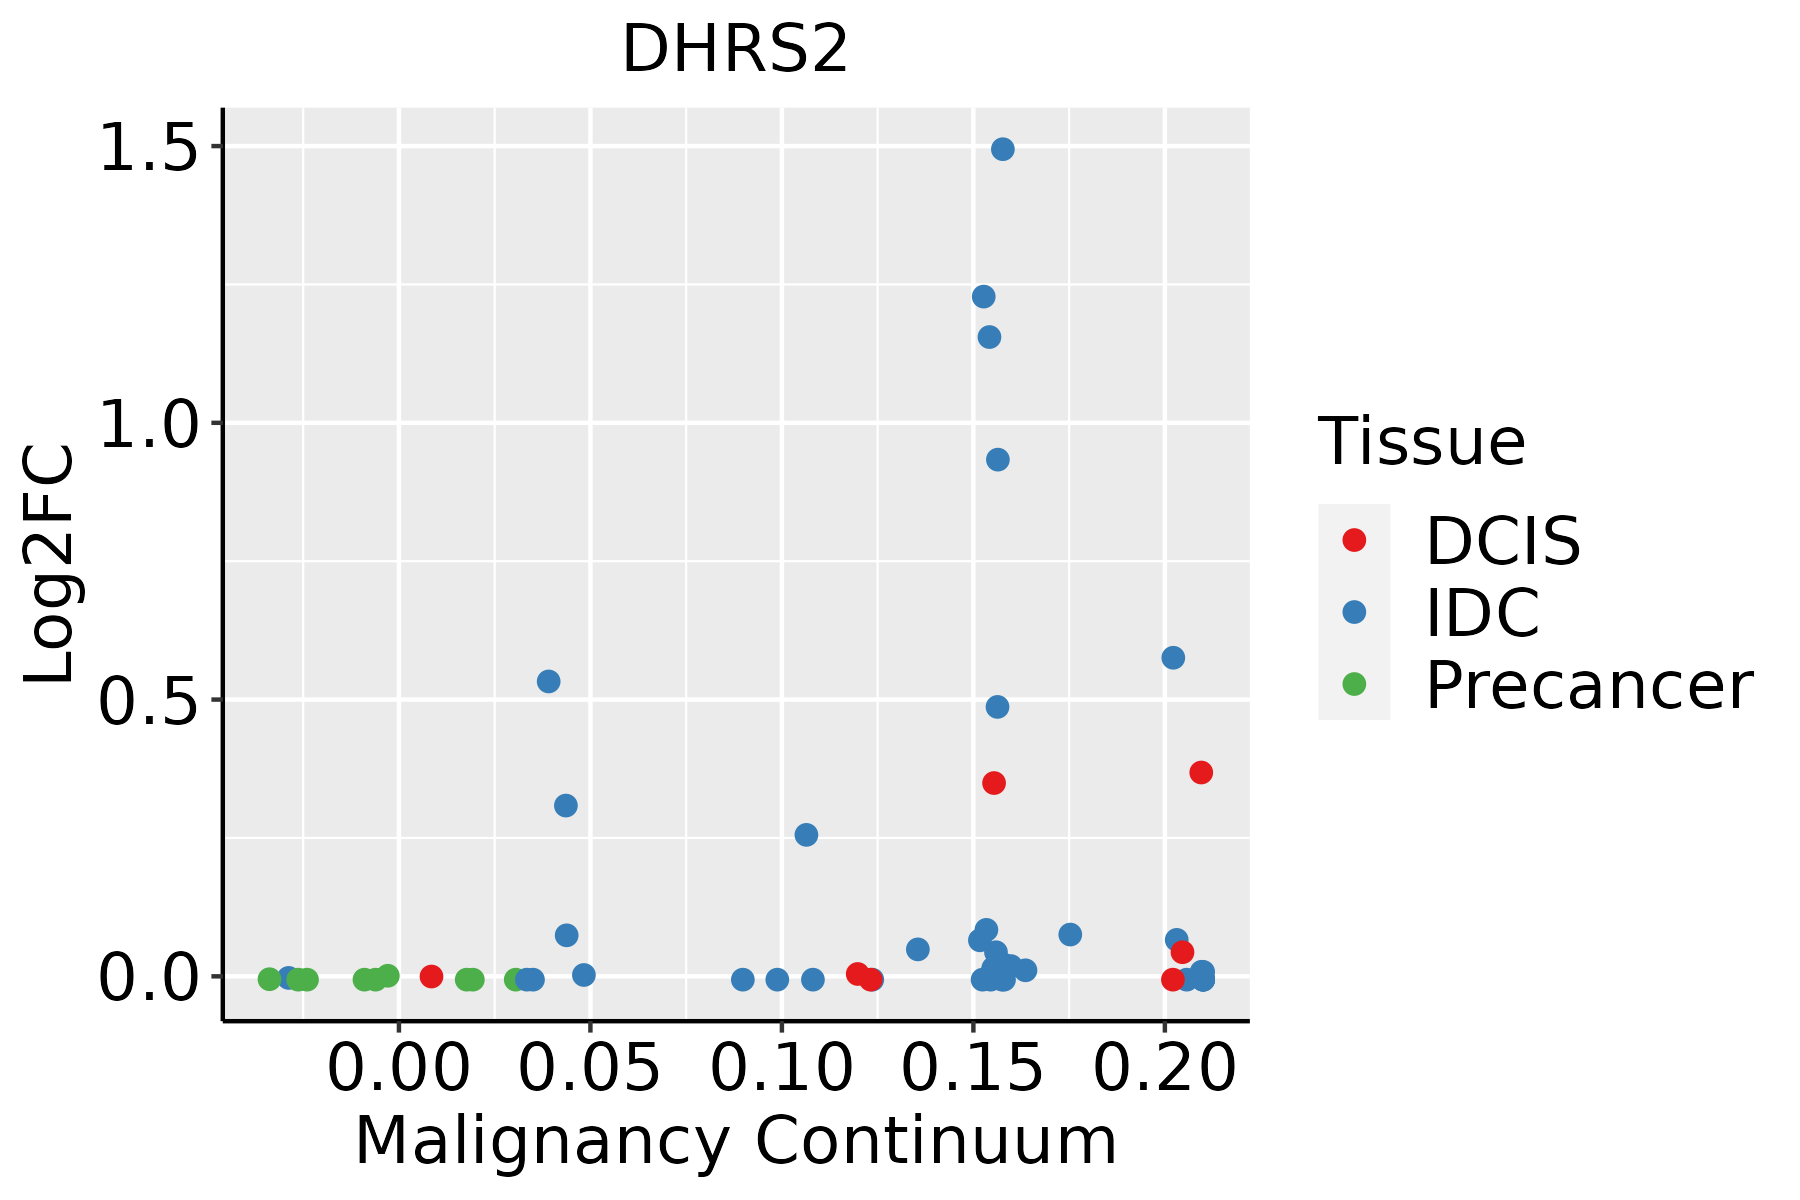 | IDC: Invasive ductal carcinoma |
| DCIS: Ductal carcinoma in situ | ||
| Precancer(BRCA1-mut): Precancerous lesion from BRCA1 mutation carriers | ||
| Esophagus | 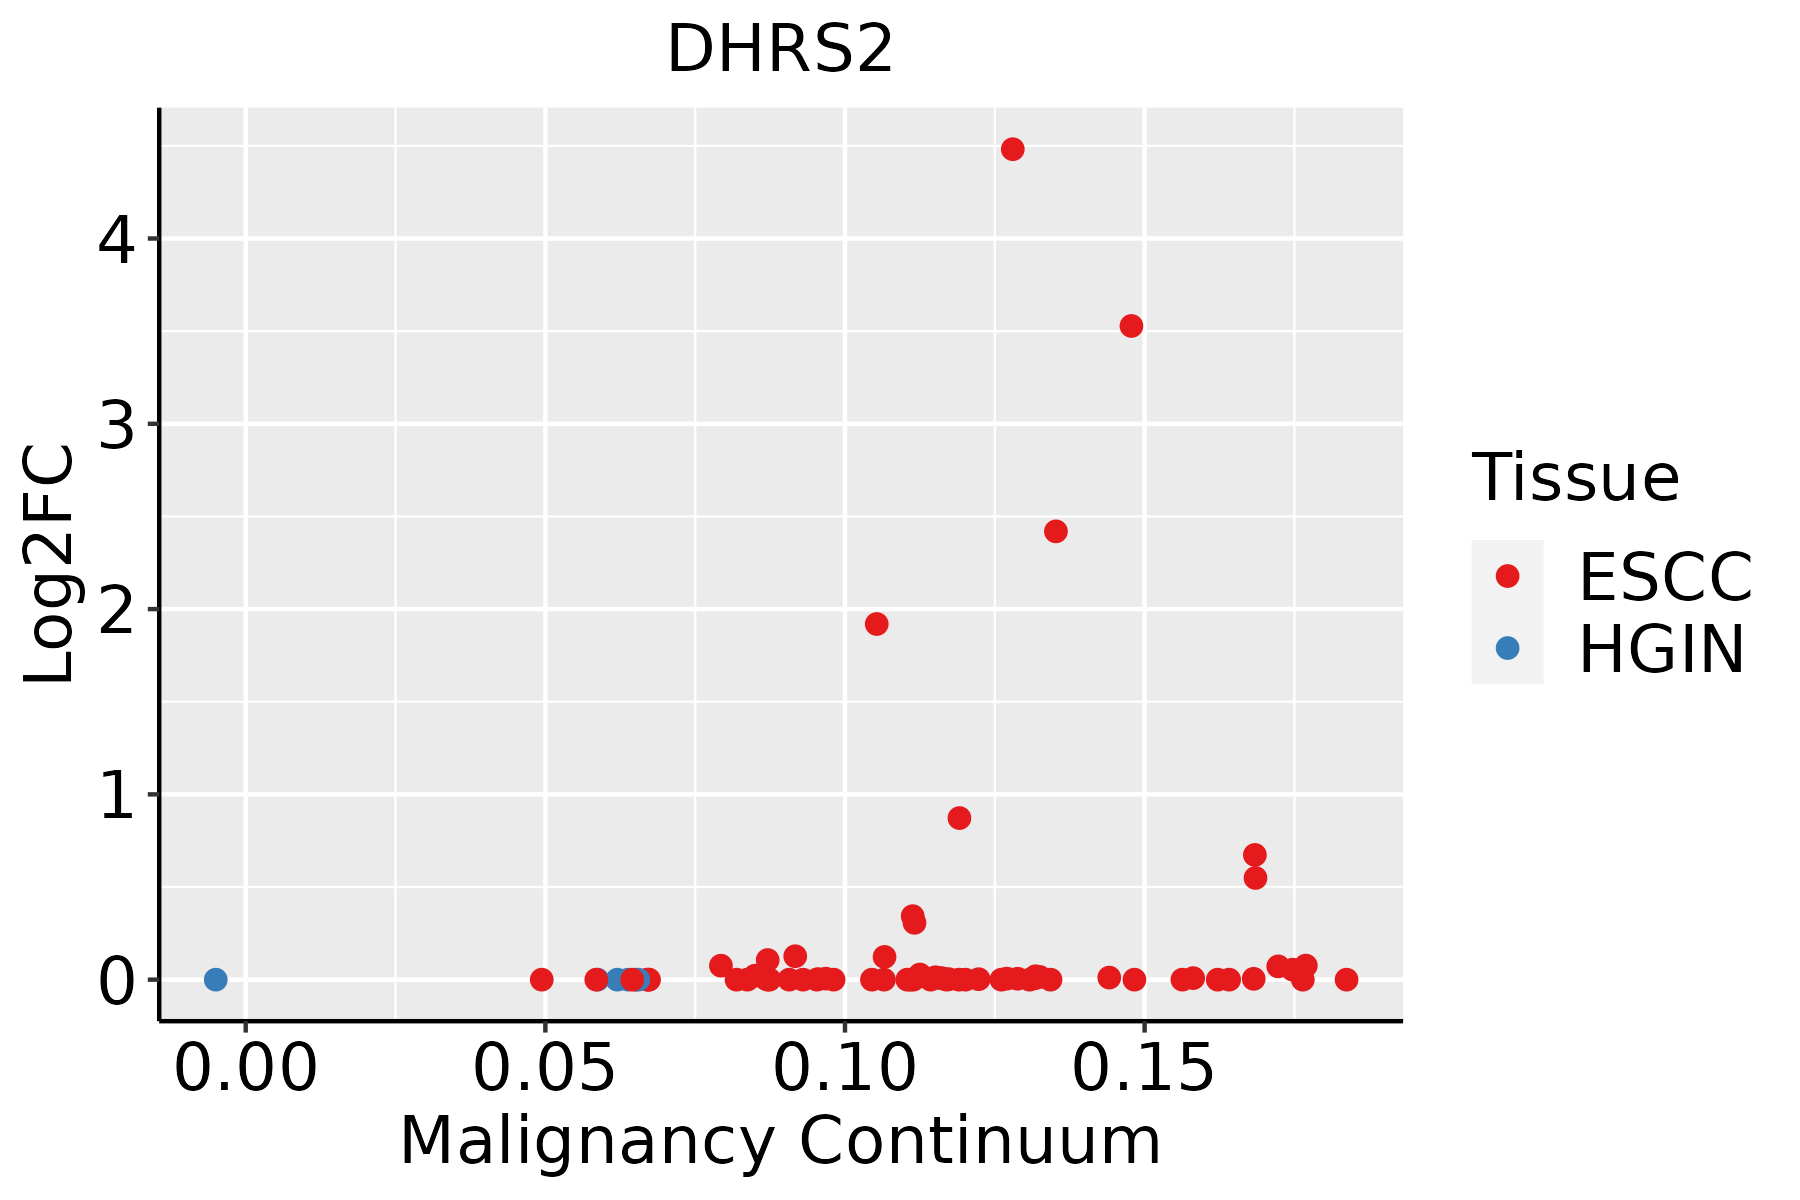 | ESCC: Esophageal squamous cell carcinoma |
| HGIN: High-grade intraepithelial neoplasias | ||
| LGIN: Low-grade intraepithelial neoplasias | ||
| Thyroid | 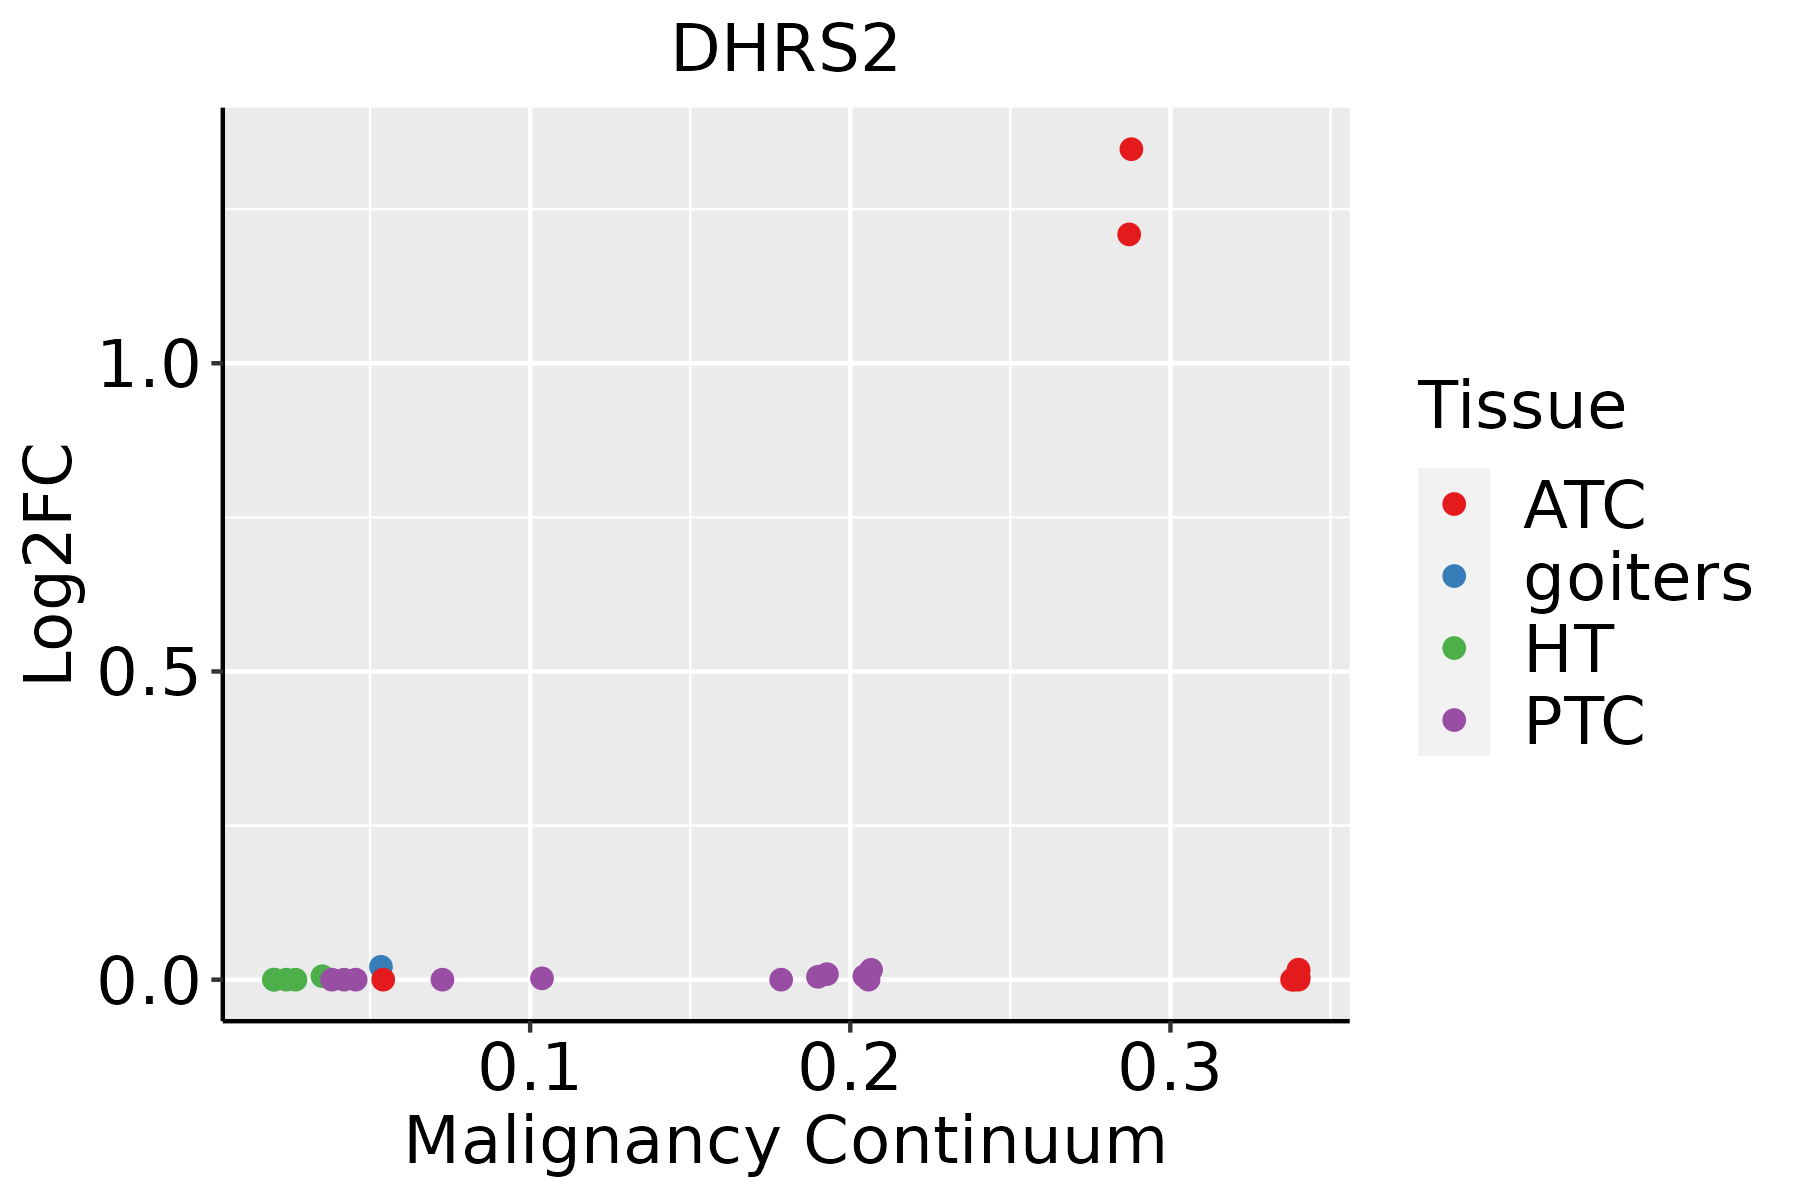 | ATC: Anaplastic thyroid cancer |
| HT: Hashimoto's thyroiditis | ||
| PTC: Papillary thyroid cancer |
| ∗log2FC in expression of this searched gene in stem-like cells from each diseased tissue sample relative to stem-like cells in normal samples in each tissue plotted against the malignancy continuum. Samples are colored based on if they are from different disease stage. |
Top |
Malignant transformation related pathway analysis |
| Find out the enriched GO biological processes and KEGG pathways involved in transition from healthy to precancer to cancer |
| Tissue | Disease Stage | Enriched GO biological Processes |
| Colorectum | AD |  |
| Colorectum | SER |  |
| Colorectum | MSS |  |
| Colorectum | MSI-H |  |
| Colorectum | FAP |  |
| ∗Top 15 enriched GO BP terms are showed in the bar plot of each disease state in each tissue. Each row represents a significant GO biological process which is colored according to the -log10(p.adjust). |
| Page: 1 2 3 4 5 6 7 8 9 |
| GO ID | Tissue | Disease Stage | Description | Gene Ratio | Bg Ratio | pvalue | p.adjust | Count |
| GO:000609113 | Breast | IDC | generation of precursor metabolites and energy | 103/1434 | 490/18723 | 1.53e-21 | 1.74e-18 | 103 |
| GO:002290013 | Breast | IDC | electron transport chain | 51/1434 | 175/18723 | 2.23e-17 | 8.43e-15 | 51 |
| GO:000697914 | Breast | IDC | response to oxidative stress | 83/1434 | 446/18723 | 2.36e-14 | 7.06e-12 | 83 |
| GO:006219714 | Breast | IDC | cellular response to chemical stress | 55/1434 | 337/18723 | 7.07e-08 | 4.36e-06 | 55 |
| GO:000963613 | Breast | IDC | response to toxic substance | 44/1434 | 262/18723 | 6.33e-07 | 3.00e-05 | 44 |
| GO:003009914 | Breast | IDC | myeloid cell differentiation | 54/1434 | 381/18723 | 8.07e-06 | 2.39e-04 | 54 |
| GO:003459914 | Breast | IDC | cellular response to oxidative stress | 44/1434 | 288/18723 | 8.26e-06 | 2.43e-04 | 44 |
| GO:000257312 | Breast | IDC | myeloid leukocyte differentiation | 33/1434 | 208/18723 | 5.02e-05 | 1.09e-03 | 33 |
| GO:190313111 | Breast | IDC | mononuclear cell differentiation | 51/1434 | 426/18723 | 9.81e-04 | 1.11e-02 | 51 |
| GO:000609123 | Breast | DCIS | generation of precursor metabolites and energy | 103/1390 | 490/18723 | 1.46e-22 | 1.65e-19 | 103 |
| GO:002290023 | Breast | DCIS | electron transport chain | 51/1390 | 175/18723 | 6.01e-18 | 2.62e-15 | 51 |
| GO:000697924 | Breast | DCIS | response to oxidative stress | 82/1390 | 446/18723 | 1.22e-14 | 3.85e-12 | 82 |
| GO:006219724 | Breast | DCIS | cellular response to chemical stress | 56/1390 | 337/18723 | 9.64e-09 | 7.38e-07 | 56 |
| GO:003009924 | Breast | DCIS | myeloid cell differentiation | 55/1390 | 381/18723 | 1.50e-06 | 5.68e-05 | 55 |
| GO:003459924 | Breast | DCIS | cellular response to oxidative stress | 45/1390 | 288/18723 | 1.57e-06 | 5.88e-05 | 45 |
| GO:000963623 | Breast | DCIS | response to toxic substance | 42/1390 | 262/18723 | 1.76e-06 | 6.56e-05 | 42 |
| GO:000257321 | Breast | DCIS | myeloid leukocyte differentiation | 34/1390 | 208/18723 | 1.08e-05 | 2.83e-04 | 34 |
| GO:19031312 | Breast | DCIS | mononuclear cell differentiation | 51/1390 | 426/18723 | 4.88e-04 | 6.40e-03 | 51 |
| GO:00022742 | Breast | DCIS | myeloid leukocyte activation | 28/1390 | 223/18723 | 4.37e-03 | 3.41e-02 | 28 |
| GO:0006091110 | Esophagus | ESCC | generation of precursor metabolites and energy | 331/8552 | 490/18723 | 3.86e-23 | 8.45e-21 | 331 |
| Page: 1 2 |
| Pathway ID | Tissue | Disease Stage | Description | Gene Ratio | Bg Ratio | pvalue | p.adjust | qvalue | Count |
| Page: 1 |
Top |
Cell-cell communication analysis |
| Identification of potential cell-cell interactions between two cell types and their ligand-receptor pairs for different disease states |
| Ligand | Receptor | LRpair | Pathway | Tissue | Disease Stage |
| Page: 1 |
Top |
Single-cell gene regulatory network inference analysis |
| Find out the significant the regulons (TFs) and the target genes of each regulon across cell types for different disease states |
| TF | Cell Type | Tissue | Disease Stage | Target Gene | RSS | Regulon Activity |
| ∗The dot plots of a searched regulon are shown for all cell subpopulations in each disease state of each tissue based on the regulon specific score inferred using pySCENIC and by calculating the average expression. |
| Page: 1 |
Top |
Somatic mutation of malignant transformation related genes |
| Annotation of somatic variants for genes involved in malignant transformation |
| Hugo Symbol | Variant Class | Variant Classification | dbSNP RS | HGVSc | HGVSp | HGVSp Short | SWISSPROT | BIOTYPE | SIFT | PolyPhen | Tumor Sample Barcode | Tissue | Histology | Sex | Age | Stage | Therapy Types | Drugs | Outcome |
| DHRS2 | SNV | Missense_Mutation | rs149593009 | c.164N>A | p.Arg55His | p.R55H | Q13268 | protein_coding | deleterious(0.02) | possibly_damaging(0.623) | TCGA-A8-A07L-01 | Breast | breast invasive carcinoma | Female | <65 | III/IV | Chemotherapy | CR | |
| DHRS2 | SNV | Missense_Mutation | c.586A>G | p.Thr196Ala | p.T196A | Q13268 | protein_coding | deleterious(0.03) | possibly_damaging(0.664) | TCGA-AR-A1AR-01 | Breast | breast invasive carcinoma | Female | <65 | III/IV | Unspecific | Docetaxel | PD | |
| DHRS2 | SNV | Missense_Mutation | rs148991912 | c.826N>T | p.Arg276Trp | p.R276W | Q13268 | protein_coding | tolerated_low_confidence(0.08) | benign(0) | TCGA-2W-A8YY-01 | Cervix | cervical & endocervical cancer | Female | <65 | I/II | Chemotherapy | cisplatin | CR |
| DHRS2 | SNV | Missense_Mutation | rs148435951 | c.74N>A | p.Ser25Asn | p.S25N | Q13268 | protein_coding | deleterious(0.01) | possibly_damaging(0.465) | TCGA-C5-A1BQ-01 | Cervix | cervical & endocervical cancer | Female | >=65 | III/IV | Chemotherapy | cisplatin | CR |
| DHRS2 | SNV | Missense_Mutation | rs562008596 | c.110G>A | p.Arg37Gln | p.R37Q | Q13268 | protein_coding | deleterious(0.04) | benign(0.095) | TCGA-AA-A022-01 | Colorectum | colon adenocarcinoma | Female | >=65 | I/II | Unknown | Unknown | SD |
| DHRS2 | SNV | Missense_Mutation | c.596T>C | p.Leu199Pro | p.L199P | Q13268 | protein_coding | deleterious(0) | possibly_damaging(0.669) | TCGA-CK-6746-01 | Colorectum | colon adenocarcinoma | Female | >=65 | I/II | Unknown | Unknown | SD | |
| DHRS2 | SNV | Missense_Mutation | rs149593009 | c.164N>A | p.Arg55His | p.R55H | Q13268 | protein_coding | deleterious(0.02) | possibly_damaging(0.623) | TCGA-CM-6162-01 | Colorectum | colon adenocarcinoma | Female | <65 | III/IV | Chemotherapy | oxaliplatin | SD |
| DHRS2 | SNV | Missense_Mutation | c.787N>A | p.Ala263Thr | p.A263T | Q13268 | protein_coding | tolerated_low_confidence(0.13) | benign(0.276) | TCGA-F4-6570-01 | Colorectum | colon adenocarcinoma | Female | >=65 | I/II | Unknown | Unknown | SD | |
| DHRS2 | SNV | Missense_Mutation | rs562246921 | c.263N>T | p.Ala88Val | p.A88V | Q13268 | protein_coding | tolerated(0.27) | benign(0.009) | TCGA-AG-3892-01 | Colorectum | rectum adenocarcinoma | Female | <65 | I/II | Unknown | Unknown | SD |
| DHRS2 | SNV | Missense_Mutation | novel | c.728T>A | p.Ile243Asn | p.I243N | Q13268 | protein_coding | deleterious(0) | benign(0.009) | TCGA-A5-A0G2-01 | Endometrium | uterine corpus endometrioid carcinoma | Female | <65 | III/IV | Unknown | Unknown | SD |
| Page: 1 2 3 4 |
Top |
Related drugs of malignant transformation related genes |
| Identification of chemicals and drugs interact with genes involved in malignant transfromation |
| (DGIdb 4.0) |
| Entrez ID | Symbol | Category | Interaction Types | Drug Claim Name | Drug Name | PMIDs |
| Page: 1 |

Copyright 2023-Present -The University of Texas Health Science Center at Houston |